

Abstract
Troponin is the singular Ca2+-sensitive protein in the contraction of vertebrate striated muscles. Troponin C (TnC), the Ca2+-binding subunit of the troponin complex, has two distinct domains, C and N, which have different properties despite their extensive structural homology. In this work, we analyzed the thermodynamic stability of the isolated N-domain of TnC using a fluorescent mutant with Phe 29 replaced by Trp (F29W/N-domain, residues 1–90). The complete unfolding of the N-domain of TnC in the absence or presence of Ca2+ was achieved by combining high hydrostatic pressure and urea, a maneuver that allowed us to calculate the thermodynamic parameters (ΔV and ΔGatm). In this study, we propose that part of the affinity for Ca2+ is contributed by the free-energy change of folding of the N- and C-domains that takes place when Ca2+ binds. The importance of the free-energy change for the structural and regulatory functions of the TnC isolated domains was evaluated. Our results shed light on how the coupling between folding and ion binding contributes to the fine adjustment of the affinity for Ca2+ in EF-hand proteins, which is crucial to function.
INTRODUCTION
Troponin C (TnC) is a member of the EF-hand family, which encompasses several proteins sharing a common helix-loop-helix motif responsible for Ca2+ binding (1,2). TnC is a subunit of the troponin complex (TnC, TnI, and TnT), which, in concert with tropomyosin, modulates the cyclic interaction between myosin and actin during muscle contraction (for review, see the articles by Farah and Reinach (3); Tobacman (4); Squire and Morris (5); and Gordon et al. (6)).
The Ca2+-dependent competition between actin and TnC for the inhibitory peptide region of TnI is a key feature of current models of the mechanism of Ca2+ signaling in the regulated thin filament. NMR structural studies have demonstrated a bulk movement of helices B and C of the N-domain with little change in helical content on Ca2+ binding (7). This change in conformation exposes a hydrophobic pocket that is part of an antiparallel motif for the interaction with TnI and initiates signal transmission to the rest of the regulated thin filament (3,8). These structural alterations are referred to as the opening of the N-domain. Thus, the N-domain of TnC plays a crucial role in muscle contraction.
Sites I and II located in the N-domain bind Ca2+ specifically with a relatively low affinity (Ka[Ca] ∼ 105 M−1), whereas sites III and IV in the C-domain bind Ca2+ with a higher affinity (Ka[Ca] ∼ 107 M−1) and also bind Mg2+ (Ka[Mg] ∼ 103 M−1) (9). In addition to the two classes of sites, there is evidence for an additional class, the weak sites, that bind Mg2+ and Ca2+ with very low affinity (Ka[Ca,Mg] ∼ 102–103 M−1) (9–13). Recently, we observed that Ca2+ and Mg2+ binding to weak sites of the TnC C-domain induces exposure of a large hydrophobic surface that leads to loss of TnC from the thin filament (13). It is postulated that the C-domain has a structural role, whereas the N-domain displays regulatory function for the reasons stated above.
In a previous study (14), we used F105W/C-domain (residues 88–162) and F105W (residues 1–162) to address questions related to the stability of the C-domain, using W105 (located in site III) as a probe. Monitored by changes in Trp emission, the C-domain apo state was denatured by pressure (in the range of 1–1000 bar) in the absence of urea. The addition of Ca2+ or Mg2+ increased the C-domain stability so that complete denaturation was attained only by the combined use of high hydrostatic pressure and subdenaturing concentrations of urea. This combination allowed us to calculate the thermodynamic parameters (ΔV and ΔG°atm) for folding of the C-domain in the presence of Ca2+ or Mg2+. In this study, we used the F29W/N-domain (residues 1–90) to address questions related to the stability of the N-domain after the spectroscopic changes that take place in the N-domain using W29, close to the beginning of the Ca2+-binding loop of site I. Upon Ca2+ binding, the fluorescence emission of W29 increases ∼3-fold, suggesting that this residue reflects the loss of a nearby quenching group. We have shown previously (15) that the combination of high pressure and low temperature (−11°C) in the absence of added Ca2+ promotes the same increment in the fluorescence emission of the F29W/N-domain. This finding suggests that pressure and low temperature together can drive the N-domain of TnC into a conformation that resembles the conformation caused by Ca2+ binding. The explanation for this observation was that low temperatures, in combination with high pressure, weaken hydrophobic interactions, thus facilitating the opening of the N-domain. The possibility of trapping this opened conformation under pressure enabled us to calculate the thermodynamic parameters associated with the opening of the N-domain. The free-energy change found was small and positive (1.9 kcal/mol). Under physiological conditions, the binding of Ca2+ to the N-domain overcomes this barrier and displaces the equilibrium toward exposure of the hydrophobic patch that anchors TnI so that the overall reaction occurs spontaneously.
In this study, we investigate the thermodynamic stability of the F29W/N-domain by combining high pressure with subdenaturing concentrations of urea. High pressure has been a crucial tool in exploring the thermodynamics and kinetics of protein folding and protein interactions (16–21). Using this maneuver, we constructed a complete thermodynamic cycle for the F29W/N-domain in all of its occupancy states. Additionally, by performing pressure titration at 1°C, we evaluated the effects of low temperature on the thermodynamic stability of the F29W/N-domain, because the N-domain has a higher affinity for Ca2+ in this condition (15). In combination with our previous article (14) in which denaturation of the C-domain was investigated, we observed that the increase in stability of the C-domain when Ca2+ binds is >50% greater than that caused by Ca2+ binding to the N-domain. However, the sites in the C-domain (III and IV) have a higher affinity for Ca2+ than the sites in the N-domain (I and II). We propose that part of this higher affinity for Ca2+ comes from the greater free-energy change of folding that takes place when Ca2+ binds to the C-domain. Our data illustrate the importance of free-energy linkage between folding and calcium binding in EF-hand proteins. The physiological relevance of the thermodynamic parameters for muscle contraction is also discussed.
MATERIALS AND METHODS
Reagents and protein preparation
The N-domain mutant (F29W/N-domain, residues 1–90) was prepared as described previously (22). All reagents were of analytical grade. Distilled water was filtered and deionized through a Millipore (Billerica, MA) water purification system. The experiments under pressure were performed in the standard buffer (100 mM Tris-HCl, 100 mM KCl, 1.0 mM diothiothreitol (DTT), and 1.5 mM EGTA, pH 7.0). Tris-HCl buffer was selected as a buffer because the dependence of its pKa on pressure is small. At 3.0 kbar, the pKa increases by only 0.1 units (23). Temperature control was achieved through the use of a circulating water bath.
Spectroscopic measurements
The Trp fluorescence spectra were recorded on a spectrofluorometer (ISSK2; ISS, Champaign, IL). Samples were excited at 280 nm, and the emission was collected from 300 to 400 nm. Tryptophan fluorescence spectra at pressure p or in the presence of any concentration of urea u were quantified as the center of spectral mass 〈νp,u〉, in cm−1 as follows:
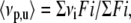 |
(1) |
where Fi stands for the fluorescence emitted at wavenumber νi and the summation is carried out over the range of appreciable values of F.
The degree of denaturation (α) in a given condition was calculated from the changes in center of spectral mass (ν) in that condition as follows:
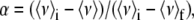 |
(2) |
where 〈ν〉i is the initial value of center of spectral mass (native protein) and 〈ν〉f is the final value (unfolded protein). Spectra were recorded after 5 min of equilibration at each pressure. For the urea denaturation curves, the samples were incubated for 1 h in each concentration of urea. The protein concentration was 5 μM in all measurements. All spectroscopic changes reported were completely reversible.
Thermodynamic parameters
The Gibbs free-energy change and the equilibrium constant for a given reaction depend on the standard volume change of the reaction (ΔV) according to the relation as follows:
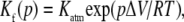 |
(3) |
where Kf(p) and Katm are the equilibrium constants of folding at pressure p and 1 bar, respectively. If we introduce the extent of reaction at pressure p, αp, we deduce the following thermodynamic relation (24,25) as follows:
 |
(4) |
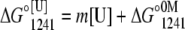
For apo and Ca2+-bound states, pressure alone was not enough to promote a complete unfolding. Then, the experiments were performed in the presence of increasing concentrations of urea. However, the volume change (ΔV) increased linearly with the addition of urea, leveling off at the highest concentration of urea used (Table 1). This type of behavior makes the use of the direct relation between ΔG and the unfolding constant (Katm) inappropriate. Thus, we first determined the free-energy change at 1241 bar in the presence of different concentrations of urea (Eq. 5). The extrapolation of this plot to 0 M urea gives  This value was introduced into Eq. 6 to determine the free-energy change at atmospheric pressure (ΔG°atm) as follows:
 |
(5) |
 |
(6) |
where  and
and  represent the free-energy change at 1241 bar in the presence or absence of urea, respectively, and m is a constant proportional to the difference in solvent-accessible surface area as the protein unfolds (26). The volume change used in Eq. 6 was the highest value observed (marked in bold in Table 1). We chose 1241 bar because this pressure is close to the p50 values of the majority of the curves. In all experiments, the spectroscopic changes were reversible after pressure release.
TABLE 1.
Values of volume change (ΔV) obtained at 1°C and 20°C
| apo
|
2.1 mM CaCl2
|
||||
|---|---|---|---|---|---|
| 1°C | 20°C | 1°C | 20°C | ||
| Urea (M) | ΔV (ml/mol) | ΔV (ml/mol) | Urea (M) | ΔV (ml/mol) | ΔV (ml/mol) |
| 2.0 | – | 30.19 ± 0.69 | 5.0 | 41.66 ± 0.95 | 36.74 ± 0.76 |
| 2.5 | 44.82 ± 1.28 | 38.13 ± 1.73 | 5.5 | 48.69 ± 0.74 | 36.60 ± 1.40 |
| 3.0 | 49.58 ± 1.08 | 44.24 ± 1.68 | 6.0 | 51.04 ± 1.12 | 46.39 ± 1.12 |
| 3.5 | 49.89 ± 2.03 | 48.62 ± 2.03 | 7.0 | 61.58 ± 1.09 | 59.59 ± 0.73 |
| 8.0 | — | 60.65 ± 3.95 | |||
Pressure (0–3000 bars) was applied in steps at each urea concentration and the extent of reaction (αp, from the change in center of mass) was plotted according to Eq. 3 to obtain ΔV (ml/mol).
Circular dichroism measurements
Circular dichroism (CD) measurements were performed in a spectropolarimeter (Jasco-715; Jasco, Tokyo, Japan) using a 1.0 mm pathlength quartz cuvette. For spectra determinations, stock solutions of protein were prepared in 10 mM Tris-HCl, 100 mM KCl, 1 mM DTT, and 1.5 mM EGTA, at pH 7.0, in the absence or in the presence of 2.1 mM CaCl2 and 8 M urea. Data were averaged for two scans at a speed of 50 nm/min collected in 0.2 nm steps.
RESULTS
Spectroscopic changes of the F29W/N-domain in the apo and Ca2+-bound states during unfolding
The Trp in the N-domain presents a threefold increase in its emission (Fig. 1) and a slight blue shift (152 cm−1) when the apo protein binds Ca2+ (Fig. 1, inset). This displacement of the spectrum to the blue reflects the movement of Trp to the hydrophobic core of the protein. As expected (22), the addition of Mg2+ did not alter the fluorescence spectrum of the F29W/N-domain (data not shown).
FIGURE 1.

Fluorescence emission spectra of the F29W/N-domain in the absence (solid line) or presence of 2.1 mM CaCl2 (dotted line). (Inset) Normalized fluorescence emission spectra. The protein concentration was 5 μM. The samples were excited at 280 nm, and the emission measured from 300 to 400 nm. The solvent conditions were 100 mM Tris-HCl, 100 mM KCl, 1.0 mM DTT, and 1.5 mM EGTA, pH 7.0, at 20°C.
The spectroscopic changes that take place during urea-induced unfolding of the F29W/N-domain in the apo and Ca2+-bound states at 20°C are depicted in Fig. 2. In the absence of divalent cations, the center of mass in 8 M urea lies at 28,414 cm−1. This value reflects the exposure of the Trp to the aqueous environment, suggesting that urea promotes complete denaturation of the F29W/N-domain. Strikingly, the center of spectral mass of the Ca2+-bound form did not change even at high concentrations of urea. These data show that the structure of the F29W/N-domain is remarkably stable when Ca2+ is bound, as seen with the C-domain (14). The unfolding process is better visualized when the degree of denaturation (α) is plotted as a function of urea concentration (Fig. 2, inset).
FIGURE 2.

Exposure of W29 after the addition of urea. The F29W/N-domain in the absence (open circles) or presence (solid circles) of 2.1 mM CaCl2. (Inset) Extent of unfolding (α) for the urea-induced unfolding of the F29W/N-domain as calculated in Materials and Methods. Other conditions are the same as those described in Fig. 1 legend.
The structural stability of the N-domain was also analyzed by CD experiments. Fig. 3 shows the far-ultraviolet (UV) CD spectra of the F29W/N-domain in the absence and presence of Ca2+ with or without 8 M urea. The addition of Ca2+ induced an increase in negative ellipticity that can be attributed, in part, to an increase in its α-helical content (22). In agreement with the result obtained by fluorescence (Fig. 2), Ca2+ binding to the F29W/N-domain stabilized the secondary structure, because 8 M urea produced no change in the CD signal at 222 nm. In contrast, the apo form of the F29W/N-domain was completely denatured in the presence of 8 M urea. The profile of urea denaturation, as measured by the changes in CD, overlaps with those obtained by the changes in fluorescence spectra (data not shown), indicating that the exposure of the W29 residue to the aqueous environment reflects the changes in global folding rather than only local changes.
FIGURE 3.

Far-UV CD spectra of the F29W/N-domain. Conditions: apo form (solid line); plus 2.1 mM CaCl2 (dashed line); apo form in the presence of 8 M urea (dotted/dashed line); and plus 2.1 mM CaCl2 in the presence of 8 M urea (dotted line). Protein concentration was 12 μM. The solvent conditions were 10 mM Tris-HCl, 100 mM KCl, 1.0 mM DTT, and 1.5 mM EGTA, pH 7.0.
Pressure-induced denaturation of the F29W/N-domain
To study the unfolding of the F29W/N-domain in the presence of Ca2+, we took advantage of the combined use of high pressure and subdenaturing concentrations of urea as perturbing agents. Figs. 4 and 5 show the effects of high pressure on the structure of the F29W/N-domain in the apo and Ca2+-bound states at 20°C (Fig. 4) and 1°C (Fig. 5). High pressure in the absence of urea did not lead to complete exposure of Trp to the solvent, irrespective of whether Ca2+ was present (Fig. 4, open circles). However, by combining pressure and subdenaturing concentrations of urea, it was possible to observe a large red shift in the Trp emission to a value compatible with its complete exposure to the aqueous environment (∼28,400 cm−1). As expected, the concentrations of urea necessary to denature the N-domain in the apo state were lower (2.5–3.5 M) than in the Ca2+-bound state (6.0–8.0 M).
FIGURE 4.

Effects of high pressure combined with urea on the center of spectral mass of the F29W/N-domain, at 20°C. (A) In the absence of divalent cations: without urea (open circles); plus 2 M (open squares), 2.5 M (open triangles facing up), 3.0 M (open triangles facing down), or 3.5 M (open diamonds) urea; and (B) in the presence of 2.1 mM CaCl2: without urea (open circles); plus 4 M (solid triangles up), 5 M (solid triangles down), 6 M (solid diamonds), 7 M (solid squares), or 8 M urea (solid circles). Protein concentration was 5 μM. All other conditions were the same as those described in Fig. 1 legend.
FIGURE 5.

Effects of high pressure combined with urea on the center of spectral mass of the F29W/N-domain at 1°C. (A) In the absence of divalent cations: plus 2.5 M (open squares); 3.0 M (open triangles up), or 3.5 M (open triangles down) urea; and (B) in the presence of 2.1 mM CaCl2: plus 5.0 M (solid circles); 5.5 M (solid squares); 6.0 M (solid triangles up) or 7.0 M (solid triangles down) urea. Protein concentration was 5 μM. All other conditions were the same as described in Fig. 1 legend.
Thermodynamic parameters of folding
From the pressure-denaturation curves in the presence of increasing concentrations of urea, it was possible to calculate the volume change of folding of the F29W/N-domain in the apo or Ca2+-bound state by the use of Eq. 4. Values of volume change (ΔV) of folding obtained at 20°C and 1°C are shown in Table 1. As seen with the C-domain, the volume change of folding increased with urea concentration until saturation was attained. The highest ΔV values were assumed to represent the equilibrium values. At 20°C, the highest values were 48.6 mL/mol and 60.7 mL/mol, which were obtained in the absence and presence of Ca2+, respectively. As observed in Table 1, lowering the temperature did not affect the maximal ΔV.
Table 2 shows the changes in volume derived from the pressure effects on the N-domain structure as evaluated by 1H-NMR spectroscopy. Because the high-pressure NMR cell can withstand up to 5 kbar (27), it is possible to derive the values of volume change in the absence of urea for the conditions without Ca2+. As observed for the C-domain of TnC (14), the largest magnitudes for ΔV were associated with the amino acid residues that are located in the hydrophobic core of the protein. The deviations in ΔV along the protein demonstrate how unfolding affects protein structure in a site-specific manner, which noticeably depends on the stabilizing forces in the local environment of each residue. The values obtained by NMR for the amino acid sites located in the hydrophobic core in the absence of urea (30–42 mL/mol) are close to those obtained using the changes in the fluorescence of W29 in the presence of urea (Table 1). The tryptophan fluorescence reflects the overall tertiary structure, whereas the NMR reflects the changes in the local environment of the amino acid residues. However, as observed for troponin C C-domain (14), the close correspondence between the volume change obtained by fluorescence and those values measured by NMR for residues that are closely packed in the hydrophobic core permits us to use fluorescence to explore the pressure denaturation of the N-domain at different concentrations of urea.
TABLE 2.
Experimental volume changes obtained from the pressure dependence of the peak areas for selected peak in the F29W/N-domain 1H-NMR spectra
| Peak | ΔV (ml/mol) | Structural description |
|---|---|---|
| F22NH | 30 ± 2 | |
| K23NH | 8 ± 5 | |
| W29NH | 15 ± 2 | Core |
| G35NH | 42 ± 0.4 | Loop I |
| I37γCH3 | 30 ± 3 | β-sheet, core |
| S70NH | 10.2 ± 0.4 | Loop II |
| G71NH | 41.9 ± 0.4 | Loop II |
To obtain the ΔG°atm for the folding process at 20°C and 1°C from the fluorescence experiments, we calculated the free-energy change at 1241 bar ( ). This approach was used because of the two slopes present in the unfolding curves in the presence of Ca2+. Thus, we calculated the free-energy change at 1241 bar in the presence of different concentrations of urea for the apo or Ca2+-bound state of the F29W/N-domain (Fig. 6). The extrapolation of these curves to the y axis (0 M urea) furnishes ΔG° in the absence of urea at 1241 bar (
 ). Through the use of Eq. 6, we assessed the ΔG° at atmospheric pressure in the absence of urea (ΔG°atm). For the F29W/N-domain apo form at 20°C and 1°C, these values were −3.4 and −3.1 kcal/mol, respectively. In the Ca2+-bound form, the ΔG°atm of folding was −5.8 at 20°C and −6.8 kcal/mol at 1°C (Table 3).
FIGURE 6.

Assessing the free-energy change for denaturation of the N-domain in the absence of urea. The ΔV values at 1241 bar obtained from Figs. 4 and 5 are shown in the absence (open circles and open squares) and in the presence (solid circles and solid squares) of 2.1 mM CaCl2 at 20°C (circles) and at 1°C (squares). The ΔG° at 1241 bar in the absence of urea was obtained by extrapolation of these curves to the y axis. The values are the average of three experiments, and error bars were smaller than the symbols.
TABLE 3.
ΔG°atm of folding of N-domain obtained at 1°C and 20°C
| 1°C
|
20°C
|
|||
|---|---|---|---|---|
| apo | Ca2+ | apo | Ca2+ | |
| ΔG°atm (kcal/mol) | −3.07 ± 0.25 | −6.67 ± 0.29 | −3.40 ± 0.24 | −5.82 ± 0.50 |
Values shown are mean ± SD (n = 3).
DISCUSSION
TnC is the Ca2+-binding subunit of the troponin complex and has two distinct domains, C and N, which show different properties despite their high structural homology. In this study, we analyzed the thermodynamic stability of the N-domain of TnC using a fluorescent mutant with Phe 29 replaced by Trp. In a previous study (27), we used the atomic structures available for TnC (28,29) to perform molecular simulations on the replacement of phenylalanine at position 29 with tryptophan. Energy-minimized structures of wild-type and F29W chicken skeletal N-domain fragments (residues 3–90) were obtained from the 4tnc x-ray structure (28) and showed that the mutation minimally disrupts the main chain carbons of the protein. The calcium-binding loop I, adjacent to the mutation, showed a small change in structure because of the adjustment to W29, a larger and less hydrophobic residue. However, the molecular simulations clearly demonstrated that there are only minor changes in the position of the side chains in the hydrophobic core of the mutant form compared to the wild-type. In contrast, the localization of W29 in a hydrophobic pocket close to Ca-binding loop I makes it an excellent probe for the coupling between folding and calcium binding. In the absence of calcium, the addition of high concentrations of urea promotes a complete red shift in the Trp emission. In the presence of calcium, the complete unfolding of the N-domain of TnC could only be achieved by combining high hydrostatic pressure and urea, which allowed us to determine the thermodynamic parameters. In general, our study goals are to evaluate the relevance of the free-energy change of the N- and C-domains to muscle contraction.
The factors that determine the affinity and selectivity of sites I, II, III, and IV of TnC for Ca2+ have been studied extensively (30,31). Using five recombinant chicken TnC fragments, Fredricksen and Swenson (32) documented an inverse correlation between protein stability and affinity for Ca2+, and we have confirmed this inverse relationship (33). We observed that a progressive increase in the thermodynamic stability of the N-domain induced by glycerol was accompanied by a decrease in Ca2+ affinity. However, this inverse relationship has not been found in all situations. Henzl and coworkers (34) observed that introduction of a fifth carboxylate residue at the +z position in the CD coordination sphere or at the −x position in the EF coordination sphere significantly increases the affinity of oncomodulin sites for Ca2+. As shown in Table 4 and observed by Henzl et al. (34), this increase in Ca2+ affinity was accompanied by a decrease in thermodynamic stability of S55D, G98D, and 55/98 double mutant apo forms, as determined by differential scanning calorimetry. However, the thermal stability of S55D and its affinity for Ca2+ are lower than the corresponding values for the G98D mutant. This behavior would not be predicted from the data of Fredricksen and Swenson (32). In another study, Grabarek et al. (35) observed that acetylation of rabbit skeletal TnC causes a decrease in thermal stability of both domains of TnC in the absence of Ca2+. This decrease in thermal stability was accompanied by a 3.5-fold increase in affinity for Ca2+ at the low-affinity sites, but there was a twofold decrease in affinity at the high-affinity sites.
TABLE 4.
Values of pCa50 and ΔG°atm for wild-type oncomodulin and its mutants (34)
| pCa50 (CD site) | pCa50 (EF site) | ΔG°atm (kcal/mol)
|
ΔΔG°atm (kcal/mol) | ||
|---|---|---|---|---|---|
| apo | Ca2+ | ||||
| 1. WT | 6.10 | 7.35 | −3.9 | −12.6 | −8.7 |
| 2. S55D | 6.10 | 7.40 | −2.6 | −13.1 | −10.5 |
| 3. G98D | 7.17 | 7.59 | −3.2 | −15.0 | −11.8 |
| 4. 55/98 | 7.35 | 8.40 | −2.4 | −15.9 | −13.5 |
ΔΔG°atm was calculated by subtracting the value for ΔG°atm of the apo form from that of the Ca2+-bound form.
Temperature: 25°C.
In this study, by the combined use of high pressure and subdenaturing concentrations of urea, we assessed all the thermodynamic parameters for the folding of the N-domain of TnC in all of its occupancy states. The free-energy change (ΔG°atm) for the folding of the N-domain apo form at 20°C was −3.4 kcal/mol. This value is identical to the one obtained by 1H-NMR, using the F26δ resonance peak change that was induced by high temperatures (27). At 1°C, the ΔG°atm increases, suggesting that lowering the temperature decreases the hydrophobic contacts responsible for part of the stability of the F29W/N-domain. This decrease and consequent lessened stability renders the protein more sensitive to the pressure denaturation in the presence of urea. In contrast, Ca2+ binding to the F29W/N-domain increases its stability. It is interesting to note that, at 1°C, Ca2+ binding induces greater enhancement of the N-domain stability (Table 3). This behavior is expected, because the Ca2+-binding reaction (N-domain ⇔ N-domain-Ca2) occurs with a negative ΔG° derived from a large negative enthalpy change and a small change in entropy (36).
The high-pressure NMR experiments were complementary to the fluorescence data because they enabled us to derive values of ΔV for amino acid residues located in distinct regions of the protein structure (Table 2). High-pressure NMR has been successfully used to explore the protein conformation space (20,37,38). It would be expected that the greatest net change in volume would occur for regions that are highly packed in the folded protein, such as the hydrophobic core. Within the core, hydrophobic interactions are maximized, and these interactions are crucial for the proper folding and stabilization of the native state of the protein. Similar to what was found for the TnC C-domain (14), the largest ΔV values for the TnC N-domain were found for residues located in the hydrophobic core (Table 2), and they are similar to the values derived from the fluorescence experiments. Thus, the thermodynamic values derived from the fluorescence experiment represent the average behavior of the tertiary conformation of the protein, whereas the NMR changes reveal the site-specific changes.
In the free-energy diagram shown in Fig. 7, we compare the free-energy changes for the folding of the N- and C-domains. The free-energy change for folding of the C-domain apo form is very low, confirming its poor stability. Upon Mg2+ binding, its stability increases by 1.63 kcal/mol. The addition of Ca2+ to the C-domain increases its stability by 4.14 kcal/mol, whereas addition of Ca2+ to the N-domain increases its stability by 2.42 kcal/mol. Thus, the increase in stability gained by the C-domain when Ca2+ binds is >50% greater than the gain due to Ca2+ binding to the N-domain. The values of ΔG°atm and pCa50 for TnC are shown in Table 5. Fig. 8, A and B, shows the plot of ΔΔG°atm between the apo and Ca2+-bound states versus pCa50 for TnC and oncomodulin, respectively, and demonstrates a good correlation between ΔΔG°atm and pCa50. Moreover, the affinity for Ca2+ rises when ΔΔG°atm increases in absolute terms. Thus, we suggest that part of the affinity for Ca2+ comes from the contribution of the free-energy change of folding that takes place when Ca2+ binds. The excellent correlation between the processes of protein folding and binding of Ca2+ is quite remarkable.
FIGURE 7.

Thermodynamic diagram for the folding of the N- and C-domains.
TABLE 5.
Values of pCa50, ΔG°atm, and ΔΔG°atm calculated in this study and in previous articles
| ΔG°atm (kcal/mol)
|
ΔΔG°atm (kcal/mol) | |||
|---|---|---|---|---|
| pCa50 | Ca2+ | apo | ||
| 1. F105W/ C-domain (20°C) | 6.93* | −4.56‡ | −0.42‡ | −4.14‡ |
| 2. F105W (20°C) | 6.66* | −4.44‡ | −0.44‡ | −4.0‡ |
| 3. F29W/N-domain (1°C) | 6.54† | −6.67 | −3.07 | −3.60 |
| 4. F29W/N-domain (20°C) | 5.90† | −5.82 | −3.40 | −2.42 |
(22).
(15).
(14).
FIGURE 8.

Plot of ΔΔG°atm between apo and Ca2+-bound states versus pCa50 for TnC (A) and oncomodulin (B). The values of ΔG°atm and pCa50 of TnC are shown in Table 4: 1-F105W/ C-domain (20°C); 2-F105W (20°C); 3-F29W/N-domain (1°C); 4-F29W/N-domain (20°C)). (B) pCa50 of EF site (open circles) and pCa50 of CD site (solid circles) of oncomodulin versus ΔΔG°atm. The values of ΔG°atm and pCa50 were obtained by Henzl et al. (34).
The free-energy diagram shown in Fig. 7 also demonstrates that the apo form of the C-domain is much less structured than the N-domain, which leads to more coupling when Ca2+ binds. The linkage between folding and binding has been observed in many proteins, especially when they are unstructured or partially structured (39). In particular, Ca2+-induced changes in protein conformations are the basis for Ca2+-dependent signaling in the cell (40). It is of note that, in the case of TnC, the two domains present different degrees of coupling between metal binding and folding. In the case of the N-domain, the higher stability of the apo form might be related to the need to populate a species that exposes a hydrophobic surface when it binds Ca2+ (15). This form is represented in the diagram shown in Fig. 7 as an intermediate (N*) that was demonstrated to exist by different experimental techniques (fluorescence intensity changes, Ca2+-binding curves, Trp lifetimes, and bis-ANS binding). This N* intermediate has a nonpolar segment exposed to the aqueous environment and a high affinity for Ca2+ (15). Although this conformation can be populated by the combination of pressure and low temperature (2.2 kbar and −11°C) and therefore has a high chemical potential, it is still more stable and ordered than the apo TnC/C-domain. The two domains of TnC have evolved to play different roles in the same molecule, each being strictly dependent on coupling, folding, and binding events in the presence of different concentrations of Ca2+ or Mg2+, as required for different signaling and background conditions.
Acknowledgments
The authors thank Lawrence B. Smillie and Joyce R. Pearlstone for donating the protein and for helpful suggestions; Aimee Yu and Lance Ballard for the experiments with NMR spectroscopy; and Emerson R. Gonçalves for competent technical assistance.
This work was supported by grants from the Conselho Nacional de Desenvolvimento Científico e Tecnológico (CNPq), Millennium Institute for Structural Biology in Biomedicine and Biotechnology (CNPq Millennium Program), Fundação Carlos Chagas Filho de Amparo à Pesquisa do Estado do Rio de Janeiro (FAPERJ), and Financiadora de Estudos e Projetos (FINEP) of Brazil (to D.F., J.L.S. and M.M.S.). C. B. R. and M. C. S. have fellowships from FAPERJ.
This work is dedicated to Leopoldo de Meis in commemoration of his 70th birthday.
Marisa C. Suarez and Cristiane B. Rocha contributed equally to this work.
Editor: Heinrich Roder.
References
- 1.Strynadka, N. C., and M. N. James. 1989. Crystal structures of the helix-loop-helix calcium-binding proteins. Annu. Rev. Biochem. 58:951–998. [DOI] [PubMed] [Google Scholar]
- 2.Falke, J. J., S. K. Drake, A. L. Hazard, and O. B. Peersen. 1994. Molecular tuning of ion binding to calcium signaling proteins. Q. Rev. Biophys. 27:219–290. [DOI] [PubMed] [Google Scholar]
- 3.Farah, C. S., and F. C. Reinach. 1995. The troponin complex and regulation of muscle contraction. FASEB J. 9:755–767. [DOI] [PubMed] [Google Scholar]
- 4.Tobacman, L. S. 1996. Thin filament-mediated regulation of cardiac contraction. Annu. Rev. Physiol. 58:447–481. [DOI] [PubMed] [Google Scholar]
- 5.Squire, J. M., and E. P. Morris. 1998. A new look at thin filament regulation in vertebrate skeletal muscle. FASEB J. 12:761–771. [DOI] [PubMed] [Google Scholar]
- 6.Gordon, A. M., E. Homsher, and M. Regnier. 2000. Regulation of contraction in striated muscle. Physiol. Rev. 80:853–924. [DOI] [PubMed] [Google Scholar]
- 7.Gagné, S. M., S. Tsudo, M. X. Li, L. B. Smillie, and B. D. Sykes. 1995. Structures of the troponin C regulatory domains in the apo and calcium-saturated states. Nat. Struct. Biol. 2:784–789. [DOI] [PubMed] [Google Scholar]
- 8.Olah, G. A., and J. Trewhella. 1994. A model structure of the muscle protein complex 4Ca2+ troponin C troponin I derived from small-angle scattering data: implications for regulation. Biochemistry. 43:12800–12806. [DOI] [PubMed] [Google Scholar]
- 9.Potter, J. D., and J. Gergely. 1975. The calcium and magnesium binding sites on troponin and their role in the regulation of myofibrillar adenosine triphosphatase. J. Biol. Chem. 250:4628–4633. [PubMed] [Google Scholar]
- 10.Andersson, T., T. Drakenberg, S. Forsén, and E. Thulin. 1981. A 43Ca NMR and 25Mg NMR study of rabbit skeletal muscle troponin C: exchange rates and binding constants. FEBS Lett. 1:39–43. [DOI] [PubMed] [Google Scholar]
- 11.Hincke, M. T., W. D. McCubbin, and C. M. Kay. 1978. Calcium-binding properties of cardiac and skeletal troponin C as determined by circular dichroism and ultraviolet difference spectroscopy. Can. J. Biochem. 56:384–395. [DOI] [PubMed] [Google Scholar]
- 12.Johnson, J. D., J. H. Collins, S. P. Robertson, and J. D. Potter. 1980. A fluorescent probe study of Ca2+ binding to the Ca2+-specific sites of cardiac troponin and troponin C. J. Biol. Chem. 255:9635–9640. [PubMed] [Google Scholar]
- 13.Braga, C. A., J. R. Pinto, A. P. Valente, J. L. Silva, M. M. Sorenson, D. Foguel, and M. C. Suarez. 2006. Ca2+ and Mg2+ binding to weak sites of TnC C-domain induce exposure of a large hydrophobic surface that leads to loss of TnC from the thin filament. Int. J. Biochem. Cell Biol. 38:110–122. [DOI] [PubMed] [Google Scholar]
- 14.Rocha, C. B., M. C. Suarez, A. Yu, L. Ballard, M. M. Sorenson, D. Foguel, and J. L. Silva. 2008. Volume and free energy of folding for troponin C C-domain: linkage to ion binding and N-domain interaction. Biochemistry. 47:5047–5058. [DOI] [PubMed] [Google Scholar]
- 15.Foguel, D., M. C. Suarez, C. Barbosa, J. J. Rodrigues, M. M. Sorenson, L. B. Smillie, and J. L. Silva. 1996. Mimicry of the calcium-induced conformational state of troponin C by low temperature under pressure. Proc. Natl. Acad. Sci. USA. 93:10642–10646. [DOI] [PMC free article] [PubMed] [Google Scholar]
- 16.Mozhaev, V. V., K. Heremans, J. Frank, P. Masson, and C. Balny. 1996. High pressure effects on protein structure and function. Proteins. 24:81–91. [DOI] [PubMed] [Google Scholar]
- 17.Silva, J. L., D. Foguel, and C. A. Royer. 2001. Pressure provides new insights into protein folding, dynamics and structure. Trends Biochem. Sci. 26:612–618. [DOI] [PubMed] [Google Scholar]
- 18.Foguel, D., and J. L. Silva. 2004. New insights into the mechanisms of protein misfolding and aggregation in amyloidogenic diseases derived from pressure studies. Biochemistry. 43:11361–11370. [DOI] [PubMed] [Google Scholar]
- 19.Daniel, I., P. Oger, and R. Winter. 2006. Origins of life and biochemistry under high-pressure conditions. Chem. Soc. Rev. 35:858–875. [DOI] [PubMed] [Google Scholar]
- 20.Lassalle, M. W., and K. Akasaka. 2007. The use of high-pressure nuclear magnetic resonance to study protein folding. Methods Mol. Biol. 350:21–38. [DOI] [PubMed] [Google Scholar]
- 21.Mitra, L., K. Hata, R. Kono, A. Maeno, D. Isom, J. B. Rouget, R. Winter, K. Akasaka, B. García-Moreno, and C. A. Royer. 2007. V(i)-value analysis: a pressure-based method for mapping the folding transition state ensemble of proteins. J. Am. Chem. Soc. 129:14108–14109. [DOI] [PubMed] [Google Scholar]
- 22.Li, M. X., M. Chandra, J. R. Pearlstone, K. I. Racher, G. T. Gonzalez, T. Borgford, C. M. Kay, and L. B. Smillie. 1994. Properties of isolated recombinant N and C domains of chicken troponin C. Biochemistry. 33:917–925. [DOI] [PubMed] [Google Scholar]
- 23.Neuman, R. C., W. Kauzmann, and A. Zipp. 1973. Pressure dependence of weak acid ionization in aqueous buffers. J. Phys. Chem. 77:2687–2691. [Google Scholar]
- 24.Paladini, A. A., and G. Weber. 1981. Pressure-induced reversible dissociation of enolase. Biochemistry. 20:2587–2593. [DOI] [PubMed] [Google Scholar]
- 25.Bonafe, C. F., M. Villas-Boas, M. C. Suarez, and J. L. Silva. 1991. Reassembly of a large multisubunit protein promoted by nonprotein factors. Effects of calcium and glycerol on the association of extracellular hemoglobin. J. Biol. Chem. 266:13210–13216. [PubMed] [Google Scholar]
- 26.Myers, J. K., C. N. Pace, and J. M. Scholtz. 1995. Denaturant m values and heat capacity changes: relation to changes in accessible surface areas of protein unfolding. Protein Sci. 4:2138–2148. [DOI] [PMC free article] [PubMed] [Google Scholar]
- 27.Yu, A., L. Ballard, L. Smillie, J. Pearlstone, D. Foguel, J. Silva, A. Jonas, and J. Jonas. 1999. Effects of high pressure and temperature on the wild-type and F29W mutant forms of the N-domain of avian troponin C. Biochim. Biophys. Acta. 1431:53–63. [DOI] [PubMed] [Google Scholar]
- 28.Herzberg, O., and N. G. James. 1985. Structure of the calcium regulatory muscle protein troponin-C at 2.8 A resolution. Nature. 313:653–659. [DOI] [PubMed] [Google Scholar]
- 29.Satyshur, K. A., D. Pyzalska, M. Greaser, S. T. Rao, and M. Sundaralingam. 1994. Structure of chicken skeletal muscle troponin C at 1.78 A resolution. Acta. Crystallogr. D Biol. Crystallogr. 50:40–49. [DOI] [PubMed] [Google Scholar]
- 30.da Silva, A. C., and F. C. Reinach. 1991. Calcium binding induces conformational changes in muscle regulatory proteins. Trends Biochem. Sci. 16:53–62. [DOI] [PubMed] [Google Scholar]
- 31.Gagné, S. M., M. X. Li, and B. D. Sykes. 1997. Mechanism of direct coupling between binding and induced structural change in regulatory calcium binding proteins. Biochemistry. 36:4386–4392. [DOI] [PubMed] [Google Scholar]
- 32.Fredricksen, R. S., and C. A. Swenson. 1996. Relationship between stability and function for isolated domains of troponin C. Biochemistry. 35:14012–14026. [DOI] [PubMed] [Google Scholar]
- 33.Suarez, M. C., C. J. V. Machado, L. M. T. R. Lima, L. B. Smillie, J. R. Pearlstone, J. L. Silva, M. M. Sorenson, and D. Foguel. 2003. Role of hydration in the closed-to-open transition involved in Ca2+ binding by troponin C. Biochemistry. 42:5522–5530. [DOI] [PubMed] [Google Scholar]
- 34.Henzl, M. T., R. C. Hapak, and E. A. Goodpasture. 1996. Introduction of a fifth carboxylate ligand heightens the affinity of the oncomodulin CD and EF sites for Ca2+. Biochemistry. 35:5856–5869. [DOI] [PubMed] [Google Scholar]
- 35.Grabarek, Z., Y. Mabuchi, and J. Gergely. 1995. Properties of troponin C acetylated at lysine residues. Biochemistry. 34:11872–11881. [DOI] [PubMed] [Google Scholar]
- 36.Potter, J. D., F. J. Hsu, and H. J. Pownall. 1977. Thermodynamics of Ca2+ binding to troponin-C. J. Biol. Chem. 252:2452–2454. [PubMed] [Google Scholar]
- 37.Peng, X., J. Jonas, and J. L. Silva. 1993. Molten-globule conformation of Arc repressor monomers determined by high-pressure 1H NMR spectroscopy. Proc. Natl. Acad. Sci. USA. 90:1776–1780. [DOI] [PMC free article] [PubMed] [Google Scholar]
- 38.Kitahara, R., C. Royer, H. Yamada, M. Boyer, J. L. Saldana, K. Akasaka, and C. Roumestand. 2002. Equilibrium and pressure-jump relaxation studies of the conformational transitions of P13MTCP1. J. Mol. Biol. 320:609–628. [DOI] [PubMed] [Google Scholar]
- 39.Dyson, H. J., and P. E. Wright. 2002. Insights into the structure and dynamics of unfolded proteins from nuclear magnetic resonance. Adv. Protein Chem. 62:311–340. [DOI] [PubMed] [Google Scholar]
- 40.Ikura, M., M. Osawa, and J. B. Ames. 2002. The role of calcium-binding proteins in the control of transcription: structure to function. Bioessays. 24:625–636. [DOI] [PubMed] [Google Scholar]