Abstract
High glucose (30 mm) and high insulin (1 nm), pathogenic factors of type 2 diabetes, increased mRNA expression and synthesis of lamininβ1 and fibronectin after 24 h of incubation in kidney proximal tubular epithelial (MCT) cells. We tested the hypothesis that inactivation of glycogen synthase kinase 3β (GSK3β) by high glucose and high insulin induces increase in synthesis of laminin β1 via activation of eIF2Bε. Both high glucose and high insulin induced Ser-9 phosphorylation and inactivation of GSK3β at 2 h that lasted for up to 48 h. This was associated with dephosphorylation of eIF2Bε and eEF2, and increase in phosphorylation of 4E-BP1 and eIF4E. Expression of the kinase-dead mutant of GSK3β or constitutively active kinase led to increased and diminished laminin β1 synthesis, respectively. Incubation with selective kinase inhibitors showed that high glucose- and high insulin-induced laminin β1 synthesis and phosphorylation of GSK3β were dependent on PI 3-kinase, Erk, and mTOR. High glucose and high insulin augmented activation of Akt, Erk, and p70S6 kinase. Dominant negative Akt, but not dominant negative p70S6 kinase, inhibited GSK3β phosphorylation induced by high glucose and high insulin, suggesting Akt but not p70S6 kinase was upstream of GSK3β. Status of GSK3β was examined in vivo in renal cortex of db/db mice with type 2 diabetes at 2 weeks and 2 months of diabetes. Diabetic mice showed increased phosphorylation of renal cortical GSK3β and decreased phosphorylation of eIF2Bε, which correlated with renal hypertrophy at 2 weeks, and increased laminin β1 and fibronectin protein content at 2 months. GSK3β and eIF2Bε play a role in augmented protein synthesis associated with high glucose- and high insulin-stimulated hypertrophy and matrix accumulation in renal disease in type 2 diabetes.
Glycogen synthase kinase 3β (GSK3β)3 was originally identified as an enzyme required for the regulation of glycogen metabolism (1). However, it has been found to be involved in a variety of cellular responses including cytoskeletal regulation (2), cell cycle progression (3, 4), apoptosis (5, 6), and cell adhesion (7). GSK3β regulation of protein synthesis has not been completely understood. GSK3β acts as a switch that regulates both transcription and mRNA translation by controlling the activity of transcription factors and eukaryotic translation initiation factor 2Bε (eIF2Bε), respectively. In the resting cell, GSK3β is unphosphorylated and active, inhibiting the activity of its substrates, e.g. eIF2Bε and glycogen synthase. Upon stimulation, GSK3β is phosphorylated on Ser-9 and inactivated, leading to release of inhibition on activity of its substrates. Several kinases are implicated in Ser-9 phosphorylation of GSK3β including p70S6 kinase (8), p90RSK (9), PKC, PKA (10–12), and Akt (13, 14).
Augmented protein synthesis contributes to two cardinal manifestations of diabetic kidney disease, i.e. renal hypertrophy and accumulation of extracellular matrix proteins (15). However, the role of GSK3β in these events has not been investigated. Signaling mechanisms favoring renal hypertrophy have received much attention (16–25). In contrast, constitutive signaling mechanisms that counteract the prohypertrophic signaling mechanisms and check unrestricted progression of protein synthesis are not well understood. GSK3β appears to constitutively inhibit protein synthesis by its inhibition of eIF2Bε. We hypothesized that inactivation of GSK3β by high glucose and high insulin induces an increase in synthesis of laminin β1 via activation of eIF2Bε. We investigated if GSK3β is inactive in the kidney in type 2 diabetes. We employed both in vitro cell culture and in vivo animal models of type 2 diabetes in our investigation.
MATERIALS AND METHODS
Cell Culture—SV-40-immortalized murine kidney proximal tubular epithelial (MCT) cells (kindly provided by Dr. Eric Neilson, Vanderbilt University) were grown in Dulbecco's modified Eagle's medium containing 7% fetal bovine serum, 5 mm glucose, 100 units/ml penicillin, 100 μg/ml streptomycin, and 2 mm glutamine. MCT cells express in vivo properties of proximal tubular epithelial cells (26). Confluent cells were growth-arrested for 18 h in serum-free Dulbecco's modified Eagle's medium before experiment (23).
Immunoblotting—Equal amounts of protein from cells were separated by SDS-PAGE, transferred to a nitrocellulose membrane, and probed with primary antibody for 3 h (19, 27). Primary antibodies were from Cell Signaling (Beverly, MA) if not otherwise mentioned. Laminin β1 and GSK3β antibody were from Santa Cruz Biotechnology, fibronectin antibody was from Sigma, and phospho-eIF2Bε (Ser-539) was purchased from Upstate, Lake Placid, NY. After washing, the membrane was incubated with peroxidase-conjugated secondary antibody (Jackson ImmunoResearch Laboratories Inc, West Grove, PA). Proteins were visualized by chemiluminescence using the ECL reagent (Pierce Biotechnology, Rockford, IL). Images of the bands were scanned by reflectance scanning densitometry, and the intensity of the bands was quantified using Scion Image software (27). For immunoblot analysis of 4E-BP1 phosphorylation, cell lysates were heated at 100 °C for 7 min, and treated with 15% trichloroacetic acid. Immunoblotting was performed using an antibody specific for 4E-BP1 phosphorylated at Thr-37/46 (27).
GSK3β Immunokinase Activity Assay—Following treatment with high glucose or high insulin, cell lysates were prepared using the lysis buffer consisting of 50 mm Tris, 150 mm NaCl, 10% (v/v) glycerol, 0.5% (v/v) Nonidet P-40, 1 mm EDTA, 1 mm dithiothreitol, 500 μm Na3VO4, 500 μm NaF, 100 μm β-glycerophosphate, 100 μm sodium pyrophosphate, 10 μg/ml leupeptin, and 1% (v/v) aprotinin. 300 μg of total protein was incubated with 1 μg of monoclonal anti GSK3β (sc-81462) in a rotor for 12 h at 4 °C. The immune complexes were isolated by the addition of 25 μl of a slurry of protein A/G-agarose (sc-2003) and incubation for 2 h at 4 °C. Immunoprecipitates were washed twice with lysis buffer and twice with kinase reaction buffer (8 mm MOPS, pH 7.4, 0.2 mm EDTA, 10 mm magnesium acetate, 1 mm Na3VO4, 1 mm dithiothreitol, 2.5 mm β-glycerophosphate, 10 μg/ml leupeptin, and 1% (v/v) aprotinin). The kinase activity assays were performed in 40 μl of total reaction buffer containing 62.5 μm GSK3β substrate (BioMol, Plymouth, PA), 20 mm MgCl2, 125 μm ATP, and 10 μCi [γ-32P]ATP. The reaction mixture was allowed to proceed for 30 min at 30 °C, and 15 μl of the supernatant were spotted onto Whatman P81 phosphocellulose paper. The filter squares were washed five times for 5 min each in 0.75% phosphoric acid. The filters were then briefly rinsed in acetone, dried at room temperature, and subjected to liquid scintillation counting (28).
Real Time RT-PCR—MCT cells were lysed, and their total RNA was isolated by acid phenol extraction using TRIzol (Invitrogen, Carlsbad, CA). Equal amounts of total RNA (1 μg) from MCT cells were converted to first-strand cDNA by using reverse transcriptase. PCR primer sequences for amplification of mouse laminin β1 (Primer Bank ID 21595540a2), mouse fibronectin (Primer Bank ID 4218966a1) and mouse GAPDH (Primer Bank ID 6679937a1) were obtained from Primer Bank, a public resource for PCR primers (29). 2 μl of cDNA was amplified using SYBR Green PCR Master mix (Applied Biosystems, Foster City, CA) containing 100 nm forward and reverse primers. PCR amplification was performed using 7900HT Sequence Detection System (Applied Biosystems) using the manufacturer's protocol as recently described (21, 27). Dissociation curve analysis was performed following PCR amplification to confirm the specificity of the primers. Relative mRNA expression was calculated using the ΔΔCt method.
Transfection Studies—MCT cells were transiently transfected with plasmids containing the hemagglutinin (HA)-tagged kinase-dead (K85A) and constitutively active (S9A) constructs for GSK3β (Plasmids 14755 and 14754, respectively, Addgene, Cambridge, MA, deposited by Dr. Jim Woodgett) (30) using Lipofectamine-Plus reagent (Invitrogen) (19). Plasmid containing kinase-dead p70S6 kinase was also purchased from Addgene (Plasmid 8985, deposited by Dr. John Blenis) (31). Infection of MCT cells was carried out with (100 moi) of adenoviral vector expressing dominant negative HA-tagged Akt (Ad-DN-Akt) (32), and adenovirus containing green fluorescence protein (Ad-GFP) was used as the control.
Animal Study—The C57BL6/KsJ lepr-/-db/db mice, a model of type 2 diabetes, and its lean littermates (db/m) (Jackson Laboratory, Bar Harbor, ME), were maintained on regular laboratory chow. Blood glucose concentration was monitored for emergence of diabetes. In the present study, lean littermate control and diabetic mice were studied in the early phase, after 2 weeks of onset of hyperglycemia, and, in the late phase, at 2 months of hyperglycemia. Previously we have reported that db/db mice display renal hypertrophy at 2 weeks (23) and increase in laminin content at 2 months of diabetes (33). Mice were sacrificed at the end of each experimental period, and renal cortex was dissected out and processed for further analysis.
Statistical Analysis—All values are expressed as mean ± S.E. obtained from at least three independent experiments. Statistical analysis was performed using one-way analysis of variance (ANOVA) for comparison between multiple groups and posthoc analysis using Student's Newman Keul's multiple comparison tests using Graph Pad Prism 4 software. Statistical comparisons between two groups were performed by the Student's t test. Statistical significance was assigned to values of p < 0.05.
RESULTS
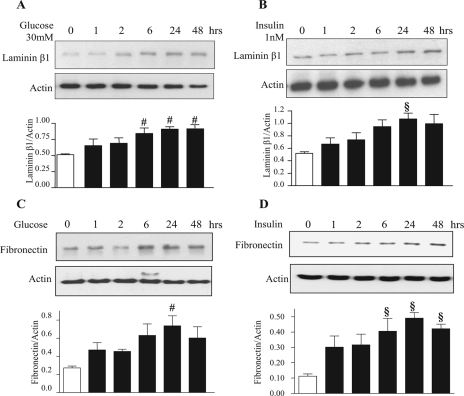
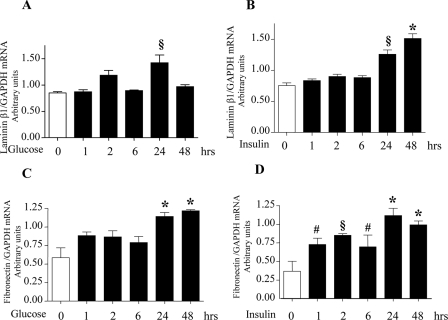
High Glucose and High Insulin Stimulate Laminin and Fibronectin Synthesis—Incubation of MCT cells with 30 mm glucose or 1 nm insulin stimulated synthesis of extracellular matrix proteins, laminin β1, and fibronectin, starting at 6 h and reaching a peak at 24 h (Fig. 1, A–D). We investigated if induction of synthesis of laminin β1 and fibronectin was due to an increase in their mRNA levels. Quantitative real time RT-PCR showed an increase in their respective mRNA content upon treatment with high glucose and high insulin (Fig. 2, A–D). Preincubation with actinomycin D, a transcription inhibitor, inhibited laminin β1 synthesis induced by high glucose and high insulin at 24 h but not at 1 and 2 h, suggesting transcriptional regulation at later time points and, possibly, translational regulation at early time points. Actinomycin-D inhibited high glucose- and high insulin-induced fibronectin synthesis at 2 and 24 h but not at 1 h, suggesting transcriptional regulation beyond 1 h of incubation (supplemental Fig. S1). We have previously reported that high glucose, high insulin, high glucose + high insulin increased de novo protein synthesis by about 20–25% (27). Immunoprecipitation of [35S]methionine-labeled cell protein with lamininβ1 antibody showed significant increment in laminin synthesis under the three conditions. These data showed that although high glucose, high insulin, and both together stimulated global protein synthesis in MCT cells, increments in laminin β1 synthesis were in addition individually stimulated (27).
FIGURE 1.
High glucose (30 mm) and high insulin (1 nm) stimulate synthesis of extracellular matrix proteins in proximal tubular epithelial (MCT) cells. Equal amounts of protein from cell lysates extracted after treatment with or without high glucose and high insulin for the time shown were separated on SDS-PAGE. Following transfer to nitrocellulose membrane, the membranes were probed with specific antibodies for expression of matrix proteins laminin β1(A and B) and fibronectin (C and D). Lower panels show immunoblotting for actin done to assess loading. Representative blots from four to five experiments are shown, and composite data are given in histograms. #, p < 0.05 and §, p < 0.01 versus control by ANOVA.
FIGURE 2.
High glucose and high insulin increase laminin β1 and fibronectin mRNA levels. Total RNA isolated from cells treated with or without high glucose and high insulin was reverse-transcribed to synthesize cDNA. 2μl of the cDNA subjected to quantitative real-time PCR using the SYBR Green method shows an increase in the transcript level of lamininβ1(A and B) and fibronectin (C and D) following incubation with high glucose or high insulin. GAPDH served as an internal control. The ratio of laminin β1 and fibronectin mRNA to GAPDH mRNA is shown. Histograms represent means ± S.E. from three independent experiments. Significant differences between control and cells treated with high glucose and high insulin are indicated by #, p < 0.05; §, p < 0.01; and *, p < 0.001 by ANOVA.
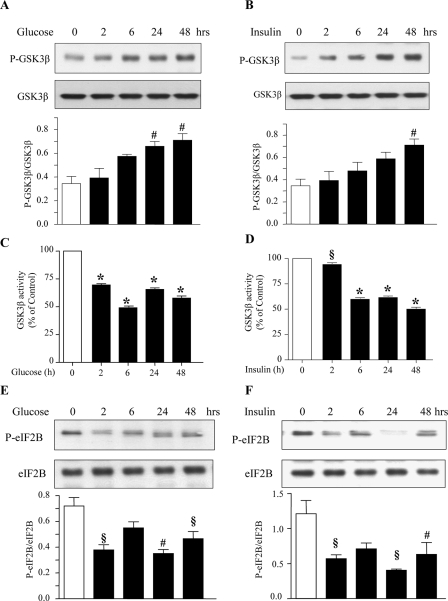
High Glucose and High Insulin Promote Phosphorylation and Inactivation of GSK3β and Dephosphorylation of eIF2Bε—In cells in the basal state, GSK3β is active and keeps eIF2Bε inactive. Both high glucose and high insulin induced phosphorylation of Ser-9 on GSK3β, which is required for its inactivation, starting at about 2 h and lasting up to 48 h (Fig. 3, A and B). Combined incubation with high glucose and high insulin also increased GSK3β phosphorylation following the same time course as that of high glucose alone or high insulin alone (supplemental Fig. S2). We directly studied the effect of high glucose and high insulin on GSK3β activity. In an immunokinase activity assay, treatment of MCT cells with high glucose and high insulin significantly reduced [32P]phosphate incorporation into the GSK3β substrate, demonstrating reduced activity of GSK3β (Fig. 3, C and D). These data show that the increase in Ser-9 phosphorylation of GSK3β correlates with reduction in its enzymatic activity. eIF2Bε mediates the antihypertrophic effects of GSK3β. Upon inactivation of GSK3β eIF2Bε is dephosphorylated on Ser-539 and is free to promote translation initiation. The binding of eIF2 to the activated initiator methionyl tRNA is promoted by dephosphorylated eIF2Bε (34, 35). High glucose and high insulin reduced eIF2Bε Ser-539 phosphorylation starting at 2 h and lasting for up to 48 h (Fig. 3, E and F). Thus, GSK3β inactivation and eIF2Bε dephosphorylation are temporally associated with high glucose- and high insulin-induced matrix protein synthesis.
FIGURE 3.
High glucose and high insulin stimulate phosphorylation and dephosphorylation of GSK3β and eIF2Bε, respectively. MCT cells were treated with or without high glucose or high insulin. Equal amounts of protein from cell lysates were separated by SDS-PAGE and immunoblotted with phosphospecific and total protein antibodies for GSK3β (A and B) and eIF2Bε (E and F). Representative blots from four experiments are shown. Histograms show composite densitometric data from four experiments. Statistical significance is shown as #, p < 0.05; §, p < 0.01; *, p < 0.001 by ANOVA. Immune complex assay for GSK3β activity was performed using cell lysates from control and high glucose- and high insulin-treated cells as described under “Materials and Methods” (C and D). Composite data from three experiments are shown in a histogram (#, p < 0.05; §, p < 0.01; and *, p < 0.001 by ANOVA).
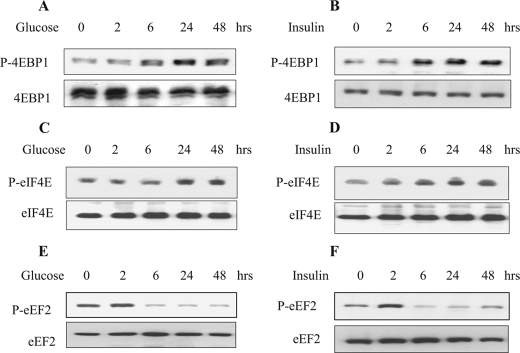
High Glucose and High Insulin Regulate Initiation and Elongation Phases of Translation—Because translation is the rate-limiting step in gene expression culminating in peptide synthesis, we examined key steps in initiation and elongation phases of translation in the context of GSK3β regulation of matrix protein synthesis. During the initiation phase of mRNA translation, binding of the 43S ribosomal pre-initiation complex to the mRNA is facilitated by eIF4E in association with eIF4G and eIF4A (15). In the resting cell, eIF4E is held in an inactive complex by its binding protein 4E-BP1. Upon stimulation, 4E-BP1 is phosphorylated on several threonine and serine residues, including Thr-37/46 (36). This results in dissolution of the complex, freeing eIF4E to bind with mRNA cap to promote translation initiation. High glucose and high insulin augmented phosphorylation of 4E-BP1 (Fig. 4, A and B) and eIF4E (Fig. 4, C and D).
FIGURE 4.
High glucose and high insulin induce activation of key events in initiation and elongation phases of mRNA translation. Cells were treated with or without high glucose and high insulin and immunoblotting was done with antibodies for 4E-BP1, eIF4E, and eEF2 phosphorylated at Thr-37/46, Ser-209, and Thr-56, respectively (A–F). The lower panels serve as loading controls. Representative blots from three experiments are shown.
During the elongation phase of translation, amino acids are sequentially added to the nascent peptide chain by the participation of aminoacyl tRNA (34, 37). Movement of the ribosome along the mRNA, resulting in translocation of aminoacyl tRNA from the A site to the P site on the ribosome, is regulated by eukaryotic elongation factor 2 (eEF2). Activation of eEF2 occurs following dephosphorylation at Thr-56 (38). High glucose and high insulin also induced dephosphorylation of Thr-56 on eEF2 (Fig. 4, E and F). Thus, high glucose or high insulin activate important steps in both initiation and elongation phases in association with inactivation of GSK3β and increased matrix protein synthesis in MCT cells.
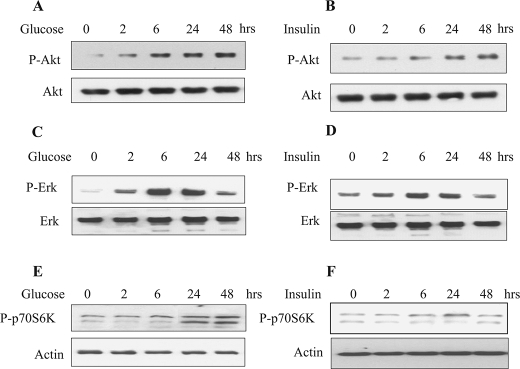
High Glucose and High Insulin Activate Akt, Erk and p70S6 Kinase—Several upstream kinases have been implicated in inactivation of GSK3β by phosphorylation at Ser-9 (39). These include Akt-PKB (40), Erk-1/-2 MAP kinase, and p70S6 kinase (41, 42). We immunoblotted cell lysates treated with phosphospecific antibodies for Akt, Erk, and p70S6 kinase phosphorylated at Ser-473, Thr-202/Tyr-204, and, Thr-389, respectively. High glucose and high insulin stimulated phosphorylation of Akt, Erk, and p70S6 kinase that started at 2 h and remained phosphorylated until 24–48 h. (Fig. 5, A–F).
FIGURE 5.
High glucose and high insulin stimulated phosphorylation of Akt, Erk, and p70S6 kinase. Equal amounts of cell lysates from quiescent MCT cells treated with or without high glucose or high insulin were resolved on SDS-PAGE and immunoblotted using phosphospecific antibodies for Akt (Ser-473), Erk (Thr-202/Tyr-204), and p70S6 kinase (Thr-389). The blots were stripped and re-probed with total Akt, Erk, and actin antibodies (bottom panels) to assess loading. Representative blots from four experiments are shown for each kinase.
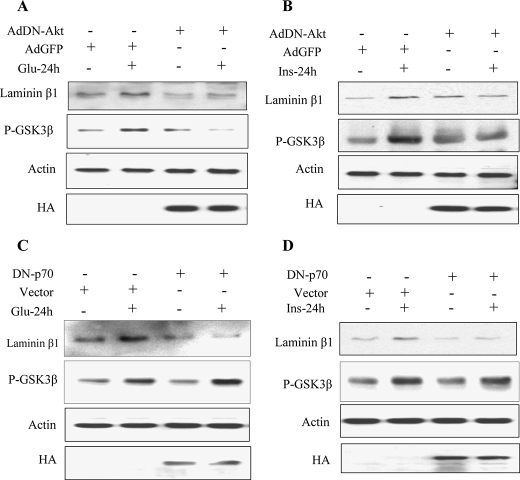
Akt but Not p70S6 Kinase Regulates GSK3β Phosphorylation Induced by High Glucose and High Insulin—Next, we examined whether phosphorylation of Akt and p70S6 kinase is required for high glucose- and high insulin-induced phosphorylation of GSK3β and laminin β1 synthesis. In cells expressing dominant-negative Akt, high glucose and high insulin failed to stimulate GSK3β phosphorylation and laminin β1 synthesis (Fig. 6, A and B). However, in cells expressing kinasedead p70S6 kinase, only laminin β1 synthesis was blocked but not Ser-9 phosphorylation of GSK3β (Fig. 6, C and D). Thus, stimulation of GSK3β phosphorylation by high glucose and high insulin is dependent on Akt but not p70S6 kinase activation in MCT cells, although both kinases are involved in the regulation of laminin β1 synthesis.
FIGURE 6.
Regulation of high glucose- and high insulin-induced laminin β1 synthesis and GSK3β phosphorylation by Akt and p70S6 kinase. MCT cells were infected with Ad-GFP as control or Ad-DN-Akt (A and B). Cells were transfected with empty vector or DN-p70S6K (C and D) prior to treatment with or without high glucose or high insulin. Equal amounts of lysates (30 μg) from the MCT cells were separated on SDS-PAGE. Following transfer to nitrocellulose membrane, the membranes were probed the antibody against laminin β1 and Ser-9-phosphorylated GSK3β. The membrane was stripped and reprobed with an antibody against actin to assess loading. Immunoblotting with anti-HA (hemagglutinin) antibody was done to show expression of transfectants. Representative blots from three independent experiments are shown.
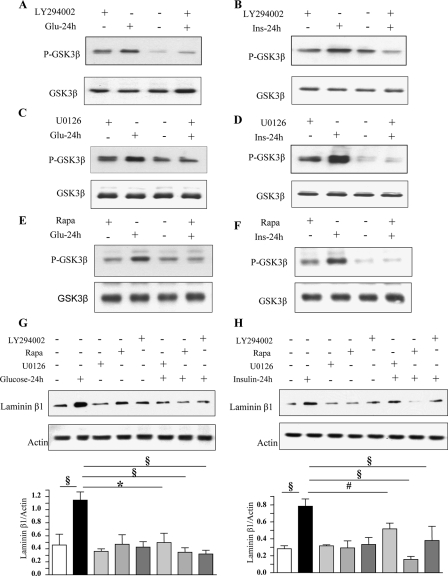
We examined the role of PI 3-kinase, Erk, and mTOR in GSK3β Ser-9 phosphorylation. Akt activation by high glucose and high insulin is PI 3-kinase-dependent (data not shown) (43) and Akt activation results in GSK3β inhibition by phosphorylation of Ser-9 (44). Preincubation of MCT cells with LY294002, a selective inhibitor of PI 3-kinase, U0126, a MEK inhibitor, and, rapamycin, a specific inhibitor of mTOR, blocked GSK3β phosphorylation (Fig. 7, A–F) and laminin β1 synthesis (Fig. 7, G and H) induced by high glucose and high insulin at 24 h. As rapamycin data suggested, mTOR regulates GSK3β, we studied their interaction. Immunoprecipitation with anti-mTOR antibody and immunoblotting with anti-GSK3β antibody suggested that the two proteins exist in a complex; the intensity of binding did not seem to change following exposure to high glucose or high insulin (supplemental Fig. S3). Because PI 3-kinase-Akt-mTOR belong to a linear pathway, it is not surprising that inhibitors of PI 3-kinase (LY294002) and mTOR (rapamycin) inhibited GSK3β phosphorylation. We explored if Erk activation was under the regulation of PI 3-kinase. LY294002, abrogated high glucose- and high insulin-induced phosphorylation of Erk1/2 MAP kinase (supplemental Fig. S4), suggesting the latter was under the control of PI 3-kinase. These data confirm our previous report that Erk is downstream of PI 3-kinase in insulin-treated MCT cells (45). Because PI 3-kinase regulates both mTOR and Erk activation, we see complete inhibition of Ser-9 phosphorylation of GSK3β with each of the three inhibitors.
FIGURE 7.
High glucose- and high insulin-induced GSK3β phosphorylation and laminin β1 synthesis are dependent upon activation of PI 3-kinase, Erk, and mTOR. Equal amounts of lysate protein from cells incubated with high glucose or high insulin with or without preincubation with LY294002 (25 μm), rapamycin (22 nm), or U0126 (5 μm) were immunoblotted with antibody against Ser-9 phospho-GSK3β (A–F) and laminin β1 (G and H). Bottom panels show immunoblotting for total GSK3β or actin to assess loading. Representative blots from three experiments are shown. Statistical significance is shown as #, p < 0.05; §, p < 0.01; *, p < 0.001 by ANOVA.
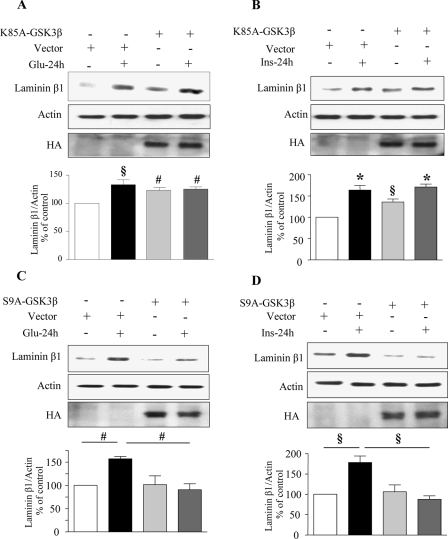
Expression of Kinase Inactive (K85A) and Constitutively Active (S9A) Constructs of GSK3β Alter High Glucose- and High Insulin-induced Changes in Laminin β1 Synthesis—Next, we investigated the requirement of GSK3β inactivation for high glucose- and high insulin-induced synthesis of laminin β1 in MCT cells. Cells were transiently transfected with either a kinase inactive (K85A) or a constitutively active (S9A) construct of GSK3β. Expression of kinase-dead K85A-GSK3β resulted in increased laminin β1 synthesis in control cells (Fig. 8, A and B). However, inactive GSK3β did not add to the incremental effect of high glucose and high insulin on laminin β1 synthesis. Expression of constitutively active GSK3β (S9A), which cannot be phosphorylated and therefore cannot be inhibited by stimuli was found to be effective in abolishing both high glucose- and high insulin-induced laminin β1 synthesis in MCT cells (Fig. 8, C and D); however, S9A mutant did not affect constitutive laminin β1 synthesis. Expression of mutant constructs was confirmed by immunoblotting the cell lysates using an anti-HA antibody. Because eIF2Bε is a direct substrate of GSK3β, we examined its phosphorylation status in cells expressing the mutants. Overexpression of kinase-inactive K85A GSK3β construct caused dephosphorylation of eIF2Bε in control cells (supplemental Fig. S5). Conversely overexpression of constitutively active S9A construct of GSK3β caused phosphorylation of eIF2Bε in control cells (supplemental Fig. S5). We described the data above (Fig. 6, C and D) that showed p70S6 kinase was not an upstream regulator of GSK3β phosphorylation. We further explored whether GSK3β could regulate p70S6 kinase phosphorylation when exposed to high glucose and high insulin in cells expressing the K85A and S9A mutants. With either construct, high glucose and high insulin were able to stimulate Thr-389 phosphorylation of p70S6 kinase, similar to cells expressing control plasmid vector (supplemental Fig. S6). These data indicate that Thr-389 phosphorylation of p70S6 kinase is not under control of GSK3β.
FIGURE 8.
Stimulation of laminin β1 synthesis by high glucose and high insulin requires inactivation of GSK3β. MCT cells were transfected with control plasmid or a plasmid carrying the kinase-dead (K85A) construct of GSK3β (A and B) or constitutively active (S9A) construct of GSK3β (C and D). Equal amounts of lysate protein from cells incubated with or without high glucose or high insulin were immunoblotted with antibody against laminin β1. Loading was assessed by immunoblotting with antibody against actin (middle panel). Immunoblotting with anti-HA antibody was done to demonstrate the expression of GSK3β constructs (bottom panels). Representative blots from three experiments are shown. Composite data from three experiments are shown in histograms. Statistical significance is shown as #, p < 0.05; §, p < 0.01; *, p < 0.001 by ANOVA).
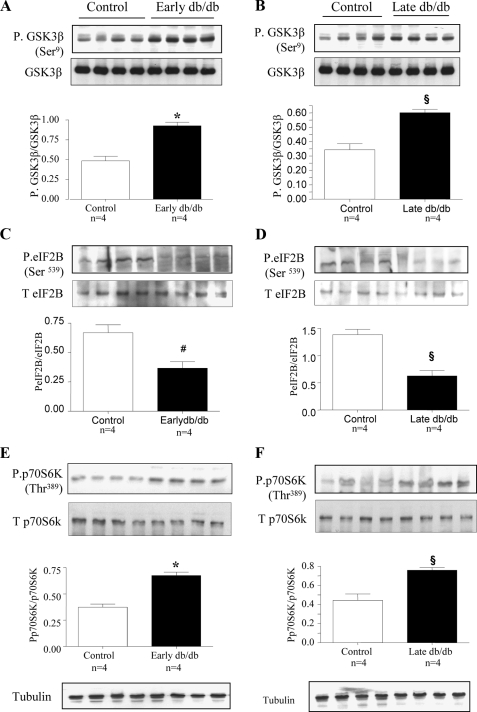
Diabetes-induced Changes in GSK3β in Type 2 Diabetes—Mice with spontaneous onset of type 2 diabetes were studied at 2 weeks (Early diabetes) and 2 months (Late diabetes) of hyperglycemia when they manifest renal hypertrophy (23), and, increase in laminin content, respectively (33). The renal cortex from diabetic mice showed an increase in phosphorylation of GSK3β at Ser-9 (Fig. 9, A and B) and dephosphorylation of Ser-539 on eIF2Bε (Fig. 9, C and D) both at early and late phases of diabetes compared with renal cortex from control db/m mice; contents of GSK3β and eIF2Bε were unaffected. We also observed increased Thr-389 phosphorylation of p70S6 kinase in the renal cortex of mice with diabetes when compared with their lean littermates at both time points (Fig. 9, E and F) without significant changes in the content of the kinase. Inactivation of GSK3β by phosphorylation and activation of eIF2Bε by dephosphorylation correlated with the increment of laminin β1 chain in diabetic renal cortex (33).
FIGURE 9.
Phosphorylation of GSK3β and p70S6K is increased and eIF2Bε phosphorylation is decreased in the renal cortex of mice with type 2 diabetes. C57BL6/KsJ db/db mice were sacrificed at 2 weeks (early db/db) and 2 months (late db/db) of diabetes. Equal amounts of renal cortical homogenates from control and diabetic mice were separated by SDS-PAGE and immunoblotted with antibodies against phospho-GSK3β (A and B), phospho-eIF2Bε (C and D) and phospho-p70S6 kinase (E and F). Immunoblotting with antibodies against GSK3β, eIF2Bε, p70S6 kinase, and tubulin was done to show equal loading. Composite mean ± S.E. data from four mice in each group are shown in a histogram. Statistical significance between the two groups is shown as #, p < 0.05; §, p < 0.01; *, p < 0.001, by Student's t test, db/db versus control.
DISCUSSION
Our study showed that high glucose and high insulin increased mRNA and protein expression of laminin β1 and fibronectin in the renal proximal tubular epithelial cells and that it required inactivation of GSK3β. We have earlier reported that high glucose and high insulin selectively induce synthesis of laminin β1 chain matrix protein (but not type IV collagen or fibronectin) within 5 min without any change in its mRNA level. The regulatory mechanism involves mRNA translation and not transcription (27). Our present data indicate that full expression of the laminin and fibronectin under high glucose and high insulin stimulation requires enhanced mRNA translation as well as transcription.
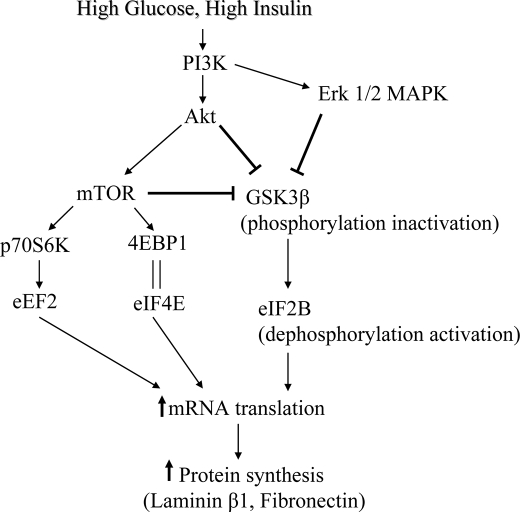
In the quiescent cell, GSK3β is unphosphorylated and active thereby inhibiting its molecular targets that promote cell growth. After stimulation with growth factors or induction of canonical Wnt pathway, GSK3β is inactivated by Ser-9 phosphorylation, releasing its pro-growth substrates from tonic inhibition (46). Growth factors regulate GSK3β via kinases that directly phosphorylate the kinase to control its activity. Akt, Erk, and possibly p70S6 kinase have been suggested as upstream controllers of GSK3β (8, 42). We observed that high glucose- and high insulin-induced GSK3β inactivation by phosphorylation at Ser-9 was dependent on activation of Akt. Abrogation of high glucose and high insulin-induced changes in GSK3β phosphorylation by LY294002, suggested that PI 3-kinase was also involved in our system. As mTOR inhibition with rapamycin abolished high glucose- and high insulin-induced Ser-9 phosphorylation of GSK3β, we investigated if it involved p70S6 kinase. Expression of dominant negative p70S6 kinase did not affect high glucose and high insulin regulation of Ser-9 phosphorylation of GSK3β. However, mTOR and GSK3β appear to be constituents of a complex suggesting the possibility that some other substrate of mTOR or mTOR itself may play a part. Erk inhibitor, U0126, also inhibited high glucose and high insulin stimulation of GSK3β phosphorylation suggesting it was another upstream regulator of GSK3β. Abolition of high glucose- and high insulin-induced Erk phosphorylation by LY294002 suggests that PI 3-kinase is upstream of Erk, confirming previous report in insulin-treated MCT cells (45). Thus, PI 3-kinase appears to regulate both Akt-mTOR and Erk pathways in MCT cells treated with high glucose and high insulin (Fig. 10). In MCT cells employed in this study, high insulin stimulation of Erk appears to be dependent on PI 3-kinase (45). The precise interactions among these kinase pathways in the context of high glucose and high insulin regulation of GSK3β activity and protein synthesis need to be investigated further.
FIGURE 10.
Schematic diagram showing the pathway involved in high glucose- and high insulin-induced extracellular matrix protein synthesis mediated by GSK3β and eIF2Bε.
Cell growth regulated by GSK3β could involve either cell proliferation or cell hypertrophy. Hypertrophy requires activation of signaling pathways that transduce extracellular signals to their intracellular targets causing modification of the translational apparatus in response to these signals (47). Molecular mechanisms that regulate GSK3β in the context of protein synthesis are not well understood. Because mRNA translation is the rate-limiting step in gene expression culminating in protein synthesis (34), we examined the role of GSK3β in the initiation and elongation phases of translation. Upon stimulation by high glucose and high insulin important events in both phases were triggered as observed by the activation of mTOR-4EBP1/Erk-eIF4E pathway and mTOR-p70S6K-eEF2 pathway (Figs. 4 and 5). One of the critical steps in the initiation of mRNA translation is the binding of eIF2 to the activated initiator methionyl tRNA (met-tRNA) and subsequent formation of a ternary complex that binds to the 40S ribosomal subunit. This process requires activities of eIF2Bε, a guanine nucleotide exchange factor, in order to stimulate the GDP/GTP exchange reaction of eIF2. GSK3β phosphorylates eIF2Bε at Ser-539 (Ser-535 in the rat sequence) and inactivates it (48). Because stimulation of matrix protein synthesis by high glucose and high insulin was associated with inactivating Ser-9 phosphorylation of GSK3β and reduction in Ser-539 phosphorylation of eIF2Bε, the latter appears to be the mediator of protein synthesis regulation by GSK3β.
There are other reported instances of GSK3β regulating cell hypertrophy. A recent report suggests that inhibition of the GSK3β/eIF2Bε translational control pathway contributes to airway smooth muscle hypertrophy in vitro and in vivo (49). GSK3β has been shown as an important negative regulator of cardiac hypertrophy (40, 50, 51). Overexpression of a constitutively active mutant GSK3β S9A in neonatal rat cardiac myocytes markedly reduced hypertrophy induced by Gαq-coupled receptor stimulation (40). When Hardt et al. (52) expressed eIF2Bε mutated at its GSK3β phosphorylation site preventing its inactivation, spontaneous hypertrophy developed, and the anti-hypertrophic effects of GSK3β overexpression were abolished. Various reports have shown that there is a marked increase in GSK3β activity in heart and skeletal muscle of type 2 diabetes (53–55). These data are consistent with elevated GSK3 activity in muscle in type 2 diabetes (56, 57). These changes could be a cause or consequence of development of insulin resistance and type 2 diabetes. In contrast to the insulin-resistant non-renal tissues such as the liver, kidney remains sensitive to insulin in db/db mice model of type 2 diabetes (58). However, the activity of GSK3β in the kidneys in type 2 diabetes has not been examined. We observed that in the db/db mice, renal cortex homogenates exhibit increased Ser-9 phosphorylation of GSK3β concomitant with decreased phosphorylation of eIF2Bε during early stage of type 2 diabetes. As GSK3β is active in the basal state of the tissue and normally functions as repressor of protein synthesis and transcription, the phosphorylation and inactivation of GSK3β will lead to increased protein synthesis. At this stage, both renal hypertrophy and increase in laminin β1 content are evident in the renal cortex of db/db mice (21). The increment in laminin β1 protein is associated with unchanged mRNA content suggesting its regulation by translation (ibid). Thus, GSK3β could have a role in both renal hypertrophy and accumulation of matrix protein laminin β1 in the diabetic kidney. One could anticipate that renal hypertrophy and laminin β1 accumulation induced by hyperglycemia and hyperinsulinemia would be rescued by activation of GSK3β or by overexpression of constitutively active form of GSK3β in the kidney in the db/db mouse.
Similar to GSK3β, AMP-activated protein kinase (AMPK) is also a physiological inhibitor of protein synthesis; stimulation of AMPK activity ameliorated renal hypertrophy in rodents with type 1 diabetes (17). Overexpression of S9A mutant of GSK3β, which cannot be inactivated, inhibited laminin β1 synthesis induced by high glucose and high insulin suggesting that this could be a useful strategy to reduce matrix accumulation in diabetic kidney disease. However, because GSK3β inactivation is required for glycogen synthesis in response to high glucose and insulin secretion in insulin responsive tissues, modulation of GSK3β activity will have to be selective in the kidney tissue in diabetes.
Supplementary Material
This work was supported, in whole or in part, by National Institutes of Health Grants DK061597 and DK077295 (to B. S. K.) and DK050190 (to G. G. C.). These studies were also supported by Juvenile Diabetes Research Foundation Grants 3-2007-245 (to M. M. M. and B. S. K.) and 1-2008-185 (to G. G. C.), American Diabetes Association Grant 7-05-RA-60 (to B. S. K.), the Veterans Administration Research Service (to B. S. K. and G. G. C.), and American Heart Association Grant SDG 0630283N (to D. F.). The costs of publication of this article were defrayed in part by the payment of page charges. This article must therefore be hereby marked “advertisement” in accordance with 18 U.S.C. Section 1734 solely to indicate this fact.
The on-line version of this article (available at http://www.jbc.org) contains supplemental Figs. S1–S6.
Footnotes
The abbreviations used are: GSK, glycogen synthase kinase; MOPS, 4-morpholinepropanesulfonic acid; ANOVA, analysis of variance; PI, phosphatidylinositol; Erk, extracellular signal-regulated kinase; MAP, mitogen-activated protein; HA, hemagglutinin; eIF, eukaryotic translation initiation factor.
References
- 1.Embi, N., Rylatt, D. B., and Cohen, P. (1980) Eur. J. Biochem. 107 519-527 [PubMed] [Google Scholar]
- 2.Hanger, D. P., Hughes, K., Woodgett, J. R., Brion, J. P., and Anderton, B. H. (1992) Neurosci. Lett. 147 58-62 [DOI] [PubMed] [Google Scholar]
- 3.Cui, H., Meng, Y., and Bulleit, R. F. (1998) Brain Res. Dev. Brain Res. 111 177-188 [DOI] [PubMed] [Google Scholar]
- 4.Diehl, J. A., Cheng, M., Roussel, M. F., and Sherr, C. J. (1998) Genes Dev. 12 3499-3511 [DOI] [PMC free article] [PubMed] [Google Scholar]
- 5.Beurel, E., Kornprobst, M., Blivet-Van Eggelpoel, M. J., Ruiz-Ruiz, C., Cadoret, A., Capeau, J., and Desbois-Mouthon, C. (2004) Exp. Cell Res. 300 354-364 [DOI] [PubMed] [Google Scholar]
- 6.Linseman, D. A., Butts, B. D., Precht, T. A., Phelps, R. A., Le, S. S., Laessig, T. A., Bouchard, R. J., Florez-McClure, M. L., and Heidenreich, K. A. (2004) J. Neurosci. 24 9993-10002 [DOI] [PMC free article] [PubMed] [Google Scholar]
- 7.Cordes, N., and van Beuningen, D. (2003) Br. J. Cancer 88 1470-1479 [DOI] [PMC free article] [PubMed] [Google Scholar]
- 8.Cross, D. A., Alessi, D. R., Cohen, P., Andjelkovich, M., and Hemmings, B. A. (1995) Nature 378 785-789 [DOI] [PubMed] [Google Scholar]
- 9.Eldar-Finkelman, H., Seger, R., Vandenheede, J. R., and Krebs, E. G. (1995) J. Biol. Chem. 270 987-990 [DOI] [PubMed] [Google Scholar]
- 10.De Servi, B., Hermani, A., Medunjanin, S., and Mayer, D. (2005) Oncogene 24 4946-4955 [DOI] [PubMed] [Google Scholar]
- 11.Hagen, T., Cross, D. A., Culbert, A. A., West, A., Frame, S., Morrice, N., and Reith, A. D. (2006) J. Biol. Chem. 281 35021-35029 [DOI] [PubMed] [Google Scholar]
- 12.Ossipova, O., Bardeesy, N., DePinho, R. A., and Green, J. B. (2003) Nat. Cell Biol. 5 889-894 [DOI] [PubMed] [Google Scholar]
- 13.Altomare, D. A., Wang, H. Q., Skele, K. L., De Rienzo, A., Klein-Szanto, A. J., Godwin, A. K., and Testa, J. R. (2004) Oncogene 23 5853-5857 [DOI] [PubMed] [Google Scholar]
- 14.Trivedi, C. M., Luo, Y., Yin, Z., Zhang, M., Zhu, W., Wang, T., Floss, T., Goettlicher, M., Noppinger, P. R., Wurst, W., Ferrari, V. A., Abrams, C. S., Gruber, P. J., and Epstein, J. A. (2007) Nat. Med. 13 324-331 [DOI] [PubMed] [Google Scholar]
- 15.Kasinath, B. S., Lee, M. J., Feliers, D., and Sonenberg, N. (2003) in Contemporary Diabetes. The Diabetic Kidney (Cortes, P. M. C., ed), pp. 97-116, Humana Press, NJ
- 16.Chen, J., Chen, J. K., Neilson, E. G., and Harris, R. C. (2006) J. Am. Soc. Nephrol. 17 1615-1623 [DOI] [PubMed] [Google Scholar]
- 17.Lee, M. J., Feliers, D., Mariappan, M. M., Sataranatarajan, K., Mahimainathan, L., Musi, N., Foretz, M., Viollet, B., Weinberg, J. M., Choudhury, G. G., and Kasinath, B. S. (2007) Am. J. Physiol. Renal Physiol. 292 F617-F627 [DOI] [PubMed] [Google Scholar]
- 18.Lloberas, N., Cruzado, J. M., Franquesa, M., Herrero-Fresneda, I., Torras, J., Alperovich, G., Rama, I., Vidal, A., and Grinyo, J. M. (2006) J. Am. Soc. Nephrol. 17 1395-1404 [DOI] [PubMed] [Google Scholar]
- 19.Mariappan, M. M., Senthil, D., Natarajan, K. S., Choudhury, G. G., and Kasinath, B. S. (2005) J. Biol. Chem. 280 28402-28411 [DOI] [PubMed] [Google Scholar]
- 20.Sakaguchi, M., Isono, M., Isshiki, K., Sugimoto, T., Koya, D., and Kashiwagi, A. (2006) Biochem. Biophys. Res. Commun. 340 296-301 [DOI] [PubMed] [Google Scholar]
- 21.Sataranatarajan, K., Mariappan, M. M., Lee, M. J., Feliers, D., Choudhury, G. G., Barnes, J. L., and Kasinath, B. S. (2007) Am. J. Pathol. 171 1733-1742 [DOI] [PMC free article] [PubMed] [Google Scholar]
- 22.Senthil, D., Choudhury, G. G., Abboud, H. E., Sonenberg, N., and Kasinath, B. S. (2002) Am. J. Physiol. Renal Physiol. 283 F1226-1236 [DOI] [PubMed] [Google Scholar]
- 23.Senthil, D., Choudhury, G. G., McLaurin, C., and Kasinath, B. S. (2003) Kidney Int. 64 468-479 [DOI] [PubMed] [Google Scholar]
- 24.Senthil, D., Faulkner, J. L., Choudhury, G. G., Abboud, H. E., and Kasinath, B. S. (2001) Biochem. J. 360 87-95 [DOI] [PMC free article] [PubMed] [Google Scholar]
- 25.Senthil, D., Ghosh Choudhury, G., Bhandari, B. K., and Kasinath, B. S. (2002) Biochem. J. 368 49-56 [DOI] [PMC free article] [PubMed] [Google Scholar]
- 26.Haverty, T. P., Kelly, C. J., Hines, W. H., Amenta, P. S., Watanabe, M., Harper, R. A., Kefalides, N. A., and Neilson, E. G. (1988) J. Cell Biol. 107 1359-1368 [DOI] [PMC free article] [PubMed] [Google Scholar]
- 27.Mariappan, M. M., Feliers, D., Mummidi, S., Choudhury, G. G., and Kasinath, B. S. (2007) Diabetes 56 476-485 [DOI] [PubMed] [Google Scholar]
- 28.van der Velden, J. L., Langen, R. C., Kelders, M. C., Wouters, E. F., Janssen-Heininger, Y. M., and Schols, A. M. (2006) Am. J. Physiol. Cell Physiol. 290 C453-C462 [DOI] [PubMed] [Google Scholar]
- 29.Wang, X., and Seed, B. (2003) Nucleic Acids Res. 31 e154. [DOI] [PMC free article] [PubMed] [Google Scholar]
- 30.Stambolic, V., and Woodgett, J. R. (1994) Biochem. J. 303 701-704 [DOI] [PMC free article] [PubMed] [Google Scholar]
- 31.Schalm, S. S., and Blenis, J. (2002) Curr. Biol. 12 632-639 [DOI] [PubMed] [Google Scholar]
- 32.Choudhury, G. G. (2001) J. Biol. Chem. 276 35636-35643 [DOI] [PubMed] [Google Scholar]
- 33.Ha, T. S., Barnes, J. L., Stewart, J. L., Ko, C. W., Miner, J. H., Abrahamson, D. R., Sanes, J. R., and Kasinath, B. S. (1999) J. Am. Soc. Nephrol. 10 1931-1939 [DOI] [PubMed] [Google Scholar]
- 34.Kasinath, B. S., Mariappan, M. M., Sataranatarajan, K., Lee, M. J., and Feliers, D. (2006) J. Am. Soc. Nephrol. 17 3281-3292 [DOI] [PubMed] [Google Scholar]
- 35.Proud, C. G. (2007) Biochem. J. 403 217-234 [DOI] [PubMed] [Google Scholar]
- 36.Gingras, A. C., Gygi, S. P., Raught, B., Polakiewicz, R. D., Abraham, R. T., Hoekstra, M. F., Aebersold, R., and Sonenberg, N. (1999) Genes Dev. 13 1422-1437 [DOI] [PMC free article] [PubMed] [Google Scholar]
- 37.Thornton, S., Anand, N., Purcell, D., and Lee, J. (2003) J. Mol. Med. 81 536-548 [DOI] [PubMed] [Google Scholar]
- 38.Redpath, N. T., Price, N. T., Severinov, K. V., and Proud, C. G. (1993) Eur. J. Biochem. 213 689-699 [DOI] [PubMed] [Google Scholar]
- 39.Cohen, P., and Frame, S. (2001) Nat. Rev. Mol. Cell. Biol. 2 769-776 [DOI] [PubMed] [Google Scholar]
- 40.Haq, S., Choukroun, G., Kang, Z. B., Ranu, H., Matsui, T., Rosenzweig, A., Molkentin, J. D., Alessandrini, A., Woodgett, J., Hajjar, R., Michael, A., and Force, T. (2000) J. Cell Biol. 151 117-130 [DOI] [PMC free article] [PubMed] [Google Scholar]
- 41.Cross, D. A., Alessi, D. R., Vandenheede, J. R., McDowell, H. E., Hundal, H. S., and Cohen, P. (1994) Biochem. J. 303 21-26 [DOI] [PMC free article] [PubMed] [Google Scholar]
- 42.Zhang, H. H., Lipovsky, A. I., Dibble, C. C., Sahin, M., and Manning, B. D. (2006) Mol. Cell 24 185-197 [DOI] [PMC free article] [PubMed] [Google Scholar]
- 43.King, W. G., Mattaliano, M. D., Chan, T. O., Tsichlis, P. N., and Brugge, J. S. (1997) Mol. Cell. Biol. 17 4406-4418 [DOI] [PMC free article] [PubMed] [Google Scholar]
- 44.Jope, R. S., and Johnson, G. V. (2004) Trends Biochem. Sci. 29 95-102 [DOI] [PubMed] [Google Scholar]
- 45.Bhandari, B. K., Feliers, D., Duraisamy, S., Stewart, J. L., Gingras, A. C., Abboud, H. E., Choudhury, G. G., Sonenberg, N., and Kasinath, B. S. (2001) Kidney Int. 59 866-875 [DOI] [PubMed] [Google Scholar]
- 46.Kerkela, R., Woulfe, K., and Force, T. (2007) Trends Cardiovasc. Med. 17 91-96 [DOI] [PubMed] [Google Scholar]
- 47.Rhoads, R. E. (1999) J. Biol. Chem. 274 30337-30340 [DOI] [PubMed] [Google Scholar]
- 48.Welsh, G. I., Miller, C. M., Loughlin, A. J., Price, N. T., and Proud, C. G. (1998) FEBS Lett. 421 125-130 [DOI] [PubMed] [Google Scholar]
- 49.Deng, H., Dokshin, G. A., Lei, J., Goldsmith, A. M., Bitar, K. N., Fingar, D. C., Hershenson, M. B., and Bentley, J. K. (2008) J. Biol. Chem. [DOI] [PMC free article] [PubMed]
- 50.Antos, C. L., McKinsey, T. A., Frey, N., Kutschke, W., McAnally, J., Shelton, J. M., Richardson, J. A., Hill, J. A., and Olson, E. N. (2002) Proc. Natl. Acad. Sci. U. S. A. 99 907-912 [DOI] [PMC free article] [PubMed] [Google Scholar]
- 51.Dorn, G. W., 2nd, and Force, T. (2005) J. Clin. Investig. 115 527-537 [DOI] [PMC free article] [PubMed] [Google Scholar]
- 52.Hardt, S. E., and Sadoshima, J. (2002) Circ. Res. 90 1055-1063 [DOI] [PubMed] [Google Scholar]
- 53.Damsbo, P., Vaag, A., Hother-Nielsen, O., and Beck-Nielsen, H. (1991) Diabetologia 34 239-245 [DOI] [PubMed] [Google Scholar]
- 54.Laughlin, M. R., Petit, W. A., Jr., Shulman, R. G., and Barrett, E. J. (1990) Am. J. Physiol. 258 E184-E190 [DOI] [PubMed] [Google Scholar]
- 55.Nikoulina, S. E., Ciaraldi, T. P., Abrams-Carter, L., Mudaliar, S., Park, K. S., and Henry, R. R. (1997) Diabetes 46 1017-1024 [DOI] [PubMed] [Google Scholar]
- 56.Eldar-Finkelman, H., Schreyer, S. A., Shinohara, M. M., LeBoeuf, R. C., and Krebs, E. G. (1999) Diabetes 48 1662-1666 [DOI] [PubMed] [Google Scholar]
- 57.Nikoulina, S. E., Ciaraldi, T. P., Mudaliar, S., Mohideen, P., Carter, L., and Henry, R. R. (2000) Diabetes 49 263-271 [DOI] [PubMed] [Google Scholar]
- 58.Feliers, D., Duraisamy, S., Faulkner, J. L., Duch, J., Lee, A. V., Abboud, H. E., Choudhury, G. G., and Kasinath, B. S. (2001) Kidney Int. 60 495-504 [DOI] [PubMed] [Google Scholar]
Associated Data
This section collects any data citations, data availability statements, or supplementary materials included in this article.


