Abstract
The optical properties of leaves from five species, Norway maple (Acer platanoides L.), cotoneaster (Cotoneaster alaunica Golite), hazel (Corylus avellana L.), Siberian dogwood (Cornus alba L.), and Virginia creeper (Parthenocissus quinquefolia (L.) Planch.), differing in pigment composition and at different stages of ontogenesis, were studied. Anthocyanin absorption maxima in vivo, as estimated with spectrophotometry of intact anthocyanic versus acyanic leaves and microspectrophotometry of vacuoles in the leaf cross-sections, were found between 537 nm and 542 nm, showing a red shift of 5–20 nm compared with the corresponding maxima in acidic water–methanol extracts. In non-senescent leaves, strong anthocyanin absorption was found between 500 nm and 600 nm (with a 70–80 nm apparent bandwidth). By and large, absorption by anthocyanin in leaves followed a modified form of the Lambert–Beer law, showing a linear trend up to a content of nearly 50 nmol cm−2, and permitting thereby a non-invasive determination of anthocyanin content. The apparent specific absorption coefficients of anthocyanins at 550 nm showed no substantial dependence on the species. Anthocyanin contribution to total light absorption at 550 nm was followed in maple leaves in the course of autumn senescence. Photoprotection by vacuolar anthocyanins is discussed with special regard to their distribution within a leaf; radiation screening by anthocyanins predominantly localized in the epidermal cells in A. platanoides and C. avellana leaves was also evaluated.
Keywords: Absorption, anthocyanins, carotenoids, chlorophyll, leaves, light screening, photoprotection
Introduction
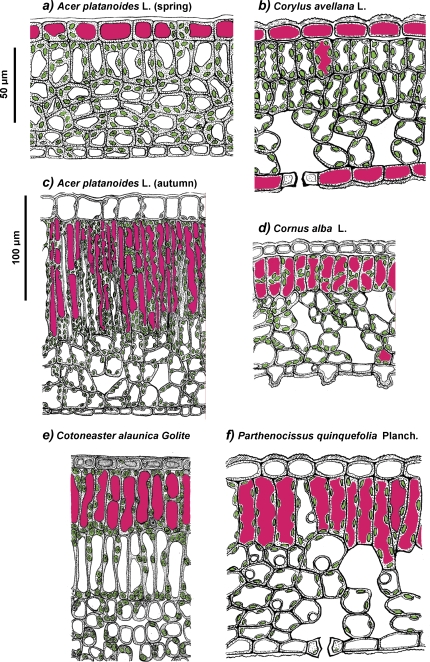
In addition to other roles (Harborne, 1976; Chalker-Scott, 1999; Close and Beadle, 2003), anthocyanins (AnC), the red pigments of plants, prevent photoinhibition and photodamage through the absorption of excessive solar radiation that would otherwise be absorbed by chloroplast pigments (for a review see Chalker-Scott, 1999; Field et al., 2001; Hoch et al., 2001; Steyn et al., 2002; Close and Beadle, 2003; Hughes et al., 2005; Pfündel et al., 2006; Hughes and Smith, 2007, Merzlyak et al., 2008; Solovchenko and Merzlyak, 2008). For reasons that are still poorly understood, higher plants vary considerably in their ability to synthesize AnC. The characteristic red anthocyanic pigmentation is abundant in juvenile and senescing leaves; its expression is intensified by elevated UV, high PAR irradiance, extreme temperatures, drought, nutrient deficiency, and other stress factors (Chalker-Scott, 1999; Field et al., 2001; Hoch et al., 2001, 2003;; Steyn et al., 2002; Close and Beadle; 2003; Hughes and Smith, 2007). The distribution of AnC within leaf tissues differs considerably among the species; as a rule, they localize in cell vacuoles, in or just below the adaxial epidermis, but occasionally the AnC pigments involved in photoprotection also accumulate in cell vacuoles of the abaxial epidermis, palisade and spongy mesophyll (Chalker-Scott, 1999; Pietrini et al., 2002; Steyn et al., 2002; Hughes et al., 2005; Hughes and Smith, 2007) (see also Fig. 1).
Fig. 1.
Schematic representation of the anatomy of spring (a, b) and autumn (c–f) leaves of the species studied. The chloroplasts and anthocyanin-containing vacuoles are shown in green and magenta, respectively.
Plant tissues are intricate, inhomogeneous optical systems, whose spectral properties depend on the anatomical features and pigment compositions of various intracellular compartments (Osborne and Raven, 1986; Richter and Fukshansky, 1996; Ustin et al., 2001; Pfündel et al., 2006). The understanding and quantitative description of the photoprotective function of AnC, essential for ecophysiological studies, requires a knowledge of the localization and spectroscopic properties in vivo of all the pigment pools (Gould et al., 2002; Merzlyak et al., 2008).
The fraction of incident light, I0(λ), absorbed by a leaf, denoted by A and called absorptance, can be calculated by measuring leaf hemispherical reflectance R(λ) and transmittance T(λ); these quantities are related as follows
| (1) |
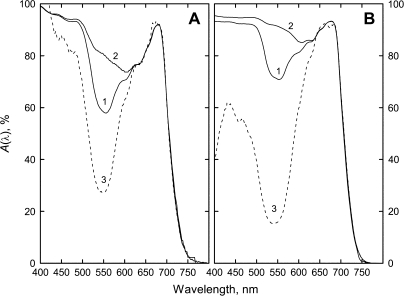
Absorptance plots of leaves with different AnC content, like those presented in Fig. 2 (curves 1 and 2) for maple and hazel, have been documented in the literature for various plant species (Pietrini and Massacci, 1998; Field et al., 2001; Gitelson et al., 2001; Pietrini et al., 2002; Hughes et al., 2005; Hughes and Smith, 2007). A remarkable feature of higher plant leaves is that only chlorophyll (Chl) pigments contribute to light absorption in the red region of the visible spectrum; absorption at shorter wavelengths, particularly in the green to blue region, can be attributed to other principal leaf pigments: carotenoids (Car) and flavonoids (including AnC) (Gitelson et al., 2001; Cerovic et al., 2002; Merzlyak et al., 2003, 2005, 2008; Solovchenko and Merzlyak, 2008). A comparison of the absorptance plots (against wavelength) of anthocyanic and acyanic leaf specimens with similar Chl contents, showed that AnC peaks are located around 550 nm in Acer platanoides, Cotoneaster alaunica, Cornus alba, and Pelargonium zonale (Gitelson et al., 2001). Furthermore, it was found that leaf absorptance near 550 nm (Gitelson et al., 2001) and that in the band 400–600 nm (Pietrini and Masacci, 1998) are linearly related with AnC content.
Fig. 2.
Absorptance plots of spring green (1) and red (2) A. platanoides (A) and C. avellana (B) leaves with pigment content shown in Table 1. Spectrum 3 is the model of chloroplast thylakoid pigment absorption in anthocyanic leaves as screened by anthocyanins (see Discussion).
It is convenient to consider, in addition to absorptance, a quantity that was found to be useful for discussing leaf optical properties (Merzlyak and Gitelson, 1995; Merzlyak et al., 2002, 2005); named here as attenuance and defined by the relation
it compensates for light losses due to reflection, and provides a check on the extent to which leaf optics may be said to follow the Lambert–Beer law of transmission spectroscopy. The relation between absorptance and attenuance can be expressed as A=(1–R)(1–10–D). In a simple case, assuming independence of light absorption by the pigments of chloroplast thylakoids (Chl and Car) in acyanic green (G) and, in addition, any other absorber (X) present in anthocyanic leaves, and a strictly linear dependence of D on the concentration, one can express attenuance of the red (R) leaves as: D(R)(λ)=D(G)(λ)+D(X)(λ) and the difference, ΔD(λ), between red and green leaves,
| (2) |
should correspond to AnC and/or other light-absorbing substances.
The aim of this work, which deals with five plant species, is to characterize AnC absorption in greater detail and to quantify it in situ. Young and senescing leaves possessing characteristic anatomy and differing widely in their pigment contents were examined. Our analysis of both leaf absorptance and attenuance was based on paired comparison of anthocyanic and acyanic specimens with similar Chl absorption in the red region of the spectrum (rather than similar Chl content) taking into account some uncertainties in routine leaf spectral measurements (Merzlyak et al., 2002, 2004). In addition, microspectrophometric measurements of vacuolar AnC absorption in leaf cross-sections have been carried out. Furthermore, the screening effect of AnC on light absorption by the chloroplast pigments has been quantified by using anatomical information about the pigment distribution and the results of spectral measurements.
Materials and methods
Plant material
Healthy and homogeneously coloured leaves of Norway maple (Acer platanoides L.), cotoneaster (Cotoneaster alaunica Golite), Siberian dogwood [Cornus alba L. (Swida alba (L.) Opiz.], hazel (Corylus avellana L.), and Virginia creeper (Parthenocissus quinquefolia (L.) Planch.) collected in a park at Moscow State University (1992–2007) were used in the study. In sunlit leaves of C. avellana, the bright anthocyanic pigmentation developed in May but was not observed during autumn senescence; in autumn, the shaded leaves were green-to-yellowish. In the other four species, AnC synthesis was expressed in sun-exposed plants and/or in sunlit leaves located at the outer part of the canopy. In A. platanoides, the red anthocyanic pigmentation appeared most often during seasons with the temperature lower than the annual average. In addition, leaf optical properties were investigated in young A. platanoides and C. alaunica leaves when anthocyanic pigmentation developed as a result of an abrupt decrease of temperature in the last ten days of May (1999). From the data sets, green and red leaves with similar Chl absorption were selected for pairwise comparisons.
Pigment analysis
Leaf pigments were analysed as described in Gitelson et al. (2001). In some experiments the procedure allowing elimination of Chl and Car in AnC analysis was applied (Solovchenko et al., 2001). The discs were homogenized in 10 ml of a chloroform–methanol (2:1, v/v) mixture and the homogenate was passed through a paper filter. Distilled water was then added to equal 0.2 of the extract volume, and the diluted filtrate was centrifuged in glass test tubes for 10 min at 3000 g to separate the chloroform and water–methanol phases. Chl and Car recovered in chloroform were separated and quantified using absorption coefficients in Wellburn (1994). The absorption spectra of the water–methanol fraction before and after the addition of a few drops of concentrated HCl were taken and their difference spectrum was calculated. With both procedures, an AnC absorption coefficient of 30 mM1 cm−1 at 530 nm (Strack and Wray, 1989) was used. The pigment content was expressed on a leaf area basis.
Microscopy
The light microphotographs of hand-made cross-sections of leaves were taken with an Axioscope (Carl Zeiss, Jena, Germany) microscope fitted with a MRC digital camera (Carl Zeiss, Germany). The absorption spectra of vacuoles were measured in the same leaf cross-sections with a customized Leitz MPV2 system (Ernst Leitz, Wetzlar GmbH, Germany) equipped with a 150 W high-pressure xenon lamp as a light source and a USB 2000 (grating no. 2) spectrometer (Ocean Optics, USA); for a detailed description of the experimental setup see Merzlyak et al. (2005). An area adjacent to the pigmented part under examination was taken as the reference, and attenuance was identified with the quantity log10[L0(λ)/L(λ)], where L0(λ) and L(λ) are the radiant powers transmitted through the sample and the reference, respectively.
Leaf spectral measurements
Adaxial leaf reflection and transmission spectra (against barium sulphate as a standard) were recorded by means of a 150–20 Hitachi (Japan) spectrophotometer equipped with a 150 mm diameter integrating sphere attachment. The data were sampled at 2 nm intervals in the 350–800 nm range. The transmission spectra were corrected for incomplete collection of light by the integrating sphere, as described in (Merzlyak et al., 2002), by assuming negligible absorption around 800 nm and setting R+T=1.
Results
Leaf anatomy
The leaf blades of the five species investigated in this work revealed similar anatomy (Fig. 1), that was typical of deciduous shrubs and trees (Esau, 1960; Fahn, 1990). The leaves of all species studied possessed adaxial and abaxial epidermis comprizing a single layer of cells almost devoid of plastids (with the exception of chloroplast-containing guard cells) and covered with a cuticle of 1.5–3.0 μm thickness. Beneath the adaxial epidermis, a well-differentiated palisade parenchyma composed of a single (A. platanoides, C. alba, and P. quinquefolia; Fig. 1A, C, D, F) or double (C. alaunica and C. avellana; Fig. 1B, E) cell layer was situated which accounted for 40–60% of the overall leaf blade thickness. The palisade parenchyma contained tightly packed elongated cells with a vast number of green-to-yellowish lens-shaped chloroplasts localized within a thin parietal layer of cytoplasm. The bulk of the cell volume was occupied by a large vacuole. The spongy parenchyma was built by three to five irregular layers of roundish cells interleaved by large, mainly blind pits. These cells contained, like those of the palisade parenchyma, a large number of chloroplasts in the parietal layer of the cytoplasm as well as large vacuoles (Fig. 1). No remarkable difference in leaf anatomy was found between the green and AnC-containing leaves of the same age.
The location of AnC-containing cells differed considerably between autumn and spring leaves. In the former case (Fig. 1C–F), AnC pigments were predominantly in the vacuoles of the cell layer of palisade parenchyma; by contrast, juvenile leaves of C. avellana (Fig. 1C) and low-temperature affected leaves of A. platanoides (Fig. 1A) were characterized by epidermal localization of AnC. In A. platanoides, the pigments were found in the vacuoles of the adaxial epidermis, whereas in C. avellana, they were localized both in the adaxial and abaxial epidermis.
Pigment content
The leaves examined here contained moderate amounts of Chl (less than 35 nmol cm−2); in the autumnal leaves the Chl content was lower (Table 1). The Car/Chl ratio, low in spring leaves, became larger in senescing leaves, and, except P. quinquefolia, it was higher in the red leaves (compared with the green leaves). The quantitative data indicate that some leaves graded as green contained noticeable amounts of AnC. As compared with spring leaves, AnC content in the red autumnal leaves was higher, reaching c. 100 nmol cm−2 in P. quinquefolia.
Table 1.
Pigment content (nmol cm−2) for green and red leaves for which absorption spectra are presented in Figs. 2, 4 and 5
| Species | Pigment content and carotenoid-to-chlorophyll molar ratio in green/red leaves |
|||
| Chlorophylls | Carotenoids | Carotenoids/Chlorophylls | Anthocyanins | |
| Spring leaves | ||||
| A. platanoides | 23.6/26.8 | 11.6/12.1 | 0.49/0.45 | 0.1/20.8 |
| C. alaunica | 29.7/23.1 | 11.0/7.6 | 0.37/0.33 | 0.8/20.0 |
| C. avellana | 34.2/30.7 | 12.6/10.7 | 0.37/0.35 | 5.6/30.3 |
| Autumn leaves | ||||
| A. platanoides | 6.9/10.9 | 6.3/14.1 | 0.91/1.29 | 3.9/47.7 |
| C. alaunica | 18.1/15.9 | 6.8/13.0 | 0.38/0.82 | 7.1/23.4 |
| C. alba | 15.7/14.4 | 8.1/9.0 | 0.52/0.63 | 1.2/37.2 |
| P. quinquefolia | 9.8/7.9 | 5.2/3.7 | 0.53/0.47 | 1.1/43.6 |
Absorption spectra of AnC were recorded in Chl- and Car-free leaf extracts as described in the Materials and methods section. Extracts from leaves with an AnC content ranging from 15–45 nmol cm−2 (n=31) did not reveal any appreciable difference in the features of AnC absorption between species: in acidified water–methanol, the AnC maximum was situated at 525.7±1.3 nm, and absorption at 440 nm was 25.0±4.5% of that in the main maximum, which is compatible with the spectra of cyanidin glycosides (Harborne, 1958). On average, the spectral width of the AnC absorption band was 74.8±1.7 nm.
Anthocyanic leaves with low chlorophyll content
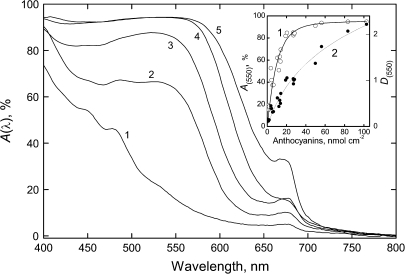
Figure 3 displays attenuance plots of autumn leaves of P. quinquefolia, which are able to accumulate large amounts of AnC. At the advanced stages of Chl degradation, leaves with low AnC (see curve 1) were pale-yellow in appearance and were characterized by two bands around 440–450 nm and 480 nm attributable to Car on a background, rising rapidly at shorter wavelengths, probably due to the accumulation of UV-absorbing phenolics and/or their polymerization products (Merzlyak et al., 2004). In these leaves, absorptance at 550 nm was as high as 15%. A build-up of AnC exerted a strong content-dependent effect on light absorptance of the leaves between 500 nm and 600 nm, and was accompanied by peak broadening.
Fig. 3.
Effect of anthocyanin on light absorption by autumn P. quinquefolia leaves with low Chl (<1 nmol cm−2). Representative absorptance plots of leaves with anthocyanin content (nmol cm−2): 1–0.9, 2–12.9, 3–26.9, 4–38.9, and 5–53.1. Insert: Relationships between absorptance (curve 1, left scale), attenuance (curve 2, right scale) at 550 nm versus anthocyanin content.
AnC maxima in attenuance plots were found between 530 nm and 542 nm; the apparent bandwidth comprised c. 110–130 nm. The shapes of the AnC band in the normalized attenuance spectra for the Chl-free leaves strongly differing in AnC content were more or less similar (not shown). Attenuance at 550 nm displayed a non-linear dependence on [AnC], the AnC content (Fig. 3, insert); the data could be fitted satisfactorily to a smooth curve , defined by the relation , where α0 and α1 are constants; when α1[AnC]<<1, one can write , which explains the initial near-linear behaviour. Absorptance at 550 nm departed from a linear trend at lower values of [AnC], which is to be expected from the definition of this quantity.
Chl-containing leaves
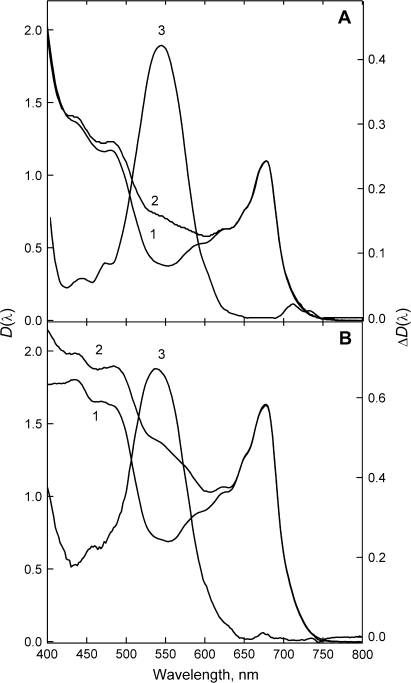
In the light of the foregoing observations, further AnC-related optical properties in leaves with substantial amounts of Chl were analysed in terms of attenuance. The spectra of the leaves (Figs 4, 5) displayed, in addition to strong bands of Chl (in the red and the blue) and Car (as shoulders in the blue), absorption increasing towards near UV and related, presumably, to flavonols (Merzlyak et al., 2004, 2008). AnC in red leaves manifested itself as an increased absorption or as a shoulder between 500 nm and 600 nm.
Fig. 4.
Attenuance plots of green (1) and red (2) spring A. platanoides (A) and C. avellana (B) leaves (left scales) and their difference (anthocyanic-minus-acyanic) spectra (curve 3 in A and B, right scale). Leaf pigment contents are shown in Table 1.
Fig. 5.
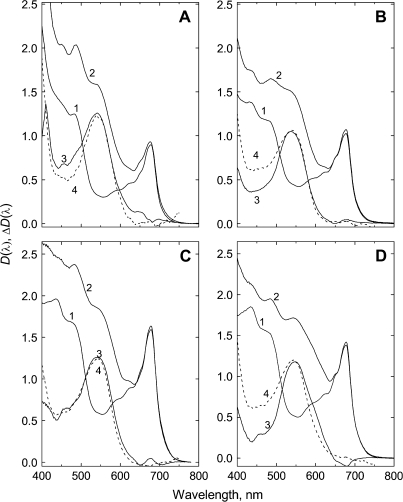
Attenuance plots of green (1) and red (2) autumn leaves and (3) their difference (anthocyanic-minus-acyanic) spectra (left scale). Scaled attenuance plots of vacuoles measured in cross-sections of anthocyanic leaves are plotted on the right scale (broken lines). (A) A. platanoides, (B) P. quinquefolia, (C) C. alaunica, and (D) C. alba. Pigment content is shown in Table 1.
For young A. platanoides and C. avellana leaves with almost equal Chl absorption between 620 nm and 700 nm, the difference spectrum ΔD(λ) showed bands centred around 544 nm and 540 nm, respectively, attributable to AnC. The maximum near 540 nm is also present in the difference spectrum of spring C. alaunica leaves (not shown). In addition, the difference spectra of young stressed leaves contained small bands between 420 nm and 480 nm.
In the spectra of red autumnal leaves (Fig. 5), spectral features of AnC absorption were more prominent and the amplitude of the differences between the spectra was higher; AnC absorption maxima in A. platanoides, C. alaunica, C. alba, and P. quinquefolia leaves were located near 541, 540, 547, and 537 nm, respectively. In general, the shapes of the AnC spectra between 500 nm and 600 nm were similar and maxima positions were close to those in spectra recorded both for the whole leaves and via microspectrophotometry of vacuoles in situ (as with C. alaunica at shorter wavelengths). Between 400 nm and 500 nm in C. alba and P. quinquefolia (but not in A. platanoides) vacuolar absorption exceeded that of AnC revealed in leaves.
Attenuance at 550 nm and 700 nm versus chlorophyll and anthocyanin content
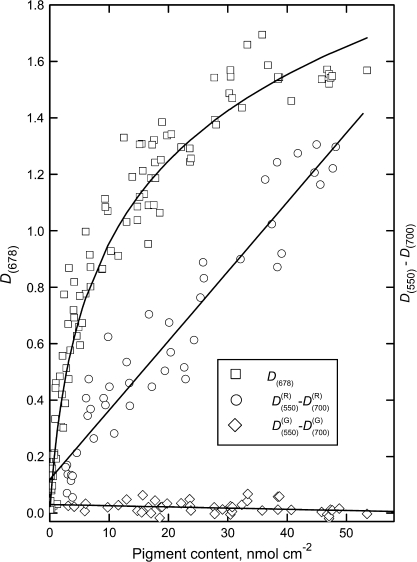
The relationships between attenuance at Chl red and AnC maxima and Chl content were examined. In A. platanoides leaves (Fig. 6), as in the leaves of other species (not shown), Chl attenuance at 678 nm showed a non-linear behaviour. Previously, examining reflection spectra in acyanic leaves and fruit, a strong correlation was found between reflectances at 550 nm and 700 nm, and it was used for developing algorithms for non-destructive AnC assessment (Gitelson et al., 2001; Merzlyak et al., 2003). As may be seen from Figs 4 and 5, attenuance values at 550 nm and 700 nm were also closely related. Accordingly, for AnC-free A. platanoides leaves regardless of Chl content the difference D550–D700 was small (curve 2 in Fig. 6). By contrast, the anthocyanic leaves in which D550 corresponds to combined AnC and Chl absorption and D700 corresponds solely to Chl absorption (Gitelson et al., 2001), the difference showed a close linear correlation with AnC content (line 3 in Fig. 6). Highly significant linear correlations between (D550–D700) and AnC content (r2 ranging from 0.94 to 0.87 in A. platanoides and P. quinquefolia, respectively) were found in the leaves of all species studied allowing non-destructive assessment of AnC with RMSE from 4.1–5.9 nmol cm−2 in their content up to 50 nmol cm−2 (Table 2).
Fig. 6.
A. platanoides leaves: relationships between attenuance at 678 nm, D678, versus chlorophyll content, the difference, D550–D700, versus chlorophyll for anthocyanin-free leaves and difference D550–D700 versus anthocyanins for anthocyanic leaves.
Table 2.
Relationships between AnC content (nmol cm−2) and attenuance difference D550– D700 in the form [AnC]=k×(D550–D700), for the leaves of five species studied
| Species | N | Chlorophylls (nmol cm−2) | Anthocyanins (nmol cm−2) | k | r2 | RMSEa (nmol cm−2) |
| A. platanoides | 42 | 36.8b; (9.0±8.4)c | 46.2; (20.2±15.3) | 36.96d | 0.94d | 4.09d |
| C. alaunica | 14 | 44.8; (18.1±15.1) | 46.7; (15.9±18.8) | 33.38 | 0.93 | 4.49 |
| C. alba | 27 | 16.8; (4.8±13.8) | 50.8; (17.3±14.3) | 31.03 | 0.91 | 5.37 |
| C. avellana | 15 | 38.8; (28.8±4.3) | 46.5; (17.0±12.4) | 37.17 | 0.91 | 3.76 |
| P. quinquefolia | 34 | 40.1; (5.0±8.4) | 49.8; (22.6±15.8) | 28.30 | 0.87 | 5.89 |
| All | 132 | (28.8±13.8) | (17.3±16.5) | 31.96 | 0.87 | 5.58 |
RMSE, root mean square error.
The maximal value in the data set.
(mean±standard deviation).
See also Fig. 6.
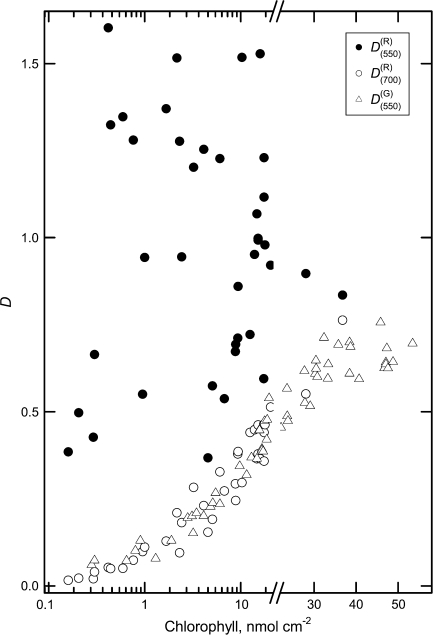
The relationships between D550 and D700 were used to follow the extent of the AnC contribution into total absorption in randomly collected A. platanoides leaves, using Chl as a marker of development stage and senescence (Fig. 7). In mature-to-senescent leaves the changes of attenuance at 700 nm in both anthocyanic and acyanic (green-to-yellow in colour) leaves were similar. For the data set, as could be judged from the relative magnitudes of D550 and D700, mature dark-green leaves were devoid of AnC. Small contributions of AnC to total absorption were detected in leaves with a Chl content of 25–35 nmol cm−2. The highest effect of AnC on light absorption at 550 nm took place from early (when Chl content dropped below 20 nmol cm−2) and up to advanced (Chl of c. 0.5 nmol cm−2) stages of leaf senescence.
Fig. 7.
A. platanoides leaves: relationships between attenuance at 550 nm and 700 nm for anthocyanic leaves (anthocyanin content >4 nmol cm−2), and , respectively, attenuance at 550 nm for anthocyanin-free specimens, , and chlorophyll content.
Discussion
In this work AnC spectral properties, retrieved by comparing selected anthocyanic and acyanic leaves with similar Chl absorption in the red region, were studied in Chl-free and in Chl-containing leaves. Assuming that if Chl absorption in two leaves is similar in the red region, it will remain so at shorter wavelengths, the difference ‘anthocyanic-minus-acyanic’ spectra revealed a strong AnC absorption between 450 nm and 600 nm and the presence of other chromophores absorbing between 450 nm and 400 nm. Similar AnC spectra were recorded from vacuoles using microspectrophotometry of leaf cross-sections. The increased absorption at wavelengths shorter than 440 nm frequently recorded in vacuoles of anthocyanic leaves is consistent with the presence of UV-absorbing flavonols and other phenolics (Cerovic et al., 2002; Merzlyak et al., 2008).
Although chemical identification was not performed, spectral analysis (using position of the maxima and the shapes of the spectra) of Chl- and Car-free leaf extracts suggests that AnC in the species under investigation is represented mainly by cyanidin and its glycosides (Harborne, 1958), the characteristic AnC of the plant leaf in all stages of its growth (Harborne, 1976). According to difference spectroscopy and microspectrophotometry, AnC absorption maxima in leaves with appreciable Chl contents were located between 537 nm and 544 nm. In senescing Chl-free P. quinquefolia leaves, AnC maxima were found between 530 nm and 542 nm suggesting the accumulation of several spectral forms of AnC. The bathochromic (5–20 nm) shift of the AnC maxima in vivo and broadening of their absorption band as compared with solution spectra may involve effects of self-association, co-pigmentation by flavonols and protoanthocyanidins, metal chelating etc. (Harborne, 1976; Strack and Wray, 1989; Ito et al., 2004). Evidently these circumstances (on the background of changing Chl and Car contents) were responsible for the difference in leaf coloration.
In A. platanoides, similarly to the leaves of other species (not shown), attenuance at 678 nm was linearly related to Chl in the narrow content range (up to 5–7 nmol cm−2) corresponding to a specific Chl absorption coefficient (per unit area) of c. 150 cm2 μmol−1. At a higher content, a strong negative departure from the linearity was observed and D678 reached relatively constant values at a Chl content of 30–40 nmol cm−2. By contrast, attenuance at 550 nm compensated for the contribution of Chl showed a linear correlation with AnC in a wide range of their content. Remarkably, in the green region of the spectrum, AnC absorption (on a Chl background) was high, with a magnitude close to that of Chl in the red maximum.
Despite the difficulties related to recording both reflection and transmission of optically dense specimens, the measurements reported here provided a more precise assessment of AnC over a wide concentration range as compared with the quantification via reflectance only (cf. Gitelson et al., 2001). The determination coefficients for linear relationships between the difference D550–D700 and AnC content varied from 0.93 (A. platanoides and C. alaunica) to 0.87 (P. quinquefolia), allowing non-destructive AnC estimation with RMSE of 4.1–5.9 nmol cm−2, respectively (Table 2). The apparent AnC specific absorption coefficients for Chl-containing leaves differ by a factor of 1.5 ranging from to 21.6 to 30.8 cm2 μmol−1 in C. avellana and P. quinquefolia leaves, respectively. For Chl-free P. quinquefolia leaves the coefficient was higher reaching 36.5 cm2 μmol−1. Collectively, the quantitative data suggest that (in contrast to Chl) light absorption by vacuolar AnC in leaves behaves similarly to that in concentrated pigment solution as affected by pigment aggregation and co-pigmentation and, to a large extent, follows the modified Lambert–Beer law.
The above analysis shows that AnC pigments compete strongly with Chl for light absorption in the green range and with Chl b and Car for absorption at shorter wavelengths. In Chl-free leaves, when the AnC content became as high as 40–50 nmol cm−2, absorptance at 550 nm and in the 500–600 nm band reached 95%. Furthermore, at high AnC content their contribution to light absorption was profound even in the 600–650 nm band. It is remarkable that AnC pigments absorb strongly in the 500–600 nm region, close to the solar energy maximum in the gap between the region of strong absorption by Chl and Car at one end of the visible spectrum (400–500 nm) and the other, red end, where Chl captures the light that penetrates deep into plant tissue (Merzlyak and Gitelson, 1995; Sun et al., 1998; Nishio, 2000) and efficiently drives CO2 fixation (Sun et al., 1998; Nishio, 2000). The characterization of AnC absorption in leaves is consistent with and indirectly supports the hypothesis about the important role of green light in photosynthesis.
The efficiency of photoprotection by AnC should strongly depend on their localization within plant tissue (Gould et al., 2002); it can be evaluated in terms of external filtering, when photoprotective pigment(s) serve as a screen, and/or internal filtering, when such pigments compete with light absorption by Chl within a leaf. Due to the epidermal localization of AnC, the spring sun-exposed A. platanoides and C. avellana leaves (Fig. 1) could be regarded, to a large extent, as illustrations of AnC functioning as a screen. The independence of AnC and Chl absorption as well as spectral features of AnC in leaves described here provide a means for quantifying the difference between the incident flux L0(λ) and the reduced flux that reaches the thylakoids (Equations 1, 2). Figure 2A, B (curve 3) demonstrates the estimated chloroplast thylakoid pigment absorptance plots of the anthocyanic leaves when illuminated from the adaxial surface only (A. platanoides) and from both adaxial and abaxial surfaces (C. avellana). According to our estimates, AnC reduce considerably light absorption by leaf photosynthetic apparatus between 400 nm and 600 nm and around 550 nm, more than two and four times in A. platanoides and C. avellana, respectively. However, this modelling approach is oversimplified in that it presumes that the entire leaf surface is covered by epidermal AnC.
In mature assimilatory tissues of plants, vacuoles occupy a large part of the cell volume and fulfil a number of important physiological functions (Taiz, 1992) including, in senescing leaves, the final steps of Chl catabolism (Hörtensteiner, 2006). The accumulation of vacuolar AnC in amounts comparable with and exceeding those of chloroplast pigments at the early stages of ontogenesis, under stressful conditions or during autumnal dismantling of the photosynthetic machinery, should provide a long-term protection from phototoxicity mediated by Chl, its degradation products and other potent endogenous photosensitizers present in leaf tissue. The quantification of the extent of the AnC photoprotection in well-differentiated mature and senescing leaves in terms of both external and internal light filtering requires a more detailed knowledge of specific leaf optical properties and, in particular, wavelength-dependent light gradients through a leaf (Ustin et al., 2001; Gould et al., 2002). Nevertheless, the data presented here could be useful for understanding photoprotection and light absorption, ‘by foliar anthocyanins, from a wide variety of species and ontogenetic stages, across anthocyanin-absorbing wavelengths’ (Close and Beadle, 2003) in physiological and ecophysiological studies.
Acknowledgments
The authors are grateful to Professor AA Gitelson for his helpful discussions and to NP Buzulukova for her help in the preparation of leaf cross-sections and drawing pictures. This work was supported in part by a grant (no. 06-04-4883) from the Russian Foundation for Basic Research and Russia President's Grant Council (Ministry of Science of the Russian Federation, grant no. MK-3433.2008.4).
Glossary
Abbreviations
- AnC
anthocyanin(s)
- Car
carotenoid(s)
- Chl
chlorophyll(s)
References
- Cerovic ZG, Ounis A, Cartelat A, Latouche G, Goulas Y, Meyer S, Moya I. The use of chlorophyll fluorescence excitation spectra for the non-destructive in situ assessment of UV-absorbing compounds in leaves. Plant, Cell and Environment. 2002;25:1663–1676. [Google Scholar]
- Chalker-Scott L. Environmental significance of anthocyanins in plant stress responses. Photochemistry and Photobiology. 1999;70:1–9. [Google Scholar]
- Close DC, Beadle CL. The ecophysiology of foliar anthocyanin. The Botanical Review. 2003;69:149–161. [Google Scholar]
- Esau K. Anatomy of seed plants. New York: John Wiley & Sons; 1960. [Google Scholar]
- Fahn A. Plant anatomy. 4th edn. New York: Pergamon Press; 1990. [Google Scholar]
- Field TS, Lee DW, Holbrook NM. Why leaves turn red in autumn. The role of anthocyanins in senescing leaves of red-osier dogwood. Plant Physiology. 2001;127:566–574. [PMC free article] [PubMed] [Google Scholar]
- Gitelson AA, Merzlyak MN, Chivkunova OB. Optical properties and non-destructive estimation of anthocyanin content in plant leaves. Photochemistry and Photobiology. 2001;74:38–45. doi: 10.1562/0031-8655(2001)074<0038:opaneo>2.0.co;2. [DOI] [PubMed] [Google Scholar]
- Gould KS, Vogelmann TC, Han Q, Clearwater MJ. Profiles of photosynthesis within red and green leaves of Quintinia serrata. Physiologia Plantarum. 2002;116:127–133. doi: 10.1034/j.1399-3054.2002.1160116.x. [DOI] [PubMed] [Google Scholar]
- Harborne JB. Spectral methods of characterizing anthocyanins. Biochemical Journal. 1958;70:22–28. doi: 10.1042/bj0700022. [DOI] [PMC free article] [PubMed] [Google Scholar]
- Harborne JB. Function of flavonoids in plants. In: Goodwin TW, editor. Chemistry and biochemistry of plant pigments. London: Academic Press Inc.; 1976. pp. 736–778. [Google Scholar]
- Hoch WA, Singsaas EL, McCown BH. Resorption protection. anthocyanins facilitate nutrient recovery in autumn by shielding leaves from potentially damaging light levels. Plant Physiology. 2003;133:1296–1305. doi: 10.1104/pp.103.027631. [DOI] [PMC free article] [PubMed] [Google Scholar]
- Hoch WA, Zeldin EL, McCown BH. Physiological significance of anthocyanins during autumnal leaf senescence. Tree Physiology. 2001;21:1–8. doi: 10.1093/treephys/21.1.1. [DOI] [PubMed] [Google Scholar]
- Hörtensteiner S. Chlorophyll degradation during senescence. Annual Review of Plant Biology. 2006;57:55–77. doi: 10.1146/annurev.arplant.57.032905.105212. [DOI] [PubMed] [Google Scholar]
- Hughes NM, Neufeld HS, Burkey KO. Functional role of anthocyanins in high-light winter leaves of the evergreen herb Galax urceolata. New Phytologist. 2005;168:575–587. doi: 10.1111/j.1469-8137.2005.01546.x. [DOI] [PubMed] [Google Scholar]
- Hughes NM, Smith WK. Attenuation of incident light in Galax urceolata (Diapensiaceae): concerted influence of adaxial and abaxial anthocyanic layers on photoprotection. American Journal of Botany. 2007;94:784–790. doi: 10.3732/ajb.94.5.784. [DOI] [PubMed] [Google Scholar]
- Ito F, Tanaka N, Katsuki A, Fujii T. Modulation of color changing paths for flavylium salts by solvent and concentration. Journal of Photochemistry and Photobiology A: Chemistry. 2004;161:111–118. [Google Scholar]
- Merzlyak M, Solovchenko A, Pogosyan S. Optical properties of rhodoxanthin accumulated in Aloe arborescens Mill. leaves under high-light stress with special reference to its photoprotective function. Photochemical and Photobiological Sciences. 2005;4:333–400. doi: 10.1039/b417802e. [DOI] [PubMed] [Google Scholar]
- Merzlyak MN, Chivkunova OB, Melø TB, Naqvi KR. Does a leaf absorb radiation in the Near Infra Red (780–900 nm)? A new approach to quantifying optical reflection, absorption and transmission of leaves. Photosynthesis Research. 2002;72:263–270. doi: 10.1023/A:1019823303951. [DOI] [PubMed] [Google Scholar]
- Merzlyak MN, Gitelson AA. Why and what for the leaves are yellow in autumn? On the interpretation of optical spectra of senescing leaves (Acer platanoides L.) Journal of Plant Physiology. 1995;145:315–320. [Google Scholar]
- Merzlyak MN, Melø TB, Naqvi KR. Estimation of leaf transmittance in the near infrared region through reflectance measurements. Journal of Photochemistry and Photobiology B: Biology. 2004;74:145–150. doi: 10.1016/j.jphotobiol.2004.03.003. [DOI] [PubMed] [Google Scholar]
- Merzlyak MN, Melø TB, Naqvi KR. Effect of anthocyanins, carotenoids and flavonols on chlorophyll fluorescence excitation spectra in apple fruit: signature analysis, assessment, modelling, and relevance to photoprotection. Journal of Experimental Botany. 2008;59:349–359. doi: 10.1093/jxb/erm316. [DOI] [PubMed] [Google Scholar]
- Merzlyak MN, Solovchenko AE, Gitelson AA. Reflectance spectral features and non-destructive estimation of chlorophyll, carotenoid and anthocyanin content in apple fruit. Postharvest Biology and Technology. 2003;27:197–211. [Google Scholar]
- Nishio JN. Why are plants green? Evolution of the higher plant photosynthetic pigment complement. Plant, Cell and Environment. 2000;23:539–548. [Google Scholar]
- Osborne BA, Raven JA. Light absorption by plants and its implication for photosynthesis. Biological Reviews. 1986;61:1–61. [Google Scholar]
- Pfündel EE, Agati G, Cerovic ZG. Optical properties of plant surfaces. In: Riederer M, Müller C, editors. Biology of the plant cuticle. Annual plant reviews. Oxford: Blackwell Publishing; 2006. pp. 216–249. [Google Scholar]
- Pietrini F, Iannelli MA, Massacci A. Anthocyanin accumulation in the illuminated surface of maize leaves enhances protection from photo-inhibitory risks at low temperature, without further limitation to photosynthesis. Plant, Cell and Environment. 2002;25:1251–1259. [Google Scholar]
- Pietrini F, Massacci A. Leaf anthocyanin content changes in Zea mays L. grown at low temperature: significance for the relationship between the quantum yield of PS II and the apparent quantum yield of CO2 assimilation. Photosynthesis Research. 1998;58:213–219. [Google Scholar]
- Richter T, Fukshansky L. Optics of a bifacial leaf. 2. Light regime as affected by the leaf structure and the light source. Photochemistry and Photobiology. 1996;63:517–527. [Google Scholar]
- Solovchenko AE, Chivkunova OB, Merzlyak MN, Reshetnikova IV. A spectrophotometric analysis of pigments in apples. Russian Journal of Plant Physiology. 2001;48:801–808. [Google Scholar]
- Solovchenko AE, Merzlyak MN. Screening of visible and UV radiation as a photoprotective mechanism in plants. Russian Journal of Plant Physiology. 2008;55 (in press) [Google Scholar]
- Steyn WJ, Wand SJE, Holcroft DM, Jacobs G. Anthocyanins in vegetative tissues: a proposed unified function in photoprotection. New Phytologist. 2002;155:349–361. doi: 10.1046/j.1469-8137.2002.00482.x. [DOI] [PubMed] [Google Scholar]
- Strack D, Wray V. Anthocyanins. In: Harborne JB, editor. Methods in plant biology, Vol. 1. Plant phenolics. London: Academic Press/Harcourt Brace Jovanovich; 1989. pp. 325–356. [Google Scholar]
- Sun J, Nishio JN, Vogelmann TC. Green light drives CO2 fixation deep within leaves. Plant and Cell Physiology. 1998;39:1020–1026. [Google Scholar]
- Taiz L. The plant vacuole. Journal of Experimental Biology. 1992;172:113–122. doi: 10.1242/jeb.172.1.113. [DOI] [PubMed] [Google Scholar]
- Ustin SL, Jacquemoud S, Govaerts Y. Simulation of photon transport in a three-dimensional leaf: implications for photosynthesis. Plant, Cell and Environment. 2001;24:1095–1103. [Google Scholar]
- Wellburn AR. The spectral determination of chlorophylls a and b, as well as total carotenoids, using various solvents with spectrophotometers of different resolution. Journal of Plant Physiology. 1994;144:307–313. [Google Scholar]


