

Abstract
Gibberella zeae is one of the most devastating pathogens of barley and wheat in the United States. The fungus also infects noncereal crops, such as potatoes and sugar beets, and the genetic relationships among barley, wheat, potato, and sugar beet isolates indicate high levels of similarity. However, little is known about the toxigenic potential of G. zeae isolates from potatoes and sugar beets. A total of 336 isolates of G. zeae from barley, wheat, potatoes, and sugar beets were collected and analyzed by TRI (trichothecene biosynthesis gene)-based PCR assays. To verify the TRI-based PCR detection of genetic markers by chemical analysis, 45 representative isolates were grown in rice cultures for 28 days and 15 trichothecenes and 2 zearalenone (ZEA) analogs were quantified using gas chromatography-mass spectrometry. TRI-based PCR assays revealed that all isolates had the deoxynivalenol (DON) marker. The frequencies of isolates with the 15-acetyl-deoxynivalenol (15-ADON) marker were higher than those of isolates with the 3-acetyl-deoxynivalenol (3-ADON) marker among isolates from all four crops. Fusarium head blight (FHB)-resistant wheat cultivars had little or no influence on the diversity of isolates associated with the 3-ADON and 15-ADON markers. However, the frequency of isolates with the 3-ADON marker among isolates from the Langdon, ND, sampling site was higher than those among isolates from the Carrington and Minot, ND, sites. In chemical analyses, DON, 3-ADON, 15-ADON, b-ZEA, and ZEA were detected. All isolates produced DON (1 to 782 μg/g) and ZEA (1 to 623 μg/g). These findings may be useful for monitoring mycotoxin contamination and for formulating FHB management strategies for these crops.
Gibberella zeae (Schwein.) Petch (anamorph, Fusarium graminearum Schwabe) causes Fusarium head blight (FHB) in wheat and other small grains worldwide (24, 32). In past decades, severe FHB epidemics in the United States have been reported, causing high-yield losses and mycotoxin contamination (8, 24, 40). Among mycotoxins, trichothecenes are one of the major groups (8) and include deoxynivalenol (DON), nivalenol (NIV), 3-acetyl-deoxynivalenol (3-ADON), and 15-acetyl-deoxynivalenol (15-ADON) (28, 29). DON is regarded as one of the most important trichothecenes because it accumulates to toxic levels in the infected grains and it is potentially harmful to human and animal health (8, 10). In general, these toxins mainly inhibit protein synthesis and mitochondrial function in eukaryotic cells (33).
Genes required for trichothecene biosynthesis in G. zeae have been cloned, and the functions of some of these genes have been investigated previously (4, 9, 21). TRI (trichothecene biosynthesis gene)-based PCR assays have been developed and used to identify G. zeae isolates associated with DON, 3-ADON, 15-ADON, and NIV markers (7, 21, 35, 38). The identification of G. zeae genotypes by TRI-based PCR assays (7, 35, 38) has been validated previously by gas chromatography-mass spectrometry (GC-MS) analyses (4, 6).
In North Dakota and Minnesota, climactic conditions, soils, and agronomic practices are suitable for barley, wheat, potato, and sugar beet cultivation. Abundant rainfall and warm temperatures often occur during multiple growth stages of these crops in both states (25). These environmental conditions are highly conducive to G. zeae infection and mycotoxin contamination. Recently, G. zeae has been reported to cause dry rot in potatoes (1) and Fusarium yellows in sugar beets (16), and it has been associated previously with moldy sugar beets in storage (3). In addition, G. zeae isolates from potatoes and sugar beets cause typical FHB symptoms in susceptible wheat cultivars (6, 12). Although G. zeae can cause severe infections in potato tubers and sugar beet taproots under conditions favorable for disease development, estimates of yield losses due to the disease are not yet available. However, a survey of commercial potato storages in North Dakota and Minnesota in 2004 and 2005 showed that 42% of the dry rot was caused by G. zeae (12).
North Dakota State University (NDSU) has released several wheat cultivars moderately resistant to FHB (26). Among them, Alsen, Glenn, and Steele-ND have been widely cultivated in North Dakota. For example, Alsen accounted for 29 and 23% of the wheat acreage in North Dakota during 2004 and 2005, respectively (36). Although several other wheat cultivars, such as Briggs, Dapps, Granite, Gunner, Knudson, Norpro, and Saturn, are commercially grown in North Dakota, these cultivars are susceptible to FHB. The influence of relatively new FHB-resistant wheat cultivars on mycotoxin profiles of G. zeae has not been examined fully.
We hypothesize that G. zeae isolates collected from potatoes and sugar beets can produce different mycotoxins at quantities similar to those produced by isolates obtained from barley and wheat and that these isolates can be distinguished by PCR detection of genetic markers and chemical analyses. The main objectives of this study were to (i) determine the frequencies of G. zeae isolates linked with different trichothecene-specific genetic markers, (ii) validate the use of TRI-based PCR genotyping by chemical analysis as an alternative to mycotoxin profiling of G. zeae by GC-MS, and (iii) examine the effects of crops, wheat cultivars, and sampling sites on the occurrence of isolates associated with the 3-ADON and 15-ADON markers. In this paper, the term “population” refers to all isolates from one crop, location, or wheat cultivar. We use different terms to describe G. zeae isolates analyzed by TRI gene-based PCR assays and those analyzed by GC-MS to avoid any confusion between the results of these assays. Isolates determined by TRI gene-based PCR assays to be associated with the 3-ADON or the 15-ADON marker are referred to as isolates with the 3-ADON or the 15-ADON genetic marker. In contrast, G. zeae isolates for which we actually measured the production of mycotoxins by GC-MS are described as DON, 3-ADON, and 15-ADON producers. This study provides information on how crops, sampling sites, and host plant resistance affect the distribution of trichothecene-producing isolates of G. zeae in North Dakota.
MATERIALS AND METHODS
Fungal populations.
Detailed information concerning the methods of sample collection and the sources, isolation, and identification of G. zeae isolates was provided previously (5, 6). In all, 336 isolates of G. zeae from barley (n = 28 isolates), wheat (n = 243 isolates), potatoes (n = 38 isolates), and sugar beets (n = 27 isolates) were included in this study.
DNA extraction and PCR primers.
Genomic DNA from each isolate was extracted as described previously (5). The primers used for TRI-based PCR assays (Table 1) were synthesized by Integrated DNA Technologies, Inc. (Coralville, IA).
TABLE 1.
TRI-based PCR assays, primers, and sequences used in this study
| TRI-based PCR assay | Primer | Sequence (5′-3′) | Target toxin(s) | Reference(s) |
|---|---|---|---|---|
| TRI13 | TRI13F | CATCATGAGACTTGTKCRAGTTTGGG | DON | 7 |
| TRI13R | TTGAAAGCTCCAATGTCGTG | |||
| TRI3 | 3CON | TGGCAAAGACTGGTTCAC | 3-ADON and 15-ADON | 35, 38 |
| 3NA | GTGCACAGAATATACGAGC | |||
| 3D15A | ACTGACCCAAGCTGCCATC | |||
| 3D3A | CGCATTGGCTAACACATG | |||
| TRI12 | 12CON | CATGAGCATGGTGATGTC | 3-ADON and 15-ADON | 35, 38 |
| 12NF | TCTCCTCGTTGTATCTGG | |||
| 12-15F | TACAGCGGTCGCAACTTC | |||
| 12-3F | CTTTGGCAAGCCCGTGCA |
Analysis of G. zeae isolates by TRI-based PCR assays with allele-nonspecific (TRI13) and allele-specific (TRI3 and TRI12) markers.
We conducted the following two tests to determine if G. zeae isolates collected from barley, wheat, potatoes, and sugar beets could be differentiated by TRI-based PCR assays (7, 35, 38). To differentiate isolates associated with the DON marker as well as the NIV marker from the four crops, the TRI13-based PCR assay was performed (7). All reagents used for PCR assays were bought from Promega Corporation (Madison, WI). PCRs and conditions were as described previously (7) with some modifications. Briefly, each PCR mixture (12 μl) contained 5.0 μl of sterile ultrapure water, 1.0 μl of 10× PCR buffer, 1.0 μl of 25 mM MgCl2, 0.25 μl of 10 mM deoxynucleoside triphosphate mix, 0.75 μl of 5-U/μl Taq polymerase, 1 μl of a 2 μM concentration of each forward and reverse primer, and 2 μl of 10-ng/μl genomic DNA.
To further differentiate isolates associated with the DON marker into isolates with the 3-ADON marker and those with the 15-ADON marker, we used two TRI-based multiplex PCR assays (35, 38). Our multiplex approach used four primers (one reverse primer and three forward primers) in each assay (Table 1); primers that were designed from the trichothecene 15-O-acetyltransferase (TRI3) gene corresponded to the TRI3-based multiplex PCR assay, and those designed from the trichothecene efflux pump (TRI12) gene corresponded to the TRI12-based multiplex PCR assay (Table 1). All PCRs and conditions were the same as those described previously (35, 38).
Gel electrophoresis and photography.
PCR assays were repeated at least twice to verify the reproducibility of results. In negative control reactions, water was used instead of DNA. Either the 50-bp or the 1-kb DNA ladder (Invitrogen Corporation, Carlsbad, CA) was used as a size marker. The PCR products were separated on gels of 2% (wt/vol) agarose (Amresco, Solon, OH) and stained with ethidium bromide (10 mg/ml) for 10 min. After the destaining of the gels with distilled water for 20 min, photographs were taken with a Fluorochem 2200 image system (Alpha Innotech Corp., San Leandro, CA).
Chemical analysis of mycotoxins by GC-MS.
To verify the results of assays for TRI-based genetic markers by chemical analyses, 45 representative isolates (4 isolates from barley, 30 isolates from wheat, 5 isolates from potatoes, and 6 isolates from sugar beets) were randomly selected and 15 trichothecenes and 2 zearalenone (ZEA) analogs were quantified using GC-MS. Isolates associated with both the 3-ADON and 15-ADON markers from the four crops and the 10 wheat cultivars were included in this experiment. Approximately 30 g of rice grains was soaked in 100 ml of sterile distilled water in each 250-ml Erlenmeyer flask for 6 h. Water was drained from each flask, and the soaked rice was autoclaved twice. A single-spore culture of each isolate stored at −80°C was revived on half-strength potato dextrose agar (Difco Co., Detroit, MI). An inoculum of each isolate was prepared from 8- to 10-day-old cultures, and the inoculum concentration was adjusted to 5 × 10⁵ conidia/ml with a hemacytometer. Five milliliters of the inoculum of each isolate was added to each flask. Each isolate was grown at the same time in three 250-ml Erlenmeyer flasks containing rice medium, and the isolate grown in one flask was considered to be one replicate. To distribute the fungal growth evenly throughout the medium, the flasks were shaken by hand twice daily for the first 4 days and incubated for 28 days in the dark at room temperature. Rice cultures were lyophilized at −80°C for 72 h and ground to a fine powder with a mortar and pestle. A 5-g portion of each ground sample was extracted for 1 h with 40 ml of acetonitrile-water (84:16 [vol/vol]) on a horizontal shaker. Approximately 6 ml of the sample extract was gravity filtered through 1.5 g of C18-alumina at a ratio of 1:1. A 3-ml aliquot of the purified extract was transferred into a vial. The solvent was evaporated at 55°C for 1 h. Mycotoxin production was confirmed by GC-MS analysis of trimethylsilyl derivatives. The residue was derivatized with N-trimethylsilylimidazole-trimethylchlorosilane-n,o-bis(trimethylsilyl)trifluoroacetamide-pyridine to form trimethylsilyl ester derivatives of trichothecenes and estrogens.
Each isolate grown in a rice culture was used to quantify 15 trichothecenes (DON, 3-ADON, 15-ADON, NIV, fusarenon X, diacetoxyscirpenol [DAS], scirpentriol, 15-acetoxyscirpentriol, T-2 toxin, iso-T-2 toxin, acetyl-T-2 toxin, T-2 triol, T-2 tetraol, HT-2 toxin, and neosolaniol) and 2 ZEA analogs (b-ZEA and ZEA) by GC-MS at the Veterinary Diagnostic Laboratory, NDSU, Fargo. The GC-MS system consisted of an Agilent network gas chromatograph (model no. 6890N), a quadrupole mass spectrometer (model no. 7683B) equipped with an Agilent injector, and a mass selective detector (Agilent Technologies Inc., Santa Clara, CA). Signals were processed by the MSD Productivity ChemStation software, revision D.03.00SP1 (Agilent Technologies). The trimethylsilyl mycotoxin derivatives were separated on a gas chromatograph by using a 30-m-long Restek RTX-35MS phase capillary column with an internal diameter of 0.25 mm and a film thickness of 0.25 μm. The selected ion monitoring mode (based on m/z values) and electron ionization were used for three or four ion fragments per mycotoxin. The capillary column was held at 90°C for 1 min after on-column injection and heated to 210°C at 50°C/min, and the temperature was then ramped up to 295°C at 5°C/min, after which it was ramped up to 310°C at 50°C/min and held at this point for 1 min (for a total of 21.7 min for the heating procedure) before recycling. The general levels of recovery of mycotoxin at 1 μg/g ranged from 80 to 100%. Fusarium trichothecene standards for DON, 15-ADON, HT-2 toxin, T-2 toxin, DAS, and ZEA were purchased from BioPure Healing Products (Bellevue, WA), while standards for the rest of the mycotoxins were purchased from Sigma-Aldrich, Inc. (St. Louis, MO). Mirex (Absolute Standards, Inc., Hamden, CT) was used as an internal standard, and a 1-μg/g standard that included all 17 mycotoxins was injected for identification. The standard curves were established from 0.2, 0.5, 1, 3, and 6 μg/g for DON, 15-ADON, HT-2 toxin, T-2 toxin, DAS, and ZEA, while the remaining mycotoxins were estimated based on the 1-μg/g standard containing all 17 compounds. The estimated detection limit for the all 17 mycotoxins was 0.5 μg/g. The 15 trichothecenes and 2 ZEA analogs in rice cultures were evaluated by GC-MS based on the comparison of the mass spectra of both internal and external standards and the development of peaks in the samples analyzed.
Data analysis.
Polymorphic DNA fragments were scored manually based on the presence or absence of DNA bands generated by TRI-based PCR assays. To test the effects of crops, wheat cultivars, and sampling sites on the distribution of isolates with the 3-ADON and 15-ADON markers, the χ2 test was performed using SAS (version 9.1; SAS Institute, Cary, NC). Analysis of variance (ANOVA) was performed with log-transformed data for mycotoxin production by 45 isolates in chemical analyses using SAS. The experiments were designed in a randomized complete block design. Mycotoxin samples from the same isolates assayed at multiple time points were considered to be replicates. ANOVAs for DON, 3-ADON, and 15-ADON were performed with three replicates of each isolate, while ANOVA for ZEA was performed with two replicates of each isolate. Standard errors for mycotoxins were calculated to observe the differences among different cultures of the same isolates. All values for mycotoxins produced by G. zeae isolates are presented as means ± standard errors (see Table 3). In addition, Pearson's correlation analysis was performed to determine the relationships between the genetic markers detected by TRI-based PCR and the results of chemical analyses.
TABLE 3.
Mycotoxin production by G. zeae isolates in rice cultures analyzed by GC-MS and presence of trichothecene-specific markers detected by TRI-based multiplex PCR assays
| Isolatea | Host | Host cultivar | Assay result forb:
|
Mean concn (μg/g) ± SEc of:
|
||||||
|---|---|---|---|---|---|---|---|---|---|---|
| DON marker | 3-ADON marker | 15-ADON marker | DON | 3-ADON | 15-ADON | b-ZEA | ZEA | |||
| Fgw1 (W1) | Wheat | Unknown | + | − | + | 77 ± 19 | NDd | 9 ± 4 | ND | 1 ± 1 |
| Fgw2 (W2) | Wheat | Unknown | + | − | + | 253 ± 104 | ND | 10 ± 4 | ND | 167 ± 129 |
| Fgw3 (W3) | Wheat | Unknown | + | − | + | 390 ± 108 | ND | 23 ± 3 | ND | 623 ± 437 |
| Fgw4 (W4) | Wheat | Unknown | + | − | + | 173 ± 109 | ND | 8 ± 1 | ND | 2 ± 1 |
| Fgw5 (W5) | Wheat | Unknown | + | − | + | 18 ± 4 | ND | 2 ± 0.2 | ND | 3 ± 1 |
| Fgw6 (W6) | Wheat | Unknown | + | − | + | 18 ± 2 | ND | 3 ± 1 | ND | 8 ± 2 |
| Fgw7 (W7) | Wheat | Unknown | + | + | − | 69 ± 35 | 7 ± 2 | ND | ND | 5 ± 0.1 |
| Fgw8 (W8) | Wheat | Unknown | + | + | − | 48 ± 26 | 8 ± 2 | ND | ND | 3 ± 1 |
| Fgw9 (W9) | Wheat | Unknown | + | + | − | 31 ± 9 | 16 ± 5 | ND | ND | 2 ± 1 |
| Fgw10 (W10) | Wheat | Unknown | + | + | − | 18 ± 7 | 6 ± 2 | ND | ND | 4 ± 2 |
| Fgw37 | Wheat | Alsen | + | + | − | 46 ± 20 | 21 ± 8 | ND | ND | 3 ± 2 |
| Fgw51 | Wheat | Alsen | + | − | + | 170 ± 131 | ND | 5 ± 4 | 1 ± 1 | 265 ± 243 |
| Fgw62 | Wheat | Briggs | + | + | − | 50 ± 45 | 25 ± 25 | ND | ND | 36 ± 24 |
| Fgw77 | Wheat | Briggs | + | − | + | 2 ± 1 | ND | 1 ± 0.2 | ND | 4 ± 0.2 |
| Fgw79 | Wheat | Dapps | + | − | + | 572 ± 438 | ND | 266 ± 127 | 1 ± 1 | 186 ± 134 |
| Fgw90 | Wheat | Dapps | + | + | − | 110 ± 55 | 7 ± 5 | ND | 1 ± 1 | 7 ± 5 |
| Fgw115 | Wheat | Glenn | + | + | − | 560 ± 399 | 236 ± 197 | ND | 2 ± 0.2 | 114 ± 46 |
| Fgw121 | Wheat | Glenn | + | − | + | 10 ± 2 | ND | 4 ± 1 | ND | 9 ± 9 |
| Fgw133 | Wheat | Granite | + | + | − | 125 ± 78 | 5 ± 4 | ND | ND | 32 ± 32 |
| Fgw136 | Wheat | Granite | + | − | + | 412 ± 228 | 1 ± 0.4 | 16 ± 6 | 2 ± 2 | 201 ± 171 |
| Fgw144 | Wheat | Gunner | + | − | + | 9 ± 2 | ND | 4 ± 1 | 1 ± 1 | 64 ± 64 |
| Fgw155 | Wheat | Gunner | + | + | − | 44 ± 38 | 25 ± 18 | ND | 1 ± 1 | 54 ± 41 |
| Fgw158 | Wheat | Knudson | + | − | + | 10 ± 5 | ND | 27 ± 7 | ND | 8 ± 8 |
| Fgw166 | Wheat | Knudson | + | − | + | 22 ± 20 | ND | 1 ± 0.4 | ND | 5 ± 1 |
| Fgw187 | Wheat | Norpro | + | + | − | 74 ± 17 | 14 ± 6 | ND | ND | 7 ± 6 |
| Fgw190 | Wheat | Norpro | + | − | + | 782 ± 416 | 1 ± 1 | 322 ± 243 | ND | 134 ± 92 |
| Fgw195 | Wheat | Saturn | + | − | + | 16 ± 5 | ND | 8 ± 1 | ND | 8 ± 7 |
| Fgw199 | Wheat | Saturn | + | + | − | 35 ± 23 | 24 ± 11 | ND | 2 ± 2 | 1 ± 0 |
| Fgw228 | Wheat | Steele-ND | + | + | − | 305 ± 25 | 69 ± 30 | 1 ± 1 | ND | 30 ± 7 |
| Fgw247 | Wheat | Steele-ND | + | − | + | 134 ± 72 | ND | 4 ± 1 | ND | 20 ± 19 |
| Fgb7 | Barley | Robust | + | − | + | 182 ± 78 | ND | 22 ± 6 | ND | 1 ± 0.2 |
| Fgb9 | Barley | Conlon | + | − | + | 255 ± 50 | 1 ± 1 | 23 ± 10 | ND | 171 ± 169 |
| Fgb19 | Barley | Conlon | + | − | + | 5 ± 1 | ND | 4 ± 1 | ND | 28 ± 18 |
| Fgb25 | Barley | Robust | + | − | + | 1 ± 0.4 | ND | 1 ± 0.4 | ND | 2 ± 2 |
| Fgp21 (P1) | Potatoes | Unknown | + | − | + | 589 ± 343 | ND | 135 ± 68 | ND | 453 ± 424 |
| Fgp23 (P2) | Potatoes | Unknown | + | − | + | 163 ± 137 | ND | 9 ± 3 | ND | 22 ± 2 |
| Fgp24 (P3) | Potatoes | Unknown | + | + | − | 307 ± 156 | 189 ± 27 | ND | ND | 319 ± 47 |
| Fgp39 (P10) | Potatoes | Unknown | + | − | + | 110 ± 54.2 | ND | 7 ± 3 | ND | 3 ± 1 |
| Fgp40 (P8) | Potatoes | Unknown | + | + | − | 21 ± 2 | 10 ± 1 | ND | ND | 10 ± 8 |
| Fgs1 (S1) | Sugar beets | Unknown | + | − | + | 6 ± 1 | ND | 5 ± 1 | ND | 16 ± 11 |
| Fgs2 (S2) | Sugar beets | Unknown | + | − | + | 9 ± 4.2 | ND | 6 ± 5 | ND | 17 ± 3 |
| Fgs3 (S3) | Sugar beets | Unknown | + | − | + | 84 ± 54 | ND | 13 ± 6 | 1.80 | 1 ± 0.3 |
| Fgs4 (S4) | Sugar beets | Unknown | + | + | − | 247 ± 98 | 111 ± 16 | 1 ± 1 | ND | 1 ± 0.1 |
| Fgs5 (S5) | Sugar beets | Unknown | + | + | − | 44 ± 30 | 59 ± 20 | ND | ND | 2 ± 1 |
| Fgs9 | Sugar beets | Unknown | + | + | − | 336 ± 252 | 120 ± 70 | ND | ND | 8 ± 8 |
| Control | ND | ND | ND | ND | ND | |||||
Isolate names in parentheses were used in a previous study of plant inoculation (6); isolates Fgw1 (W1), Fgw2 (W2), Fgw3 (W3), Fgw4 (W4), Fgw5 (W5), and Fgw6 (W6) were collected from Fargo, ND, whereas isolates Fgw7 (W7), Fgw8 (W8), Fgw9 (W9), and Fgw10 (W10) were collected from Idaho. TRI (TRI3 or TRI12)-based multiplex PCR assays were used to differentiate between isolates with the 3-ADON marker and isolates with the 15-ADON marker.
+, present; −, absent.
The standard errors for the levels of production of all mycotoxins by each isolate were calculated to determine the differences among different cultures of the same isolate.
ND, not detected.
RESULTS
Analysis of G. zeae isolates by TRI-based PCR assays.
In the TRI13-based PCR assay, all 336 analyzed isolates from the four crops yielded the approximately 799-bp fragment expected for isolates with the DON marker (Fig. 1A). None of the isolates yielded the 1,075-bp fragment expected for an isolate with the NIV marker. Further analysis of isolates with the DON marker was performed using the primer sets designed for the TRI3 and TRI12 genes (Table 1). In the TRI3-based multiplex PCR assay, 31% of isolates yielded the approximately 243-bp fragment expected for the 3-ADON marker, while 69% of isolates yielded the approximately 610-bp fragment expected for the 15-ADON marker (Fig. 1B). Similar frequencies of 3-ADON and 15-ADON genetic markers were obtained from the TRI12-based multiplex PCR assay, in which isolates yielded the approximately 410- and 670-bp fragments expected for the 3-ADON marker and the 15-ADON marker, respectively (Fig. 1C).
FIG. 1.
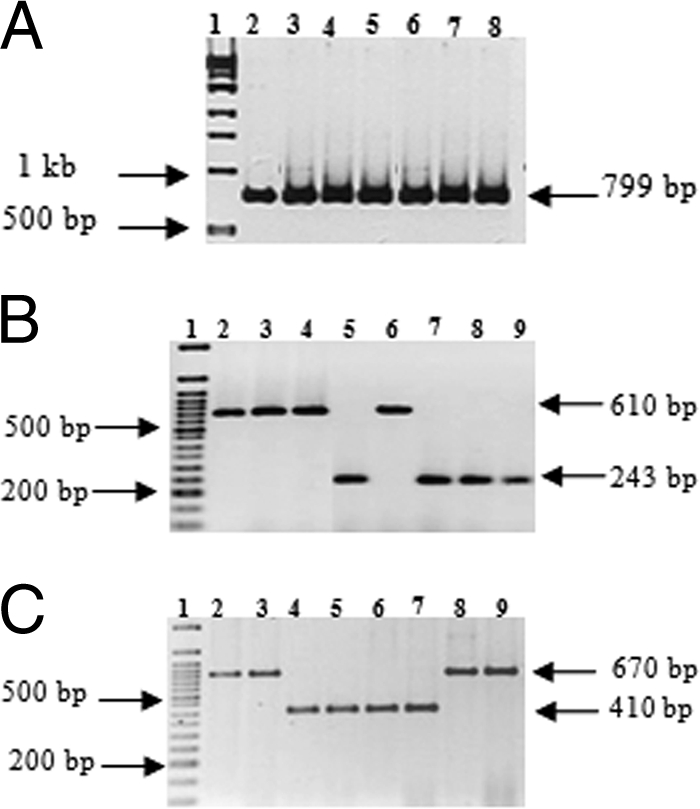
G. zeae isolates with trichothecene-specific markers analyzed by TRI-based PCR assays. The letters “b,” “w,” “p,” and “s” in the isolate designations mentioned below identify isolates collected from barley, wheat, potatoes, and sugar beets, respectively. (A) Analysis of representative isolates of G. zeae for the presence of a DON marker by a TRI13-based PCR assay. The PCR products were amplified with a TRI13-based PCR primer set. Lanes; 1, 1-kb DNA ladder, and 2 to 8, isolates (Fgw79, Fgw115, Fgb7, Fgp21, Fgp24, Fgs3, and Fgs4) with the DON marker. (B) Analysis of representative isolates of G. zeae for the presence of the 3-ADON and 15-ADON markers by a TRI3-based multiplex PCR assay. The PCR products were amplified with TRI3-based multiplex PCR primer sets. Lanes: 1, 50-bp DNA ladder; 2 to 4 and 6, isolates (Fgw79, Fgb7, Fgp21, and Fgs3) with the 15-ADON marker; and 5 and 7 to 9, isolates (Fgw62, Fgw115, Fgp24, and Fgs4) with the 3-ADON marker. (C) Analysis of representative isolates of G. zeae for the presence of the 3-ADON and 15-ADON markers by a TRI12-based multiplex PCR assay. The PCR products were amplified with TRI12-based multiplex PCR primer sets. Lanes: 1, 50-bp DNA ladder; 2, 3, 8, and 9, isolates (Fgw79, Fgb7, Fgp21, and Fgs3) with the 15-ADON marker; and 4 to 7, isolates (Fgw62, Fgw115, Fgp24, and Fgs4) with the 3-ADON marker.
The χ2 value was highly significant (χ2 = 22.52; P < 0.0001) for the frequency distribution of genetic markers for 3-ADON and 15-ADON among isolates of G. zeae from the four crops. Isolates with the 3-ADON and 15-ADON markers were detected among isolates from wheat, potatoes, and sugar beets; however, the majority of isolates (e.g., 62% of isolates from wheat and 84% isolates from potatoes) had the 15-ADON marker (Fig. 2). The frequency of isolates with the 3-ADON marker among wheat isolates was nearly twofold higher than the frequencies of isolates with this marker among potato and sugar beet isolates. All analyzed isolates from barley had the 15-ADON marker.
FIG. 2.
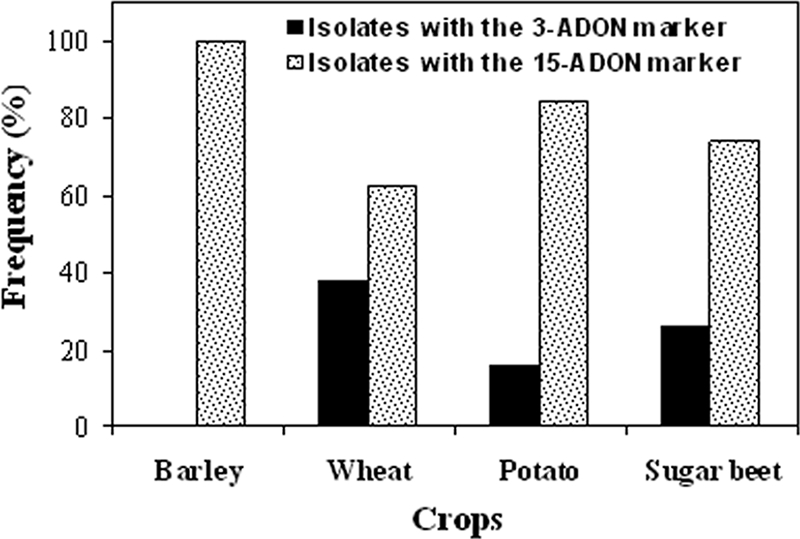
Frequency distribution of genetic markers for 3-ADON and 15-ADON among isolates of G. zeae from four crops as determined by TRI-based PCR assays. The numbers of G. zeae isolates used in the study were as follows: 28 from barley, 243 from wheat, 38 from potatoes, and 27 from sugar beets. TRI3- and TRI12-based multiplex PCR assays were used to differentiate between G. zeae isolates associated with the 3-ADON marker and the 15-ADON marker. χ2 analysis revealed a highly significant difference (χ2 = 22.52; P < 0.0001) in the frequencies of genetic markers for 3-ADON and 15-ADON in G. zeae isolates from four crops.
The frequency distribution of isolates with the 3-ADON and 15-ADON markers from wheat was further analyzed according to the cultivar type and sampling site (Table 2). No significant difference (χ2 = 0.92 to 1.15; P ≥ 0.278 to 0.338) in the frequencies of the 3-ADON and 15-ADON markers among isolates was observed in a comparison of isolates from the moderately FHB-resistant and the susceptible wheat cultivar groups at all sites analyzed. However, the frequencies of these markers differed significantly among isolates from individual cultivars at each site (data not shown). The frequencies among isolates from the wheat cultivars Alsen, Granite, and Saturn differed significantly among sampling sites, while the frequencies among isolates from the other seven cultivars did not differ significantly among sites. In general, the frequencies of isolates with the 3-ADON marker were higher among isolates from the wheat cultivars Alsen (84%) and Saturn (73%) than among isolates from the other cultivars. In contrast, the frequencies of isolates with the 15-ADON marker were higher among isolates from the wheat cultivars Briggs (94%), Glenn (71%), Knudson (100%), and Steele-ND (86%) than among isolates from the other cultivars (Table 2). The wheat cultivars Dapps, Granite, Gunner, and Norpro had nearly equal proportions of isolates associated with the 3-ADON and 15-ADON markers. The frequency of isolates with the 3-ADON marker was higher among isolates from Langdon (55%) than among those from Carrington (26%) and Minot (17%) in North Dakota, indicating that the sampling site influenced the frequency of trichothecene biosynthesis genes in G. zeae (Table 2).
TABLE 2.
Frequencies of G. zeae isolates with the 3-ADON and 15-ADON markers associated with wheat cultivars and sampling sites in North Dakota when analyzed by TRI-based multiplex PCR assays
| Wheat cultivar | No. of isolates from Carrington | % of Carrington isolatesa with:
|
No. of isolates from Langdon | % of Langdon isolatesa with:
|
No. of isolates from Minot | % of Minot isolatesa with:
|
Total no. of isolates | % of total isolatesa with:
|
||||
|---|---|---|---|---|---|---|---|---|---|---|---|---|
| 3-ADON marker | 15-ADON marker | 3-ADON marker | 15-ADON marker | 3-ADON marker | 15-ADON marker | 3-ADON marker | 15-ADON marker | |||||
| Moderately resistant wheat cultivars | ||||||||||||
| Alsen | 8 | 88 | 12 | 18 | 78 | 22 | 10 | 20 | 80 | 36 | 64 | 36 |
| Glenn | 10 | 20 | 80 | 8 | 38 | 62 | 10 | 30 | 70 | 28 | 29 | 71 |
| Steele-ND | 17 | 12 | 88 | 9 | 33 | 67 | 10 | 0 | 100 | 36 | 14 | 86 |
| Subtotal | 35 | 31 | 69 | 35 | 57 | 43 | 30 | 17 | 83 | 100 | 36 | 64 |
| Susceptible wheat cultivars | ||||||||||||
| Briggs | 10 | 0 | 100 | 8 | 13 | 87 | 18 | 6 | 94 | |||
| Dapps | 9 | 33 | 67 | 8 | 75 | 25 | 17 | 53 | 47 | |||
| Granite | 8 | 13 | 87 | 9 | 67 | 33 | 17 | 41 | 59 | |||
| Gunner | 8 | 25 | 75 | 10 | 60 | 40 | 18 | 44 | 56 | |||
| Knudson | 9 | 0 | 100 | 10 | 0 | 100 | 19 | 0 | 100 | |||
| Norpro | 9 | 56 | 44 | 7 | 43 | 57 | 16 | 50 | 50 | |||
| Saturn | 9 | 33 | 67 | 13 | 100 | 0 | 22 | 73 | 27 | |||
| Subtotal | 62 | 23 | 77 | 65 | 54 | 46 | 127 | 39 | 61 | |||
| Total | 97 | 26 | 74 | 100 | 55 | 45 | 30 | 17 | 83 | 227 | 37 | 63 |
Values are percentages of isolates with the indicated trichothecene genotype. TRI (TRI3 or TRI12)-based multiplex PCR assays were used to differentiate between isolates with the 3-ADON marker and isolates with the 15-ADON marker.
Chemical analysis of mycotoxins by GC-MS.
Among the 15 trichothecenes and 2 ZEA analogs analyzed, DON, 3-ADON, 15-ADON, b-ZEA, and ZEA were produced by G. zeae isolates in rice grain cultures (Table 3). None of the isolates produced the 12 remaining mycotoxins (NIV, fusarenon X, DAS, scirpentriol, 15-acetoxyscirpentriol, T-2 toxin, iso-T-2 toxin, acetyl-T-2 toxin, T-2 triol, T-2 tetraol, HT-2 toxin, and neosolaniol) in detectable quantities.
The results of ANOVA revealed that the isolates differed significantly (P < 0.01) in DON, 3-ADON, 15-ADON, and ZEA production (Table 3). Pearson's correlation analysis of TRI-based genetic markers and chemical analysis results indicated that the TRI13-based PCR assay and the TRI3- and TRI12-based PCR assays were all 100% predictors of DON producers and 3-ADON and 15-ADON producers, respectively (Table 3).
The majority of isolates produced large amounts of DON, 3-ADON or 15-ADON, and ZEA (Fig. 3). All isolates produced DON and ZEA, and the amounts ranged from 1 to 782 μg of DON/g and 1 to 623 μg of ZEA/g (Table 3). Most isolates (∼75%) produced DON at levels higher than those of either 3-ADON or 15-ADON. One wheat isolate, Fgw158, produced larger amounts of 15-ADON (27 μg/g) than of DON (10 μg/g), and one sugar beet isolate, Fgs5, produced higher levels of 3-ADON (59 μg/g) than of DON (44 μg/g). All isolates from sugar beets and most isolates from barley and potatoes produced low levels of ZEA. Approximately 22% of isolates produced b-ZEA, and these isolates were mainly from wheat. In general, 3-ADON producers yielded trace levels of or no 15-ADON. Likewise, 15-ADON producers also produced trace levels of or no 3-ADON.
FIG. 3.
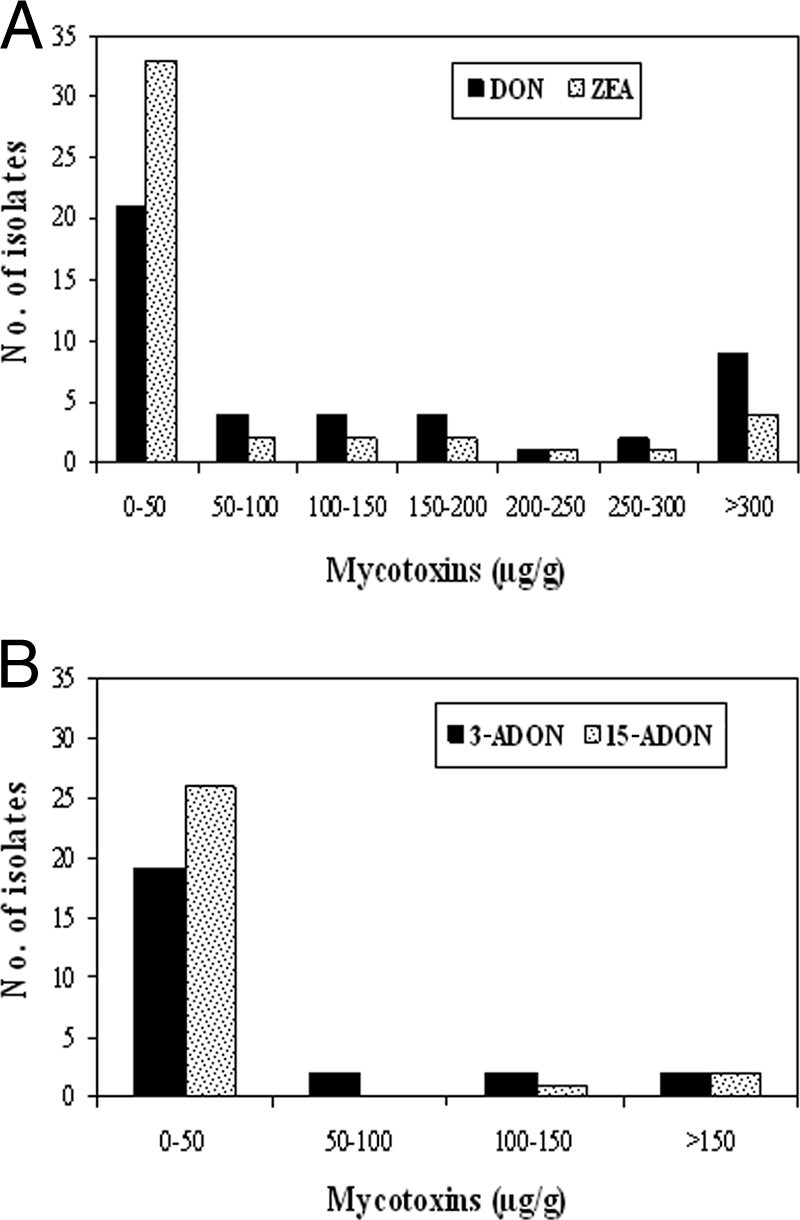
Range in levels of mycotoxin production by 45 isolates of G. zeae grown in rice grain culture medium. (A) DON and ZEA production; (B) 3-ADON and 15-ADON production.
The isolate Fgw115 from the wheat cultivar Glenn produced the largest amount of 3-ADON (236 μg/g), followed by the isolate Fgp24 from potatoes (189 μg/g). All 3-ADON producers from sugar beets yielded high 3-ADON levels ranging from 59 to 120 μg/g. Two isolates from wheat, Fgw190 from cultivar Norpro and Fgw79 from cultivar Dapps, produced the highest levels of 15-ADON, 322 and 266 μg/g, respectively. Except for one isolate (Fgp21) from potatoes, all isolates from barley, potatoes, and sugar beets produced relatively low levels of 15-ADON.
DISCUSSION
The DNA sequencing of representative isolates of G. zeae from barley, wheat, potatoes, and sugar beets revealed previously that these isolates belong to clade 7 of G. zeae (5). A high rate of gene flow among populations of G. zeae was observed based on variable-number tandem-repeat markers (5). The assay of a subset of the 21 G. zeae isolates from susceptible wheat cultivars for mycotoxin production confirmed that these isolates are capable of producing significant amounts of DON (6). All isolates of G. zeae analyzed using TRI-based genetic markers verified by chemical analyses in the present study had the DON marker, and none of the isolates had the NIV marker, supporting the hypothesis that isolates from the four crops had a nonfunctional pseudogene (ψTRI13) (8). In addition, isolates associated with the 3-ADON and 15-ADON markers were detected in samples from potatoes and sugar beets and were similar to the isolates observed in samples from wheat. This is the first report indicating the existence of G. zeae isolates with the DON marker in potatoes and sugar beets in the Midwestern United States.
Among isolates with the DON marker, isolates with the 15-ADON marker were predominant in both the cereal and noncereal crops examined. In previous studies, isolates with the 15-ADON marker were found mainly in wheat in the United States (13), Europe (17), and China (18). We found that the frequencies of isolates with the 3-ADON marker among isolates from potatoes and sugar beets were nearly twofold lower than the frequency among isolates from wheat. Intriguingly, isolates with the 3-ADON marker were not detected in samples from barley in this study. One possible explanation is that the strains of G. zeae from barley were collected from a single site at Fargo, which is far from the major barley-growing areas, and this restricted geographic sampling may have affected results, although the site is within a wheat-growing area and is exposed to wheat populations of the fungus. Further collection of isolates from Fargo and other major barley-producing areas in North Dakota is needed to elucidate the spatial influence on trichothecene production by G. zeae in barley.
Our results indicated that the occurrence of isolates with the 3-ADON marker varied with the sampling site. For example, isolates with the 3-ADON marker were present at a higher level at Langdon than at Carrington and Minot. Langdon, located in northeast North Dakota, has a unique environment within North Dakota. Of all 73 weather stations within North Dakota consistently reporting weather data, Langdon had the coldest yearly average temperature over 30 years (37). For June and July, two months favoring G. zeae inoculum production and infection, Langdon had 2.0°C-lower temperatures than Minot or Carrington. June and July precipitation levels at Langdon, Minot, and Carrington are about equal, but colder temperatures during this period at Langdon may result in higher relative humidity and higher dew points. For example, in 1993, the year of the most severe epidemic of FHB in North Dakota (25), wheat in the Langdon area suffered with severe FHB infection. Temperatures during June and July at Langdon that year averaged even 2.7°C lower than the already low long-term averages for that location (25). Several researchers (18, 19, 38) have reported that isolates with the 3-ADON marker are dominant in warm regions and that isolates with the 15-ADON marker are found mainly in cool regions. The occurrence of different trichothecene-producing isolates of G. zeae reported here and in previous studies (2, 7, 18, 22, 34) may be due to the relatively wide range of environmental conditions under which the host crops are grown. In particular, temperature and precipitation (11, 14) and substrate composition (31) were reported previously to be major factors influencing trichothecene production by G. zeae. We hypothesize that the uniqueness of the environment may play an important role in the trichothecene diversity in G. zeae populations in the region. Confirmation would require epidemiological studies.
Another hypothesis for the increasing frequency of isolates with the 3-ADON marker is the possible migration of such isolates into North Dakota from Manitoba, Canada. Recent findings revealed that the frequency of isolates with the 3-ADON marker increased 14-fold more than the frequency of isolates with the 15-ADON marker in western Canada between 1998 and 2004 (39). In this study, we detected a nearly fourfold increase in the frequency of isolates with the 3-ADON marker in wheat samples compared to the frequencies in previous G. zeae populations collected from wheat in the same region during 1999 and 2000 (13). However, the cause of this increased frequency of isolates with the 3-ADON marker is unknown. Geographically, all three sampling sites are near the Canadian border; the distance is approximately 25 km for Langdon, 90 km for Minot, and 180 km for Carrington. These data further support the hypothesis that climactic differences among sampling sites may have an impact on trichothecene production by G. zeae.
An additional hypothesis is that the variation in trichothecene production may be due to allelic polymorphism in the trichothecene biosynthesis gene cluster (30, 38) as a result of selection pressure from environments (38) and changes in protein function (20). Collectively, these mechanisms may cause significant variation within the TRI gene cluster of G. zeae and may have an impact on the evolution of the different trichothecene-producing isolates of G. zeae (27, 38). In our study, the diversity in trichothecene-specific markers observed in G. zeae isolates may be related to these mechanisms.
Our results showed no significant difference in the frequencies of isolates with the 3-ADON marker and isolates with the 15-ADON marker between the resistant and susceptible wheat cultivar groups. The majority of the wheat cultivars moderately resistant to FHB possess minor genes or quantitative trait loci (26). We hypothesize that FHB resistance genes or quantitative trait loci may have little or no influence on variation between isolates with the 3-ADON marker and isolates with the 15-ADON marker in North Dakota. Our results are in agreement with those of a previous study (15) that also did not find a significant difference in the frequencies of isolates with the 3-ADON and 15-ADON markers between isolates from a moderately susceptible cultivar (Superb) and those from an intermediately resistant cultivar (AC Barrie) in Canada. Although isolates with the 15-ADON marker from four cultivars (Briggs, Glenn, Knudson, and Steele-ND) were dominant at all sites studied, the cause of the occurrence of isolates with the 15-ADON marker is unknown.
The type and quantity of mycotoxin produced by G. zeae isolates in rice cultures varied considerably. The majority of the isolates from potatoes and sugar beets produced DON (3-ADON or 15-ADON) and ZEA at levels similar to those produced by the isolates from barley and wheat. The isolates producing large amounts of DON also produced large amounts of ZEA and 3-ADON or 15-ADON. We hypothesize that this relationship may be due to common regulatory or metabolic responses in which specific isolates produce these mycotoxins. Further investigation is necessary to reveal the actual cause for this relationship. Small amounts of b-ZEA were produced mainly by wheat isolates. DON, 3-ADON, and 15-ADON production in rice cultures was higher than that in samples from the susceptible wheat cultivars (6). Although a significant amount of ZEA was produced in rice cultures in this study, ZEA was not detected in samples from the susceptible wheat cultivars (6). A possible explanation is that the environments and substrates used for these two tests were completely different and, more importantly, that mycotoxins produced by the fungus in rice cultures often may not mimic those produced in host plant tissue (23).
Our data further indicated that there was a perfect correlation between TRI-based PCR-determined genotypes and chemical analysis results for DON, 3-ADON, and 15-DON production among 45 representative isolates of G. zeae from the four crops examined. For the detection of chemically confirmed DON and NIV producers, the three TRI-based PCR assays (Table 1) used in this study were reliable and confirmed that only isolates with the DON marker were present in this target fungal population.
In conclusion, the main goal of this study was to determine mycotoxin profiles of G. zeae populations from barley, wheat, potatoes, and sugar beets. TRI-based genetic marker assays detected isolates with the DON, 3-ADON, and 15-ADON markers from the four crops. Sampling sites had an influence on the distribution of isolates with the 3-ADON and 15-ADON markers in wheat, while the FHB-resistant cultivars had little or no influence on the distribution of isolates with these markers in North Dakota. Chemical analysis by GC-MS confirmed that these isolates produced detectable amounts of DON, 3-ADON, 15-ADON, and ZEA. In particular, G. zeae is an emerging pathogen for potatoes and sugar beets, and mycotoxin contamination may be a threat to potato and sugar beet industries in the United States. These findings may be useful for monitoring mycotoxin contamination and for the screening of trichothecene-resistant cultivars of both cereal and noncereal crops.
Acknowledgments
We thank the research staff at the Veterinary Diagnostic Laboratory, NDSU, Fargo, for their technical support in evaluating mycotoxins in rice cultures. We thank Viviana V. Rivera, Rolando Estrada, and Pragyan Burlakoti for their technical assistance and Mohamed Khan for providing information on sugar beet production. We thank Richard Horsley for his valuable suggestions in data analysis and Dwain Meyer for editing the manuscript.
R.R.B. was supported in part by an NDSU graduate school fellowship. This work was funded partly by the NDSU Agricultural Experiment Station and a cooperative project with the U.S. Wheat and Barley Scab Initiative (USWBSI) of the U.S. Department of Agriculture under agreement no. 59-0790-5-076.
Any opinions, findings, conclusions, or recommendations expressed in this publication are those of the authors and do not necessarily reflect the views of the U.S. Department of Agriculture.
Footnotes
Published ahead of print on 12 September 2008.
REFERENCES
- 1.Ali, S., V. V. Rivera, and G. A. Secor. 2005. First report of Fusarium graminearum causing dry rot of potato in North Dakota. Plant Dis. 89:105. [DOI] [PubMed] [Google Scholar]
- 2.Blaney, B. J., and R. L. Dodman. 2002. Production of zearalenone, deoxynivalenol, nivalenol, and acetylated derivatives by Australian isolates of Fusarium graminearum and F. pseudograminearum in relation to source and culturing conditions. Aust. J. Agric. Res. 53:1317-1326. [Google Scholar]
- 3.Bosch, U., and C. J. Mirocha. 1992. Toxin production by Fusarium species from sugar beets and natural occurrence of zearlenone in beets and beet fibers. Appl. Environ. Microbiol. 58:3233-3239. [DOI] [PMC free article] [PubMed] [Google Scholar]
- 4.Brown, D. W., S. P. McCormick, N. J. Alexander, R. H. Proctor, and A. E. Desjardins. 2001. A genetic and biochemical approach to study trichothecene diversity in Fusarium sporotrichoides and Fusarium graminearum. Fungal Genet. Biol. 32:121-133. [DOI] [PubMed] [Google Scholar]
- 5.Burlakoti, R. R., S. Ali, G. A. Secor, S. M. Neate, M. P. McMullen, and T. B. Adhikari. 2008. Genetic relationships among populations of Gibberella zeae from barley, wheat, potato and sugar beet in the upper Midwest of the United States. Phytopathology 98:969-976. [DOI] [PubMed] [Google Scholar]
- 6.Burlakoti, R. R., R. Estrada, Jr., V. V. Rivera, A. Boddeda, G. A. Secor, and T. B. Adhikari. 2007. Real-time PCR quantification and mycotoxin production of Fusarium graminearum in wheat inoculated with isolates collected from potato, sugar beet and wheat. Phytopathology 97:835-841. [DOI] [PubMed] [Google Scholar]
- 7.Chandler, E. A., D. R. Simpson, M. A. Thomsett, and P. Nicholson. 2003. Development of PCR assays to Tri7 and Tri13 trichothecene biosynthetic genes and characterization of chemotypes of Fusarium graminearum, Fusarium culmorum and Fusarium cerealis. Physiol. Mol. Plant Pathol. 62:357-367. [Google Scholar]
- 8.Desjardins, A. E. 2006. Fusarium mycotoxins: chemistry, genetics and biology. American Phytopathological Society Press, St. Paul, MN.
- 9.Desjardins, A. E., T. M. Hohn, and S. McCormick. 1992. Effect of gene disruption of trichodiene synthase on the virulence of Gibberella pulicaris. Mol. Plant-Microbe Interact. 5:214-222. [DOI] [PubMed] [Google Scholar]
- 10.Desjardins, A. E., and R. D. Plattner. 2003. Diverse traits for pathogen fitness in Gibberella zeae. Can. J. Plant Pathol. 25:21-27. [Google Scholar]
- 11.De Wolf, E. D., L. V. Madden, and P. E. Lipps. 2003. Risk assessment models for wheat Fusarium head blight epidemics based on within-season weather data. Phytopathology 93:428-435. [DOI] [PubMed] [Google Scholar]
- 12.Estrada, Jr., R., V. V. Rivera, and G. A. Secor. 2006. Pathogenicity of Fusarium graminearum to potato, sugar beet and wheat. Phytopathology 97(Suppl.):S160. [DOI] [PubMed] [Google Scholar]
- 13.Gale, L. R., T. J. Ward, V. Balmas, and H. C. Kistler. 2007. Population subdivision of Fusarium graminearum sensu stricto in the upper midwestern United States. Phytopathology 97:1434-1439. [DOI] [PubMed] [Google Scholar]
- 14.Grennhalgh, R., G. A. Neish, and J. D. Miller. 1983. Deoxynivalenol, acetyl deoxynivalenol, and zearalenone formation by Canadian isolates of Fusarium graminearum on solid substrates. Appl. Environ. Microbiol. 46:625-629. [DOI] [PMC free article] [PubMed] [Google Scholar]
- 15.Guo, X. W., W. G. D. Fernando, and H. Y. Seow-Brock. 2008. Population structure, chemotype diversity, and potential chemotype shifting of Fusarium graminearum in wheat fields of Manitoba. Plant Dis. 92:756-762. [DOI] [PubMed] [Google Scholar]
- 16.Hanson, L. E. 2006. Fusarium yellowing of sugar beet caused by Fusarium graminearum from Minnesota and Wyoming. Plant Dis. 90:686. [DOI] [PubMed] [Google Scholar]
- 17.Jennings, P., M. Coates, J. A. Turner, and P. Nicholson. 2003. Distribution of deoxynivalenol/nivalenol producing isolates of Fusarium culmorum and F. graminearum in England and Wales. Aspects Appl. Biol. 68:43-48. [Google Scholar]
- 18.Ji, K., L. Cao, T. Hu, and S. Wang. 2007. Determination of deoxynivalenol and nivalenol chemotypes of Fusrium graminearum isolates from China by PCR assay. J. Phytopathol. 155:505-512. [Google Scholar]
- 19.Kimura, M., T. Tokai, K. O'Donnell, T. J. Ward, M. Fujimura, H. Hamamoto, T. Shibata, and I. Yamaguchi. 2003. The trichothecene biosynthesis gene cluster of Fusarium graminearum F15 contains a limited number of essential pathway genes and expressed non-essential genes. FEBS Lett. 539:105-110. [DOI] [PubMed] [Google Scholar]
- 20.Knudesen, B., and M. M. Miyamoto. 2001. A likelihood ratio test for evolutionary ratio shifts and functional divergence among protein. Proc. Natl. Acad. Sci. USA 98:14512-14517. [DOI] [PMC free article] [PubMed] [Google Scholar]
- 21.Lee, T., Y. K. Han, K. H. Kim, S. H. Yun, and Y. W. Lee. 2002. Tri13 and Tri7 determine deoxynivalenol- and nivalenol-producing chemotypes of Gibberella zeae. Appl. Environ. Microbiol. 68:2148-2154. [DOI] [PMC free article] [PubMed] [Google Scholar]
- 22.Llorens, A., M. J. Hinojo, R. Mateo, M. T. Gonzáléz-Jaen, F. M. Valle-Algarra, A. Logrieco, and M. Jiménez. 2006. Characterization of Fusarium spp. isolates by PCR-RFLP analysis of the intergenic spacer region of the rRNA gene (rDNA). Int. J. Food Microbiol. 106:297-306. [DOI] [PubMed] [Google Scholar]
- 23.McCormick, S. P. 2003. The role of DON in pathogenicity, p. 165-183. In K. Leonard and W. Bushnell, (ed.), Fusarium head blight of wheat and barley. American Phytopathological Society Press, St. Paul, MN.
- 24.McMullen, M. P., R. Jones, and D. Gallenberg. 1997. Scab of wheat and barley: a re-emerging disease of devastating impact. Plant Dis. 81:340-1348. [DOI] [PubMed] [Google Scholar]
- 25.McMullen, M. P., J. Enz, J. Lukach, and R. Stover. 1997. Environmental conditions associated with Fusarium head blight epidemics of wheat and barley in the Northern Great Plains, North America. Cereal Res. Commun. 25:777-778. [Google Scholar]
- 26.Mergoum, M., R. C. Frohberg, and R. W. Stack. 2007. Breeding hard red spring wheat for Fusarium head blight resistance: successes and challenges, p. 161-167. In H. T. Buck, J. E. Nisi, and N. Salomón (ed.), Wheat production in stressed environments. Proceedings of the 7th International Wheat Conference, 27 November to 2 December 2005, Mar del Plata, Argentina.
- 27.Mesterhazy, A., T. Bartok, C. G. Mirocha, and R. Komoroczy. 1999. Nature of wheat resistance to Fusarium head blight and the role of deoxynivalenol for breeding. Plant Breed. 118:97-110. [Google Scholar]
- 28.Miller, J. D., R. Greenhalgh, Y. Z. Wang, and M. Lu. 1991. Trichothecene chemotypes of three Fusarium species. Mycologia 83:121-130. [Google Scholar]
- 29.Mirocha, C. J., H. K. Abbas, C. E. Windels, and W. Xie. 1989. Variation in deoxynivalenol, 15-acetyl-deoxynivalenol, 3-acetyl-deoxynivalenol, and zeralenone production by Fusarium graminearum isolates. Appl. Environ. Microbiol. 55:1315-1316. [DOI] [PMC free article] [PubMed] [Google Scholar]
- 30.O'Donnell, K., H. C. Kistler, B. K. Tacke, and H. H. Casper. 2000. Gene genealogies reveal global phylogeographic structure and reproductive isolation among lineages of Fusarium graminearum, the fungus causing wheat scab. Proc. Natl. Acad. Sci. USA 97:7905-7910. [DOI] [PMC free article] [PubMed] [Google Scholar]
- 31.O'Neill, K., A. P. Damoglou, and M. F. Patterson. 1993. Toxin production by Fusarium culmorum IMI 309344 and F. graminearum NRRL 5883 on grain substrates. J. Appl. Bacteriol. 74:625-628. [DOI] [PubMed] [Google Scholar]
- 32.Parry, D. W., P. Jenkinson, and L. McLeod. 1995. Fusarium ear blight (scab) in small grain cereals: a review. Plant Pathol. 44:207-238. [Google Scholar]
- 33.Rocha, O., K. Ansari, and F. M. Doohan. 2005. Effect of trichothecene mycotoxins on eukaryotic cells: a review. Food Addit. Contam. 22:369-378. [DOI] [PubMed] [Google Scholar]
- 34.Scézsi, A., and T. Bartók. 1995. Trichothecene chemotypes of Fusarium graminearum from corn in Hungary. Mycotoxin Res. 11:85-92. [DOI] [PubMed] [Google Scholar]
- 35.Starkey, D. E., T. J. Ward, T. Aoki, L. R. Gale, H. C. Kistler, D. M. Geiser, H. Suga, B. Toth, J. Varga, and K. O'Donnell. 2007. Global molecular surveillance reveals novel Fusarium head blight species and trichothecene toxin diversity. Fungal Genet. Biol. 44:1191-1204. [DOI] [PubMed] [Google Scholar]
- 36.USDA National Agricultural Statistics Service. 2007. North Dakota 2007 wheat varieties, June 2007 report. USDA National Agricultural Statistics Service, North Dakota Field Office, Fargo, ND.
- 37.USDA National Agricultural Statistics Service. 2007. North Dakota agricultural statistics report no. 76, June 2007. USDA National Agricultural Statistics Service, North Dakota Field Office, Fargo, ND.
- 38.Ward, T. J., J. P. Bielawski, H. C. Kistler, E. Sullivan, and K. O'Donnell. 2002. Ancestral polymorphism and adaptive evolution in the trichothecene mycotoxin gene cluster of phytopathogenic Fusarium. Proc. Natl. Acad. Sci. USA 99:9278-9283. [DOI] [PMC free article] [PubMed] [Google Scholar]
- 39.Ward, T. J., R. M. Clear, A. P. Rooney, K. O'Donnell, D. Gaba, S. Patrick, D. E. Starkey, J. Gilbert, D. M. Geiser, and T. W. Nowicki. 2008. An adoptive evolutionary shift in Fusarium head blight pathogen populations in driving the rapid spread of more toxigenic Fusarium graminearum in North America. Fungal Genet. Biol. 45:473-484. [DOI] [PubMed] [Google Scholar]
- 40.Windels, C. E. 2000. Economic and social impacts of Fusarium head blight: changing farms and rural communities in the Northern Great Plains. Phytopathology 90:17-21. [DOI] [PubMed] [Google Scholar]