Abstract
Objective
This paper describes improvements and updates to an established approach to making epidemiological estimates of HIV prevalence in countries with low level and concentrated epidemics.
Methods
The structure of the software used to make estimates is briefly described, with particular attention to changes and improvements.
Discussion
The approach focuses on identifying populations which, through their behaviour, are at high risk of infection with HIV or who are exposed through the risk behaviour of their sexual partners. Estimates of size and HIV prevalence of these populations allow the total number of HIV infected people in a country or region to be estimated. Major changes in the software focus on the move away from short term projections and towards developing an epidemiological curve that more accurately represents the change in prevalence of HIV over time. The software continues to provide an output file for use in the Spectrum software so as to estimate the demographic impact of HIV infection at country level.
Keywords: concentrated epidemics, HIV surveillance, high risk populations, methods, prevalence
The Workbook approach to making estimates and short term projections of HIV/AIDS prevalence has been developed and proposed for use in countries with low level and concentrated epidemics since 2001.1,2 Unlike in countries where the epidemic is generalised and HIV surveillance among pregnant women attending antenatal clinics is used as a proxy for prevalence in the general adult population3 there is no standard set of representative data that can be used to estimate adult prevalence in these countries. Instead the approach has been to develop estimates for populations which are most exposed to HIV and then combined to produce an overall estimate of adult prevalence in a country.
The estimation and projections workbook is part of a set of methods that the Joint United Nations Programme on HIV/AIDS (UNAIDS) and the World Health Organization (WHO), with support from the UNAIDS Reference Group on Estimates, Modelling and Projections, has developed.4 National AIDS programmes in countries around the world have used these methods and tools for making estimates and developing scenarios of HIV prevalence levels in countries1,5 and for estimating the demographic impact of HIV/AIDS in countries.6
In concentrated epidemics, HIV has spread rapidly in a defined subpopulation, but is not well established in the general population.7 This epidemic state suggests active networks of high risk behaviour within the subpopulation. The future course of the epidemic is determined by the frequency and nature of links between highly infected subpopulations and the general population. In low level epidemics, levels of HIV prevalence are even lower with a numerical proxy of HIV prevalence not having consistently exceeded 5% in any defined subpopulation.7 For countries with an epidemic level that is neither clearly generalised nor clearly concentrated, both methods developed for concentrated epidemics (the Workbook)1 or generalised epidemics (the Estimation and Projection Package (EPP))5 can be applied.
An early version of the projection component of this software was used to produce regional projections of HIV prevalence. In 2005, the software underwent revisions and changes, based on recommendations by experts and on the experience of implementing this approach in many countries, to improve the process and ease of use. This paper describes those changes and improvements.
Description of the software
Currently, the software exists as an Excel file with several spreadsheets and is available in English, French, Spanish, Russian, and Chinese. In this single Excel file both point prevalence estimates and a curve fitting historical prevalence estimates can be produced. The workbook and supporting documentation, including manuals, are available from the websites of several organisations, including UNAIDS (http://www.unaids.org), WHO (http://www.who.int), and the Futures Group International (http://www.FuturesGroup.com). Specifics of using the software have been documented elsewhere1 and can also be found in the manuals available from the websites listed above.
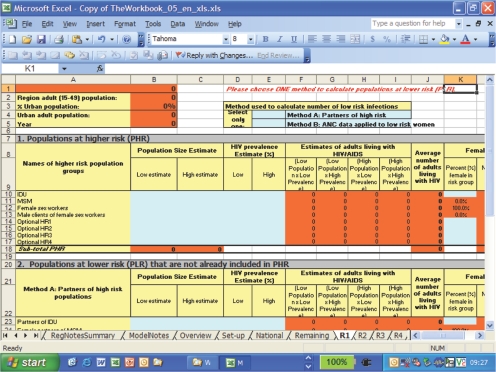
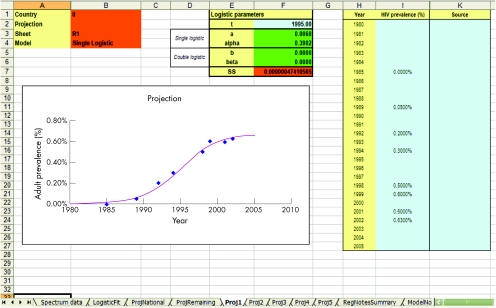
Briefly, the Workbook approach focuses on identifying populations who are at high risk of infection through their own or their sexual partners' risk behaviour.1 It consists of two parts: firstly, those groups or populations who are most exposed to HIV (for example, men who have sex with men (MSM), injecting drug users, sex workers, and clients of sex workers) have to be defined in terms of population size and HIV prevalence for predefined geographical regions, as illustrated in figure 1. For each of these regions, an approach must also be selected to estimate prevalence in the population at lower exposure to HIV; either using data on sexual partners of those most exposed to HIV, or using data on women attending antenatal clinics. The total estimate of prevalence for a specific region will then be the sum of the number of people living with HIV in populations at higher and lower levels of exposure. The national point prevalence will automatically be calculated in the Workbook as the sum of the number of people living with HIV across all regions. The second part of the software consists of obtaining the point prevalence, nationally as well as by region, for a number of previous years in order to fit an epidemic curve to the prevalence data (fig 2). The epidemic curve can finally be read into the Spectrum software from which demographic projections of the impact of the HIV epidemic can be made.6
Figure 1 Workbook region 1 sheet showing empty cells for both population sizes and HIV prevalence estimates by populations commonly used in prevalence estimation in concentrated epidemics.
Figure 2 Workbook projection sheet showing columns for input of historical HIV prevalence values and parameter estimates used in fitting an epidemic curve to those prevalence values.
Updates to the software
There are two types of changes in this version of the Workbook software—cosmetic and theoretical. Past versions of the software existed as two separate Excel spreadsheet files, namely the point prevalence workbook and the projection scenarios workbook. This version has merged the two separate spreadsheets and they now appear in the same file. Users of the spreadsheet are now encouraged to begin with the “SET‐UP” sheet, which allows the user to define regions, population sizes, and the proportion of the population that reside in urban areas, as well as to establish additional high risk groups, should the local epidemic require it. Regional data input on this sheet in Workbook are then automatically inserted into the corresponding regional spreadsheets. Space for documenting decisions is now available on each individual regional spreadsheet as well as on a single spreadsheet labeled “notes”. The location for choosing the method for estimating the number of infections among low risk populations has been moved to a more central part of the regional spreadsheets. Some columns of multiplicative results (high population size × low HIV prevalence, low population size × high HIV prevalence) have been hidden to minimise confusion, while some per cent female values have been set to a default value (zero for per cent MSM who are female, 100% for female sex workers) (fig 1).
Theoretical changes
Few changes have been made to the point prevalence part of the workbook while most of the important theoretical changes have occurred in the projections component of Workbook. In the past, national estimates of HIV prevalence over time were smoothed by fitting an epidemic curve to all previous yearly estimates as well as future projected prevalence points.1 The projection workbook applied a curve fitter to national prevalence data using the same four‐parameter model as the one used in the EPP for generalised epidemics.5
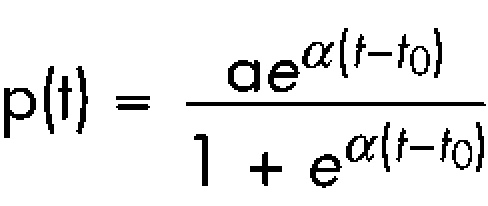
In the new version of Workbook, an epidemic curve is fitted to the historical prevalence (which is also the principle of generalised epidemics) (fig 2) data using either a single or double logistic function, and does not project past the last year of data. The use of the single or double logistic function allows the user to define increasing, stabilising, or declining epidemic trends more accurately than before. For epidemics showing increasing or stabilising prevalence we recommend fitting a single logistic function8 to the data, of the form
 |
where a represents the asymptote, or the level at which the epidemic is expected to level off, α represents the rate of increase at the start of the epidemic, and t0 represents the time at which the epidemic reaches half its asymptotic value.
For epidemics where there is evidence of a decline in prevalence, we recommend that the prevalence at time t is fitted to a double logistic function of the form
 |
where α is the rate of increase at the start of the epidemic, and where prevalence converges at some rate β, to some asymptote b⩾0.9,10
Although the logistic functions can project the epidemic into the future, it is recommended that an epidemic curve is fitted to historical data only. By fitting this curve, it still provides an output for the Spectrum software,6 from which estimations of the impact of HIV, in terms of the number of people living with HIV, mortality, incidence, and limited future projections can be made.
Strengths
The strengths of the Workbook method have been documented elsewhere.1 Briefly, these include the transparency in the process of making estimates, the automatic consistency and audit check to help eliminate errors, the use of regional spreadsheets to make estimates of different regions in a country, the emphasis on ranges for the estimates rather than a single point estimate, the review and analysis of behavioural and serological data needed to understand the epidemic, and finally the possibility of adapting the spreadsheet to fit specific country needs. The software has the further advantage that it can help identify those population groups at highest risk of HIV infection and hence assist countries in targeting prevention efforts. Changes in the model used to estimate the epidemic trend in a country have enhanced this method by producing a more reliable curve of the epidemic, which in turn leads to more accurate estimates of the demographic impact of the epidemic.
Weaknesses and limitations
As in the past, the primary weaknesses of this spreadsheet method relate to the quality of the data used when making the estimate. Data among high risk groups remain limited and identifying groups at high risk of infection is often difficult because of both stigma associated with and laws prohibiting certain behaviours in some countries. The size of high risk populations continues to be difficult to quantify, and matching high risk population sizes to HIV prevalence in those populations continues to be problematic. Clients of sex workers continue to be particularly difficult to quantify, although many countries have developed simple methods based on informed assumptions. These assumptions are normally documented so that the final estimate can be justified to end users of the prevalence estimates.
Conclusions
The Workbook approach continues to build on the process of identifying groups at high risk of becoming infected with HIV, estimating the size and the HIV prevalence of those groups, and combining the groups to obtain a national estimate of adult HIV prevalence in countries with concentrated or low level epidemics. The changes to the 2005 Workbook method have made it easier to use, and it has also incorporated a more appropriate curve fitting procedure to model prevalence trend data. Sufficient attention is given to the need for documenting decisions within the Workbook pages.
The Workbook is a method that is easily used, and in many ways standardises the approach to measuring HIV/AIDS surveillance in many countries with concentrated or low level HIV epidemics around the world. This standardisation allows for a global disease burden to be calculated, and in turn, this disease burden informs governments and non‐governmental organisations in determining focus, intervention strategies, and treatment delivery.
Although the Workbook promotes a consistent set of methods to be used in countries and hence produces comparable estimates, one of the main obstacles in obtaining more accurate estimates of HIV infection in countries with low level or concentrated epidemics is the lack of reliable data, and ways should be found to improve data quality and surveillance among high risk groups.
Authors' contributions
All authors contributed to the conceptualisation and writing of the paper. E Gouws was responsible for the theoretical update to the Workbook methodology, E Zaniewski was responsible for the cosmetic update to the Workbook.
Abbreviations
EPP - Estimation and Projection Package
MSM - men who have sex with men
UNAIDS - Joint United Nations Programme on HIV/AIDS
WHO - World Health Organization
References
- 1.Walker N, Stover J, Stanecki K.et al The workbook approach to making estimates and projecting future scenarios of HIV/AIDS in countries with low level and concentrated epidemics. Sex Transm Infect 200480(Suppl 1)i10–i13. [DOI] [PMC free article] [PubMed] [Google Scholar]
- 2.Ramon J S, Alvarenga M, Walker N.et al Estimating HIV/AIDS prevalence in countries with low‐level and concentrated epidemics: the example of Honduras. AIDS 200216(Suppl 3)S18–S22. [DOI] [PubMed] [Google Scholar]
- 3.UNAIDS/WHO Working Group on Global HIV/AIDS and STI Surveillance Guidelines for conducting HIV sentinel serosurveys among pregnant women and other groups. Geneva, Switzerland: WHO, UNAIDS, CDC, 2003
- 4.UNAIDS Reference Group on Estimates, Modelling and Projections Improved methods and assumptions for estimation of the HIV/AIDS epidemic and its impact: Recommendations of the UNAIDS Reference Group on Estimates, Modelling and Projections. AIDS 200216W1–W14. [DOI] [PubMed] [Google Scholar]
- 5.Ghys P D, Brown T, Grassly N C.et al The UNAIDS Estimation and Projection Package: a software package to estimate and project national HIV epidemics. Sex Transm Infect 200480(Suppl 1)i5–i9. [DOI] [PMC free article] [PubMed] [Google Scholar]
- 6.Stover J. Projecting the demographic consequences of adult HIV prevalence trends: the Spectrum Projection Package Sex Transm Infect 200480(Suppl 1)i14–i18. [DOI] [PMC free article] [PubMed] [Google Scholar]
- 7.UNAIDS/WHO Working Group on Global HIV/AIDS and STI surveillance Guidelines for Second Generation HIV Surveillance: the next decade. Geneva, Switzerland, WHO/CDS/EDC/2000. 05 2005
- 8.Lindsey J K.Introductory statistics: a modelling approach. Oxford: Clarendon Press, 1995
- 9.Currie C S, Williams B G, Cheng R C.et al Tuberculosis epidemics driven by HIV: is prevention better than cure? AIDS 2003172501–2508. [DOI] [PubMed] [Google Scholar]
- 10.Korenromp E L, Williams B G, de Vlas S J.et al Malaria attributable to the HIV‐1 epidemic, sub‐Saharan Africa. Emerg Infect Dis 2005111410–1419. [DOI] [PMC free article] [PubMed] [Google Scholar]


