

Abstract
Staphylococcus aureus, a primary source of bacterial superantigen (SAg), is known to colonize the human respiratory tract and has been implicated in airway inflammation. Studies have documented a role for SAgs in respiratory disorders, such as nasal polyps, chronic obstructive pulmonary disease, chronic rhinosinusitis, and asthma. However, cellular and molecular mediators involved in SAg-mediated pulmonary disease have not been clearly identified. In this study, we investigated the effect of intranasal staphylococcal enterotoxin A (SEA) exposure on murine lung. The pathological features in the lung resulting from SEA exposure had characteristics of both obstructive and restrictive pulmonary disorders. There was also an increase in bronchoalveolar lavage protein concentration and cellularity following SEA challenge. Massive CD8+Vβ3+ T cell accumulation observed in the lung was dependent on CD4 T cell help, both for recruitment and for IFN-γ synthesis. The primary source of IFN-γ synthesis was CD8 T cells, and depletion of these cells abrogated disease. IFN-γ deficiency also prevented SEA-mediated disease, and this was by enhancing early recruitment of neutrophils as detected in the bronchoalveolar lavage. Thus, IFN-γ appeared to selectively aid the recruitment of T cells to the lungs while preventing the neutrophil accumulation. Therefore, our results show that IFN-γ-producing CD8 T cells mediated pulmonary alveolitis and inflammation, which were dependent upon CD4 T cells for their recruitment to the lung.
Superantigens (SAgs)3 are toxins that are produced by different varieties of bacteria, viruses, parasites, and even some fungi. These microbial toxins are capable of initiating a massive immune response by stimulating T cells bearing specific TCR Vβ chains (1). Unlike conventional Ags, SAgs do not require processing and presentation by APCs (2). Instead, they directly cross-link specific Vβ regions on the TCR with the MHC II molecule on the APC. This results in the activation of large numbers of CD4 and CD8 T cells bearing the preferred Vβ chain. The proinflammatory cytokine storm that is induced as a result of polyclonal T cell expansion causes a number of disorders in humans, a few of which include toxic shock syndrome, food poisoning, and exacerbation of autoimmune disorders (1, 3, 4).
Streptococcus and Staphylococcus aureus are Gram-positive bacteria and are the most common source of SAgs. S. aureus is known to colonize the nasopharynx and skin of human beings and several animal species (5, 6). Recent reports indicate that anterior nares of the nose could be the most frequent carrier site for S. aureus (7). As a result of these findings, there is increasing evidence of the involvement of staphylococcal enterotoxins in a number of skin disorders and respiratory tract infections (8, 9).
Psoriasis is an infection of the skin, and there is evidence of T cell involvement in its pathogenesis. This skin disorder is often preceded by throat infection, and isolates from throats of patients with psoriasis reveal the presence of SAgs (10). The role of SAgs in atopic dermatitis, another skin disorder, is even more compelling, with ∼90% of chronic skin lesions colonized by S. aureus (11). The bacteria isolated from the skin of these patients have been shown to produce SAgs. Apart from stimulating T cells, these enterotoxins have also been shown to exacerbate the skin diseases by inducing an IgE response. Basophils from patients with atopic dermatitis release histamines when stimulated with the relevant enterotoxin (5, 12).
Studies have shown enhanced staphylococcal enterotoxin A (SEA) and staphylococcal enterotoxin B (SEB) colonization in patients with severe asthma (13-15) and allergies (16, 17). In addition, elevated IgE Abs specific for SEA have been shown to correlate to the severity of asthma (13, 14). In mouse models of SEB, Herz et al. (18) demonstrated that intranasal (i.n.) administration of SEB can directly induce allergic airway disease in both BALB/c and C57BL/6 mice in a CD4+ T cell-dependent manner. After three i.n. administrations of SEB, the following classic signs of allergic airway disease were observed: increased inflammatory cells (lymphocytes, eosinophils, and neutrophils) in the bronchoalveolar lavage (BAL) fluid, histological evidence of mild perivascular and peribronchial inflammation, increased IL-4 in BAL, and enhanced airway responsiveness to methacholine challenge. Furthermore, Hellings et al. (19) demonstrated that the concomitant i.n. administration of SEB in an OVA-induced model of allergic airway disease exacerbated allergic inflammation.
In this model of SEA-induced lung injury, we have shown the development of both alveolar and airway inflammation. In a similar manner as SEB, perivascular and peribronchial inflammation was prominent in post-i.n. administration of SEA. Interestingly, in contrast to SEB, an intense interstitial alveolitis was also prominent after a single bout of SEA administration. This is suggestive that SEA may be acting in a different, perhaps more pathologic manner than SEB.
Specifically, we investigated the mechanism of i.n. SEA pathology on the murine lung. Although CD8 T cells played an important role in disease pathogenesis, CD4 T cell help was critical for CD8 T cell recruitment and IFN-γ synthesis. IFN-γ deficiency abrogated disease and facilitated early recruitment of neutrophils to the lungs. Thus, we identified cellular, CD8 T cells, and molecular, IFN-γ, immune components responsible for SEA-mediated pulmonary disease.
Materials and Methods
Mice, reagents, and in vivo treatments
C57BL/6 mice were purchased from Charles River Laboratories and the National Cancer Institute. TCRβδ−/− mice were a gift from T. Rajan (University of Connecticut Health Center, Farmington, CT). IFN-γ−/− mice were purchased from The Jackson Laboratory. All mice were maintained in the Central Animal Facility at the University of Connecticut Health Center in accordance with federal guidelines.
SEA was purchased from Toxin Technology. For all data in this study, mice received 1 μg of SEA diluted in balanced salt solution (BSS) through the i.n. route. Intranasal challenge involved anesthetizing mice with isoflurane (Vedco) in a vaporizing chamber (Vaporizer Sales and Service). After anesthetization, indicated dose of SEA diluted in 50 μl of BSS, or plain BSS, was pipetted on the nostrils of mice, and this volume was inhaled instantly.
For CD4 T cell depletion in vivo, C57BL/6 mice were treated with 200 μg of purified anti-mouse CD4 (YTS 191.1.2) mAb (Cedarlane Laboratories) on 6 and 2 days before SEA challenge. Similarly, for in vivo CD8 depletion, C57BL/6 mice were treated with 200 μg of purified anti-mouse CD8 (YTS 169AG 101HL) mAb (Cedarlane Laboratories) on 6 and 2 days before SEA challenge. This technique induced near-complete depletion of the CD4 and CD8 T cells as determined by flow cytometry (typically 2% of CD8 and CD4 T cells remain after depletion).
CD8 allophycocyanin (53−6.7), CD4 allophycocyanin (GK1.5), and CD11a FITC (M17/4) Abs were purchased from eBioscience. Vβ3PE (KJ25), Vβ6 PE (RR4−7), and CD4 PerCP (RM4−5) were purchased from BD Biosciences.
Tissue processing and cell isolation
Lung tissue was perfused, dissected, and digested in the presence of 1.3 mM EDTA. After 30 min of EDTA treatment, the tissue was incubated in collagenase (Invitrogen Life Technologies) for 1 h. Cells were then crushed through nylon mesh cell strainers (Falcon/BD Biosciences) and washed with BSS.
Spleens, peripheral lymph nodes (LNs; inguinal, axillary, and brachial), mesenteric LNs, and mediastinal LNs were homogenized into single-cell suspension by crushing them through nylon mesh cell strainers (Falcon/BD Biosciences). These were then treated with ammonium chloride to lyse RBC. Single-cell suspensions from various tissues were counted using a Z1 particle counter (Beckman Coulter).
Cell staining and flow cytometry
For flow cytometry, cells were stained with primary Abs in the presence of a blocking solution containing 5% normal mouse serum (Sigma-Aldrich), 10 μg/ml human γ-globulin (Sigma-Aldrich), and 0.1% sodium azide in culture supernatant from the 2.4.G.2 hybridoma (anti-FcR) (20). After 30 min on ice, cells were washed in wash buffer containing 3% FBS and 0.1% sodium azide in BSS. The cells were assayed on a FACSCalibur (BD Biosciences) flow cytometer, and data were analyzed using either CellQuest software (BD Biosciences) or FlowJo software (Tree Star).
For intracellular cytokine staining, 1 × 10⁶ total lung cells were cultured with 1 μg of brefeldin A (Calbiochem) in the absence or presence of 0.02 μg of SEA at 37°C for 5 h. The cells were stained with CD4− or CD8 allophycocyanin on ice for 30 min, and after washing, the cells were fixed with 2% paraformaldehyde in BSS. The cells were placed in permeabilization buffer (0.25% saponin in wash buffer) and then incubated with anti-IFN-γ (BD Pharmingen), anti-TNF (eBioscience), or an isotype control rat IgG1 (eBioscience) for 20 min at room temperature.
BAL fluid analysis
Lungs were lavaged in situ with 5 ml of physiological saline, and the BAL fluid was centrifuged. The cellular pellet was washed, and the total cells were counted using a Z1 particle counter (Beckman Coulter). Leukocyte differentials in BAL fluid were determined using cytocentrifuged slide preparations. These slides were then stained with May-Grünwald and Giemsa stains. Stained BAL slide differentials were counted, and the number of macrophages, neutrophils, lymphocytes, and eosinophils was determined. Images (×20 or ×40) of BAL slide differentials were also obtained using brightfield image settings using a Nikon Eclipse 50i microscope.
BAL protein concentration was measured in the supernatants by bicinchoninic acid (BCA) protein assay (Pierce Biotechnology), and BSA was used as the standard.
Lung histology
Noninflated lungs were fixed with 10% buffered formalin, and sections were stained with H&E. Sections from all five lobes were examined routinely for vascular, airway, and alveolar damage, including thickening of the bronchial smooth muscle layer. Images of stained lung sections (×10, ×20, or ×40) were analyzed using a Nikon Eclipse 50i microscope.
SDS-PAGE and silver nitrate staining
Protein samples from BAL fluid were frozen at —70°C. At the time of PAGE, the samples were thawed and heated at 100°C for 10 min in SDS sample buffer with excess 2-ME. Samples were resolved on 10 −20% SDS-PAGE at 150 V for 45−60 min. After electrophoresis, proteins in the gel were fixed with glutaraldehyde for 15 min and then washed repeatedly with water. They were then stained using silver nitrate solution, which contained 0.1% silver nitrate in water. After 30 min of staining, the staining was detected using a developer solution (30 μl of 37% formaldehyde and 3 g of sodium carbonate in 100 ml of water). Finally, the reaction was stopped using a stop solution (2.21 g of anhydrous citric acid in 5 ml of water). Photographs of the gel were obtained by scanning the gel (HP ScanJet Automatic Scanner).
Statistical analysis
A two-tailed Student's unpaired t test was used for data analysis, with values of p < 0.05 used as the significance threshold. All statistical analysis was performed using Microsoft Excel.
Results
Airway and alveolar injury was observed after i.n. SEA challenge
To observe whether SEA had any effect on lung pathology, we examined H&E-stained lung sections of three different groups of mice, as follows: naive C57BL/6 mice, day 2 i.n. SEA challenge, and day 5 i.n. SEA challenge (Fig. 1). Images were obtained either at ×10 or ×40 magnification. Lungs from naive untreated mice showed no or minimum signs of injury or inflammation (top panels). The lungs of the day 2 SEA-treated mice showed considerable interstitial thickening and leakage of RBCs from the blood vessels. In addition, there was prominent perivascular and peribronchial inflammation and intraluminal airway accumulation of RBCs and inflammatory cells (middle panels). These pathologic changes are consistent with both airway obstructive and alveolar restrictive disease phenotypes (21-23). However, by day 5 after SEA challenge, the lungs demonstrated signs of resolution and appeared quite normal (lower panels) except for areas of enlarged alveoli (lower left panel).
FIGURE 1.
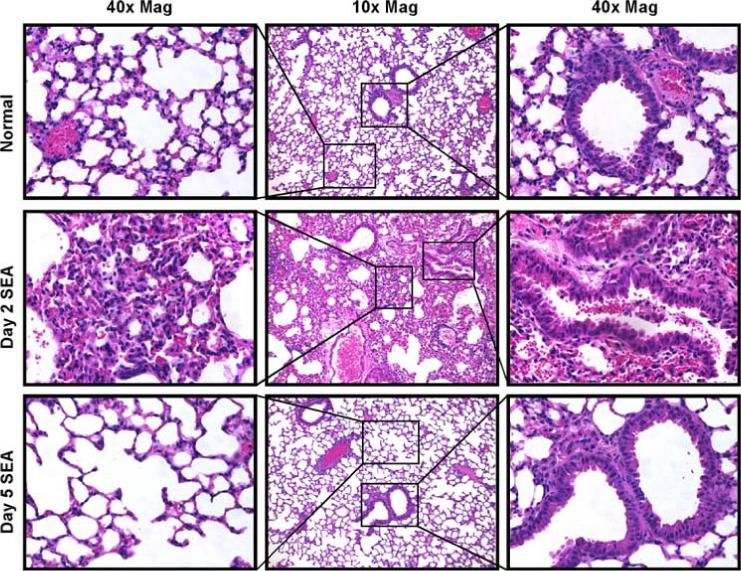
Intranasal SEA challenge induces airway and alveolar injury. For all data in this study, mice received 1 μg of SEA diluted in BSS through the i.n. route. To visualize the effects of i.n. SEA challenge, lungs from naive, day 2 and day 5 SEA-challenged mice were isolated, sectioned, and stained with H&E. Top panel, Displays representative section from lungs of normal mice. Middle panel, Representative lung section of day 2 i.n. SEA treatment. Bottom panel, Representative lung section of day 5 i.n. SEA challenge. Data are from one representative experiment of three performed (n = 3).
SEA challenge led to an increase in protein concentration and cell numbers in BAL
After examining the lung pathology, understanding the effect of SEA exposure on the BAL constituents was important, for it would give an indication of the vascular leakiness in the lung. A time kinetics study was performed, and the protein constituents in the BAL were measured on days 1, 2, 3, and 5 following SEA exposure (Fig. 2A, top panel). On day 1, there was a 7.3-fold increase in the amount of protein that was secreted in the BAL following SEA challenge over vehicle alone. The protein concentration in the BAL peaked on day 2, with SEA challenge leading to a 4.9-fold increase over vehicle alone. The protein concentration reduced by day 3 and was no different from vehicle-alone treatment on day 5. The p values were less than 0.05 on both days 1and 2, indicating that the total protein amount being secreted in BAL was significantly higher than vehicle-alone treatment. Nevertheless, it is also possible that the lavage procedure itself may have contributed to increasing the background of protein content, although our data are consistent with a similar report using Evans dye extravasation (24).
FIGURE 2.
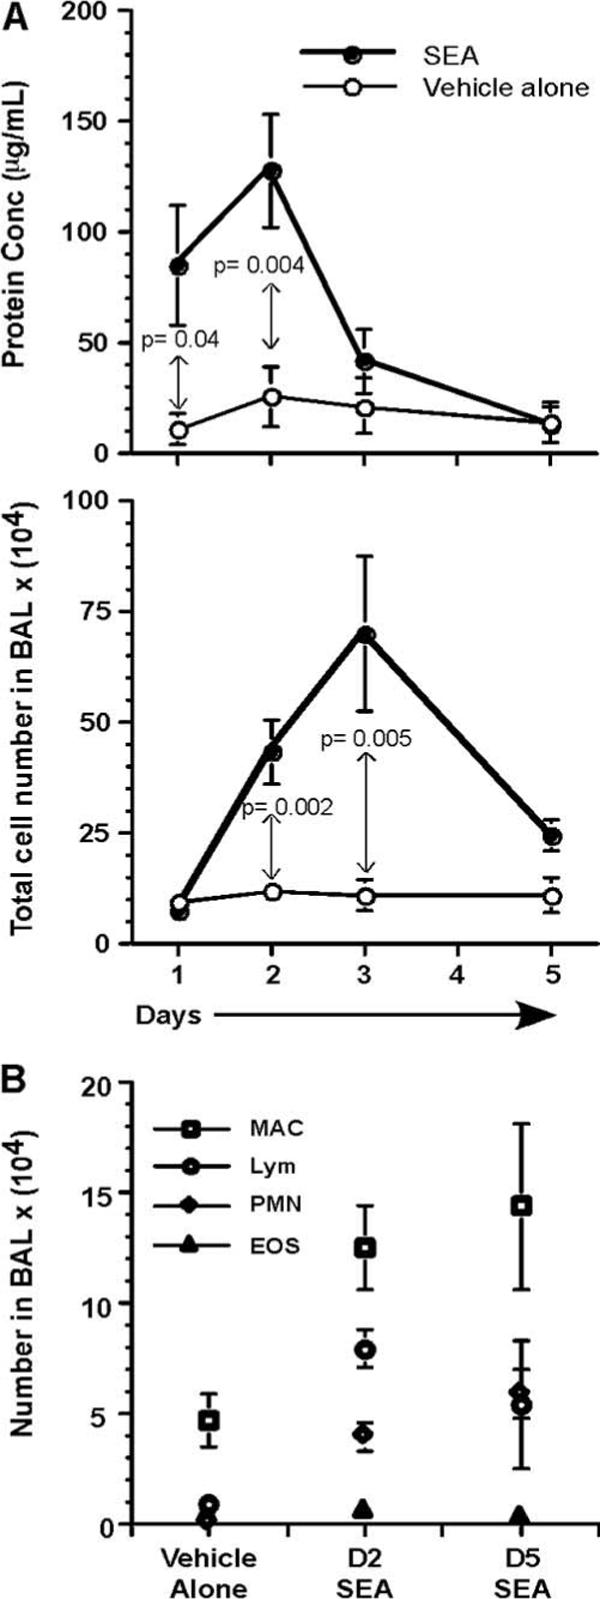
Protein concentration and cell numbers increase in BAL after SEA challenge. A, BAL fluid was collected from the lungs of mice, after vehicle-alone or SEA treatment, on days 1, 2, 3, and 5. The protein concentration was measured using BCA analysis. Values are from three different experiments (n = 6−8) represented as mean ± SEM. Statistical significance (p values) between vehicle-alone treatment and SEA challenge, for days 1 and 2, is indicated in the plot. Total BAL cell numbers were enumerated for vehicle-alone treatment and SEA challenge, on days 1, 2, 3, and 5. Values are from three different experiments (n = 6−8) represented as mean ± SEM. B, The constituents of BAL (macrophage, lymphocytes, neutrophils, and eosinophils) were analyzed after May-Grünwald and Giemsa stains from vehicle-alone, days 2 and 5 SEA-treated mice. Data are from three different experiments (n = 10) represented as mean ± SEM.
Apart from analyzing total protein, BAL cellularity was also measured on days 1, 2, 3, and 5 after SEA exposure (Fig. 2B, bottom panel). Unlike protein concentration, the BAL cellularity on day 1 after SEA exposure was no different from vehicle-alone control. However, the cell numbers following SEA exposure increased by 3.5-fold over vehicle-alone treatment on day 2. The peak increase in the BAL cellular constituents was observed on day 3, when a 7-fold increase over vehicle-alone control was observed. The numbers decreased by day 5 to levels seen in control mice.
The cellular constituents in the BAL were analyzed by staining with May-Grünwald and Giemsa stains. This allowed identification of cell types such as macrophages, neutrophils, eosinophils, and lymphocytes. BAL differential cell numbers were enumerated after vehicle-alone treatment, day 2 SEA challenge, or day 5 SEA challenge (Fig. 2B). Macrophage numbers increased from 4.7 × 10⁴ to 1.2 × 10⁵ two days after SEA challenge and continued to remain high at 1.4 × 10⁵ even on day 5. The lymphocyte numbers for vehicle-alone treatment on day 2 were 8.9 × 10³, whereas day 2 SEA challenge resulted in the accumulation of 7.9 × 10⁴ cells. Day 2 appeared to be the peak of lymphocyte recruitment because their numbers reduced to 4.8 × 10⁴ by day 5. The most dramatic change in numbers was observed for the neutrophils, with their numbers increasing from 4 × 10² in vehicle-alone treatment to 3.9 × 10⁴ after day 2 SEA challenge. The neutrophil counts continued to remain high even on day 5 at 5.4 × 10⁴. It was interesting to note that whereas there was a reduction in the number of lymphocytes by day 5, the neutrophil numbers continued to increase. Eosinophil counts in the BAL did not vary following SEA challenge, and the numbers were similar to vehicle-alone treatment.
Intranasal SEA challenge resulted in local and systemic expansion of T cells
Having observed the increase in lymphocyte counts in the BAL and with the vast amount of data pointing to effects on T cells following SEA exposure, it was important to determine the fate of T cells following i.n. SEA challenge. We tested whether the effect of SEA was restricted locally to the lung or whether it was distributed systemically. Again, the time kinetics involved in this analysis were days 1, 2, 3, and 5 following SEA challenge. The number of SEA-specific CD4+Vβ3+ and CD8+Vβ3+ cells was analyzed in the lung, spleen, inguinal, axillary, brachial, and mesenteric LNs following vehicle-alone or SEA challenge (Fig. 3). In the lungs, the peak of CD8 Vβ3 T cell expansion was day 2, when a 56-fold increase over vehicle-alone treatment was observed. The numbers decreased by day 3 to 20-fold more CD8 Vβ3 T cells over control treatment. The expansion of CD4 Vβ3 T cells in the lung was not as dramatic as CD8 Vβ3 T cells. The peak of expansion was day 2; however, unlike CD8 Vβ3 T cells, CD4 Vβ3 T cell expansion was only 19-fold more than vehicle-alone treatment. Both the CD8 and CD4 Vβ3+ T cell numbers started to decline by day 3 and reached the vehicle-alone treatment level by day 5. One important observation was the fact that at the peak of the response, the actual number of CD8+Vβ3+ T cells in the lungs was 1.7-fold more than the number of CD4+Vβ3+ T cells at the same time point. The dramatic increase in the CD8+Vβ3+ T cell numbers was restricted only to the lung. In systemic tissues, there were always more CD4+Vβ3+ T cells than CD8+Vβ3+ T cells at the peak of T cell response. In the spleen, the number of CD4+Vβ3+ T cells was 2.3-fold more than CD8+Vβ3+ T cells, and this trend was observed in other tissues as well. Apart from this difference, the CD4 and CD8 Vβ3+ T cell expansion followed a trend seen in lungs, with day 2 being the peak of the response and the T cell numbers being reduced to the level of vehicle-alone treatment by day 5 (Fig. 3). Apart from actual numbers, the percentage of Vβ3 cells in total CD8 or CD4 population also peaked by day 2, with as much as 30% of the T cell population in the lung comprising SEA-specific Vβ3 cells.
FIGURE 3.
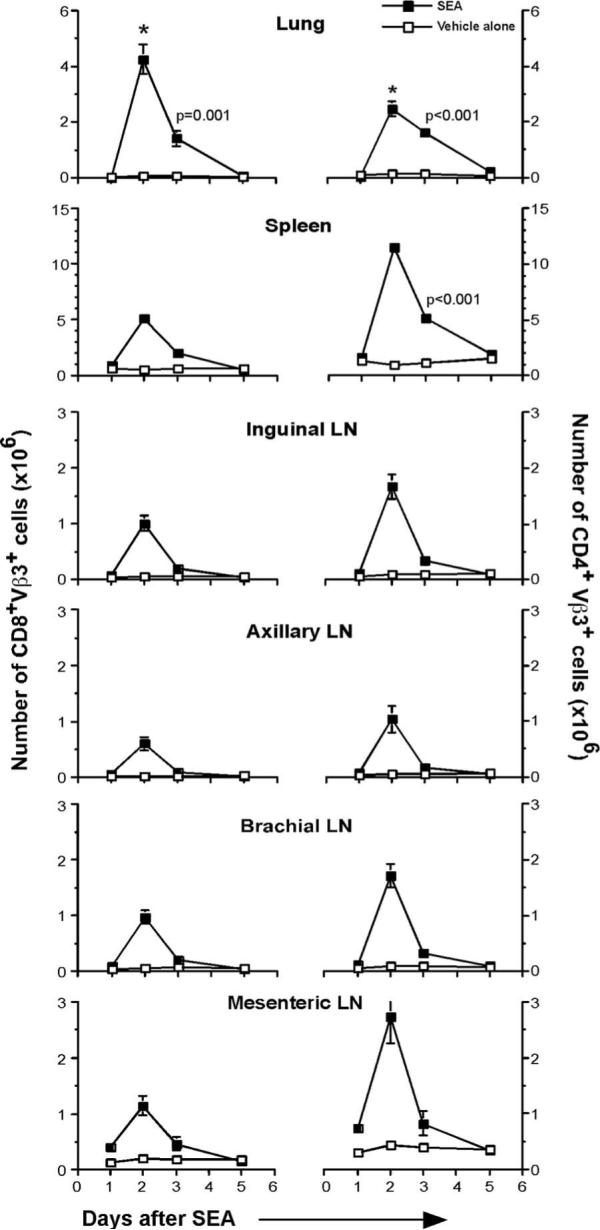
Local and systemic expansion of T cells following i.n. SEA challenge. Lung, spleen, inguinal LN, axillary LN, brachial LN, and mesenteric LNs were isolated from mice following vehicle-alone or SEA challenge. Total number of CD8+Vβ3+ T cells and CD4+Vβ3+ T cells was enumerated from these tissues on days 1, 2, 3, and 5. *, All day 2 data points in the SEA group were at least p ≤ 0.002 compared with the same time point in the vehicle-alone group. Day 3 data points that were statistically significant are indicated. Data are from three independent experiments (n = 5) represented as mean ± SEM.
CD8 T cells played an important role in SEA-mediated pathology
Given the massive expansion of T cells in the lungs following SEA challenge, we hypothesized that T cell subsets and T cell-derived factors could be influencing lung injury observed in Fig. 1. To test this hypothesis, wild-type (WT), TCRβδ−/−, CD4-depleted, and CD8-depleted mice were given an i.n. SEA or vehicle-alone challenge. Two days later, lungs were sectioned and analyzed by H&E staining (Fig. 4A). The vehicle-alone treatment caused no damage to the lungs in any of the groups of mice. Day 2 SEA challenge induced an inflammatory response in the lungs of WT mice characterized by perivascular, peribronchial, and alveolar inflammation. In the TCRβδ−/− mice, the effect of SEA was completely abrogated (Fig. 4A2). CD4 depletion led to partial abrogation of the effects of SEA (Fig. 4A3); whereas some perivascular and peribronchial inflammation persisted, cellular infiltration of the alveolus was considerably reduced. Although CD4 depletion only partially abrogated the effects of SEA, CD8 depletion resulted in near-complete clearance of both airway and alveolar disease (Fig. 4A4). This led us to postulate that CD8 T cells were critical for lung injury, whereas CD4 T cells provided the much needed help for CD8 T cells.
FIGURE 4.
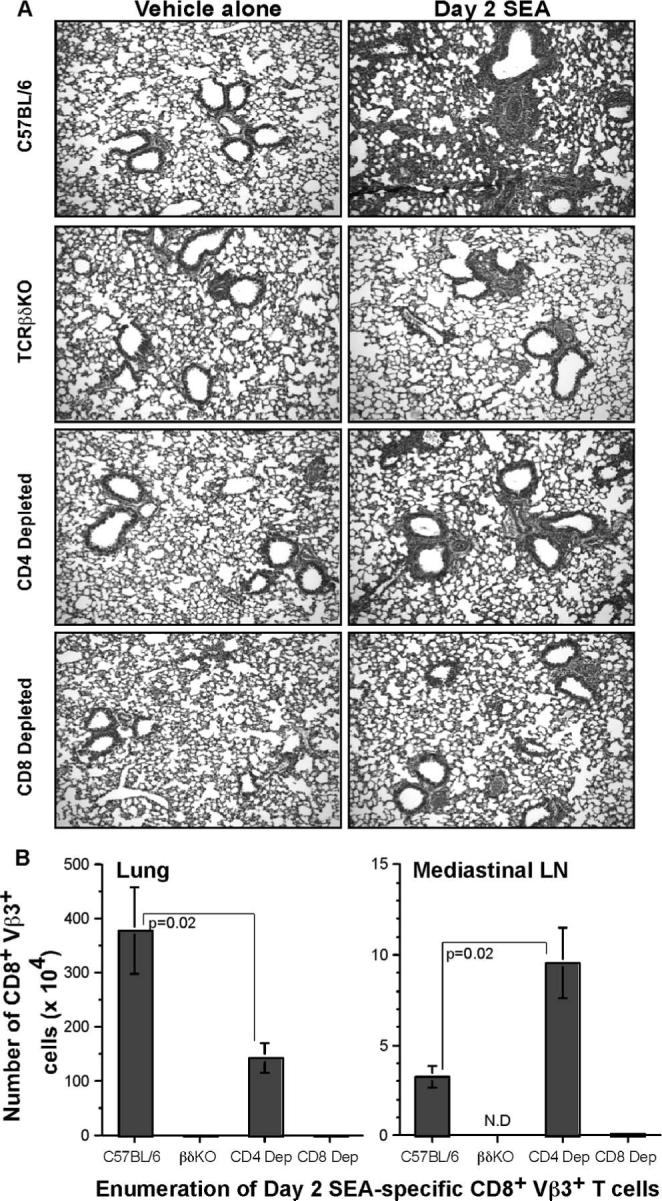
CD8 T cell depletion abrogates SEA-induced pathological changes in the lung. A, Lungs were isolated from C57BL/6, TCRβδ−/−, CD4-depleted, and CD8-depleted groups on day 2 following vehicle-alone or SEA challenge. After routine fixation, sectioning, and H&E staining, the lungs were examined for pathological changes. Data are from one representative experiment of three performed (n = 3). B, Total number of CD8+Vβ3+ T cells was enumerated from lung and mediastinal LNs of C57BL/6, TCRβδ knockout, CD4-depleted, and CD8-depleted groups after day 2 SEA challenge. Statistical significance was compared between C57BL/6 and CD4-depleted groups, and is indicated. Data are from three independent experiments (n = 6) represented as mean ± SEM.
Confirming this idea was the enumeration of CD8+Vβ3+ T cell numbers in the lungs (Fig. 4B, left panel) and mediastinal LNs (Fig. 4B, right panel) of mice with or without CD4 depletion. Although there was robust expansion of CD8 T cells in the presence of CD4 T cells, the number of lung CD8+Vβ3+ T cells was reduced by 2.63-fold following CD4 depletion. This could probably account for the partial abrogation of the effects of SEA, because there was only half the number of CD8+Vβ3+ T cells following depletion of CD4 T cells. Surprisingly, analysis of the lung-draining mediastinal LNs revealed that CD8 T cells could proliferate in the absence of CD4 T cells because there were 2.9-fold more CD8+Vβ3+ T cells in the absence of CD4 T cells. Therefore, at the site of inflammation, CD4 T cells played a crucial role in mediating accumulation of SEA-specific CD8 T cells. Without CD4 T cells in the lung, the SEA-specific CD8 T cells accumulated in the draining LNs and appeared to be restricted from entering the lung.
SEA challenge induced CD8 T cells to synthesize IFN-γ with help from CD4 T cells
Having observed T cell expansion in the lungs and mediastinal LNs, it was important to understand the effector cytokine function of SEA-specific T cells. Neither CD4 nor CD8 T cells produced much TNF after in vivo SEA stimulation, followed by in vitro recall with SEA (data not shown). However, CD8 T cells made 3-fold more IFN-γ when in vivo SEA-stimulated cells were recalled in vitro with SEA (18.1%) over nothing (6.8%) (Fig. 5A). In the CD4-depletion groups, in vivo SEA challenge followed by in vitro SEA recall induced CD8 T cells to make IFN-γ (9.2%); however, the percentage of IFN-γ production was 2-fold less in the absence of CD4 T cells (Fig. 5B, top panel). This difference increased to 3-fold when the actual number of CD8 T cells making IFN-γ was calculated (Fig. 5B, bottom panel).
FIGURE 5.

IFN-γ production by CD8 T cells is dependent on CD4 T cell help. Lung tissue was digested with collagenase and EDTA on day 2 after vehicle-alone or SEA challenge. Total lung cells were cultured with nothing or SEA for 5 h, and CD8 T cells were analyzed for IFN-γ synthesis. A, Gating strategy to analyze CD8 T cell IFN-γ production. FACS plots are from one representative experiment of three performed (n = 6). B, Enumeration of percentage and number of CD8 T cells synthesizing IFN-γ after in vivo vehicle-alone or SEA challenge, followed by in vitro SEA recall. Statistical significance, compared between different samples, is given. Data are from three independent experiments (n = 6) represented as mean ± SEM.
SEA challenge induced pathological changes in the lung through the action of IFN-γ
Because CD8 depletion abrogated the lung pathology observed after SEA challenge and these cells were the primary source of IFN-γ production, it was crucial to test whether IFN-γ by itself was important for the effects of SEA. WT and IFN-γ−/− mice were challenged with SEA or vehicle alone (Fig. 6A). Although vehicle-alone treatment did not have an effect on WT or IFN-γ−/− mice (Fig. 6A, left panels), day 2 SEA treatment induced lung inflammation, as previously described, in WT mice (Fig. 6A, top right panel). Nevertheless, day 2 SEA challenge did not affect the IFN-γ−/− mice, and we observed near-complete abrogation of the lung pathologic effects of SEA in the absence of IFN-γ (Fig. 6A, bottom right panel). Thus, in the absence of CD8 T cells or IFN-γ, disease pathology seen in the lungs after i.n. SEA challenge was clearly abrogated.
FIGURE 6.
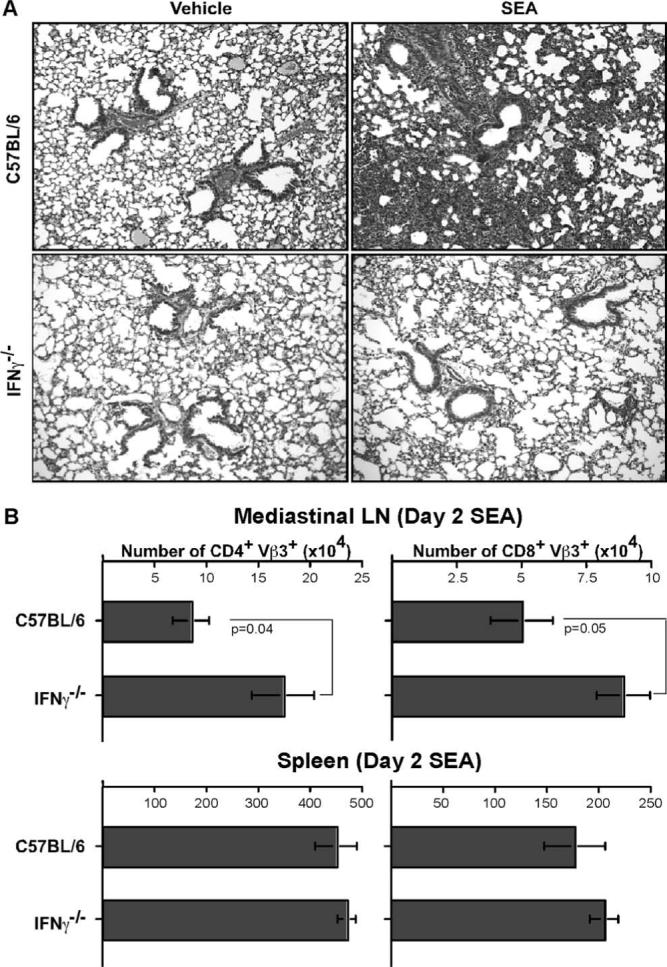
Absence of IFN-γ impairs the ability of SEA to induce airway obstruction and alveolitis. A, Lungs were isolated from C57BL/6 and IFN-γ−/− mice on day 2 following vehicle-alone or SEA challenge. The lungs were examined after routine fixation, sectioning, and staining with H&E. Data are from one representative experiment of three performed (n = 3). B, Total number of CD4+Vβ3+ T cells and CD8+Vβ3+ T cells was enumerated from mediastinal LNs and spleen of C57BL/6 and IFN-γ−/− mice on day 2 SEA challenge. Statistical significance between groups is given for mediastinal LNs. Data are from three independent experiments (n = 5) represented as mean ± SEM.
Interestingly, although no disease phenotype was observed in the lungs, there was a 2-fold increase in the accumulation of both CD4 Vβ3 T cells and CD8 Vβ3 T cells in the mediastinal LNs of IFN-γ−/− mice compared with the WT (Fig. 6B, top panel). This was consistent with results obtained in Fig. 4B showing CD8 Vβ3 T cell accumulation in mediastinal LNs in the absence of CD4 T cells. This was a local effect and did not manifest systematically, because no such result was observed in the number of CD4 Vβ3 and CD8 Vβ3 T cells in the spleen. Thus, the absence of IFN-γ or CD4 help could lead to failure in the recruitment of T cells to the lung, although they are able to accumulate in the mediastinal LNs.
In the absence of IFN-γ, early recruitment of neutrophils to the lungs is observed
Because lack of an IFN-γ response abrogated disease pathology, we wanted to analyze the constituents in the BAL of WT and IFN-γ−/− mice to find out whether there was any difference in the accumulation of innate immune cell types or protein constituents in the lung. The day 2 SEA BAL protein concentration from WT and IFN-γ−/− mice was measured using BCA analysis, resolved on a SDS-PAGE gel, and stained with silver nitrate. There was no difference in protein concentration (left panel), nor were there significant changes in the protein constituents (right panel) between WT and IFN-γ−/− mice (Fig. 7A). In the BAL cellular constituents, there was no difference in the total BAL cell numbers or macrophage numbers between day 2 SEA treatments in WT and IFN-γ−/− mice. However, there was a 3.95-fold decrease in lymphocyte numbers in the IFN-γ−/− mice as compared with WT mice, whereas an opposite trend was observed in neutrophil numbers with a 3.62-fold increase in the IFN-γ−/− mice as compared with WT mice (Fig. 7B). Cytospin preparations of the BAL fluid, after SEA challenge in WT and IFN-γ−/− mice, revealed increased percentage of neutrophils (indicated by arrows, Fig. 7C).
FIGURE 7.

IFN-γ deficiency facilitates early recruitment of neutrophils. A, BAL fluid was collected from the lungs of C57BL/6 and IFN-γ−/− mice after day 2 SEA treatment. The protein concentration was measured using BCA analysis. Values are from three different experiments (n = 5) represented as mean ± SEM. Statistical significance (p value) is mentioned (left panel). Protein was collected from BAL fluid of day 2 SEA-treated C57BL/6 and IFN-γ−/− mice. They were resolved by 10−20% SDS-PAGE gel under reducing conditions and stained with silver nitrate. Molecular weight markers were loaded on the left and center lanes, and the appropriate m.w. are indicated (right panel). B, Total lavage numbers were enumerated, and BAL differentials were analyzed after May-Grünwald and Giemsa stains from C57BL/6 and IFN-γ−/− mice after day 2 vehicle-alone or SEA treatment. Statistical significance between C57BL/6 and IFN-γ−/− mice after SEA treatment is indicated. Data are from three different experiments (n = 5) represented as mean ± SEM. C, Representative images (×40) of BAL slidedifferentials from C57BL/6 and IFN-γ−/− mice after day 2 SEA treatment. Neutrophils are indicated by arrows.
Discussion
In this study, the effect of i.n. SEA exposure in lung has been investigated, and the cellular and molecular players involved have been identified. The pathological effects of SEA are primarily T cell and IFN-γ dependent; however, these adaptive immune components regulate the recruitment of neutrophils to the lungs. Thus, staphylococcal enterotoxins affect innate immune cell types by influencing the adaptive immune system.
The pathological effects of SEA on the lung (Fig. 1) show features that are characteristic of restrictive (alveolitis) disease. The restrictive disease phenotype is characterized by alveolar or inter-stitial thickening and inflammation, and these pathological features are characteristic of acute respiratory distress syndrome (ARDS) (23). A single i.n. exposure of SEA leads to pathological features in the lung indicative of restrictive disease phenotypes followed by its resolution. Thus, this system unveils an opportunity to investigate the role of different cellular and molecular players that might be influencing major pathological changes in the lung. Secondly, it is further evidence of the need to understand the impact that such toxins may have in the unfortunate instance of a biothreat.
SEA-induced pathology was not very similar to the pathology seen in cases of asthma, and investigating the constituents of the BAL supported this idea (Fig. 2B). Although massive eosinophilia is observed in asthma (25), there was no increase in the number of eosinophils after SEA challenge. Interestingly, there was an increase in the number of neutrophils, which can be seen in asthma, but is a prominent feature observed in ARDS (26). Although the total neutrophil counts were not high, the fact that increased numbers correlated with disappearance of the disease phenotype suggested a possible role of neutrophils in lung repair. Moreover, there was also an increase of macrophages that was maintained through day 5. These data are consistent with a growing theme showing that SEA-induced T cell responses stimulate innate cells such as lung CD11c+ cells, as we have recently observed (27). Taken together, future studies should provide a clearer picture on the precise role that each innate cell population contributes to disease.
SAgs are known for stimulating robust T cell responses (28), and therefore, it was no surprise to observe accumulation of large numbers of CD4+ and CD8+ Vβ3+ T cells both locally and systemically after SEA challenge (Fig. 3). However, the mechanism of systemic T cell activation is currently unknown, but may involve the action of dendritic cells, which could transfer SEA from the lung into draining LNs or into the periphery. Consistent with this idea are data showing that CD11c+ cells rapidly accumulate in the lung after i.n. SEA treatment (27). It is also possible that SEA leaks into the bloodstream, although other studies have shown that SAg is rapidly absorbed by the immune system (29). Perhaps surprisingly, however, was the accumulation of 2-fold more CD8+Vβ3+ T cells over CD4+Vβ3+ T cells in the lungs. This trend was reversed in all other tissues and in unimmunized mice. This indicated that accumulation of the CD8 T cell subset may be important for causing SEA-mediated pathology in the lung.
In the absence of T cells, no lung pathology was observed following SEA challenge (Fig. 4A). Of the T cell subsets involved, depletion of CD4 T cells led to partial abrogation of disease (Fig. 4A3), and a defect in the accumulation of CD8 T cells in the lungs (Fig. 4B, left panel). Also, depletion of CD4 T cells led to a reduction in the synthesis of IFN-γ by CD8 T cells (Fig. 5B). Thus, CD4 T cells played an important helper role by regulating CD8 T cell accumulation and IFN-γ synthesis. Interestingly, CD4 depletion did not influence CD8+Vβ3+ T cell accumulation in the mediastinal LN, suggesting that CD8 T cell recruitment to the lung was dependent on CD4 help.
The CD8 T cell response in the lung was critical for causing pathology, because depletion resulted in a phenotype that was similar to complete T cell deficiency (Fig. 4A4). Also, CD8 T cells were the primary source of IFN-γ production. CD4 T cells synthesized very little of the proinflammatory cytokines (data not shown). Although CD8 T cells synthesized substantial amounts of IFN-γ, these cells did not produce very much TNF at the time points tested (data not shown). Thus, we hypothesize that CD8 T cells cause pulmonary inflammation primarily through IFN-γ.
The pivotal role for IFN-γ in SEA-mediated lung damage was clear when i.n. SEA challenge failed to cause bronchial obstruction or alveolitis in IFN-γ-deficient mice (Fig. 6A). This was the case even though there were increased numbers of CD4 and CD8 Vβ3 T cells in the mediastinal LNs of IFN-γ-deficient mice. Nevertheless, they were inhibited from entry into the lung. IFN-γ can induce the synthesis of CCR7 and its ligand CCL21, both of which are important for T cell trafficking. Therefore, it is possible that SEA drives T cell migration into the lung through this pathway. Secondly, IFN-γ deficiency inhibited lymphocyte counts in the BAL; however, the absence of IFN-γ induced early recruitment of neutrophils (Fig. 7B). The 3-fold increase in neutrophil numbers in the BAL of IFN-γ-deficient mice suggested that this proinflammatory cytokine blocks neutrophils from entering the lung. The role for neutrophils in acute lung injury has not been clear and most likely depends on the type of injury. This study suggests that neutrophils could be important in lung repair, and that inhibiting IFN-γ may accelerate this possibility. Nevertheless, systemic SEB injection mediated neutrophilic lung injury, which was marked by up-regulation of Mac-1 on granulocytes, and increased production of toxic oxygen metabolites in response to the leukocyte attractant peptide FMLP (24). Secondly, i.n. injection of higher doses of SEB into HLA-DR3 transgenic mice also led to neutrophilic inflammation and lung injury, whereas lower doses were marked by eosinophilic lung inflammation (30). Thus, the type of model and dose used can affect the outcome, suggesting that more work is needed to uncover the basis of neutrophil function in these various systems.
Another interesting notion in regard to the switch from T cells to neutrophils in the absence of IFN-γ is the possibility that SAgs stimulate T cells as a mechanism to protect S. aureus from neutrophils. Neutrophils mediate removal of S. aureus, whereas T cell activation by S. aureus enterotoxins may ultimately be immunosuppressive (31). Therefore, it is possible that enterotoxins are decoys used by S. aureus to launch powerful T cell responses as a mechanism to evade neutrophils. Although this theory is not proven, it may be helpful to consider it when developing new approaches for the treatment of patients infected with meticillin-resistant S. aureus.
In conclusion, our data speak to the mechanism behind SEA-mediated lung injury. The cellular and molecular players identified in this process might also have a role in pulmonary disorders such as ARDS and chronic obstructive pulmonary disease. Thus, understanding the cellular and molecular mechanism of SEA-induced pulmonary disease in mice will help evaluate various therapeutic options for major pulmonary diseases.
Footnotes
This work was supported by National Institutes of Health Grants AI 142858 and AI 52108 (to A.T.V.).
Abbreviations used in this paper: SAg, superantigen; ARDS, acute respiratory distress syndrome; BAL, bronchoalveolar lavage; BCA, bicinchoninic acid; BSS, balanced salt solution; i.n., intranasal; LNs, lymph nodes; SEA, staphylococcal enterotoxin A; SEB, staphylococcal enterotoxin B; WT, wild type.
Disclosures The authors have no financial conflict of interest.
References
- 1.Herman A, Kappler JW, Marrack P, Pullen AM. Superantigens: mechanism of T-cell stimulation and role in immune responses. Annu. Rev. Immunol. 1991;9:745–772. doi: 10.1146/annurev.iy.09.040191.003525. [DOI] [PubMed] [Google Scholar]
- 2.Proft T, Fraser J. Superantigens: just like peptides only different. J. Exp. Med. 1998;187:819–821. doi: 10.1084/jem.187.6.819. [DOI] [PMC free article] [PubMed] [Google Scholar]
- 3.Proft T, Sriskandan S, Yang L, Fraser JD. Superantigens and streptococcal toxic shock syndrome. Emerg. Infect. Dis. 2003;9:1211–1218. doi: 10.3201/eid0910.030042. [DOI] [PMC free article] [PubMed] [Google Scholar]
- 4.Fraser J, Arcus V, Kong P, Baker E, Proft T. Superantigens: powerful modifiers of the immune system. Mol. Med. Today. 2000;6:125–132. doi: 10.1016/s1357-4310(99)01657-3. [DOI] [PubMed] [Google Scholar]
- 5.Skov L, Baadsgaard O. Bacterial superantigens and inflammatory skin diseases. Clin. Exp. Dermatol. 2000;25:57–61. doi: 10.1046/j.1365-2230.2000.00575.x. [DOI] [PubMed] [Google Scholar]
- 6.Bachert C, Gevaert P, van Cauwenberge P. Staphylococcus aureus superantigens and airway disease. Curr. Allergy Asthma Rep. 2002;2:252–258. doi: 10.1007/s11882-002-0027-9. [DOI] [PubMed] [Google Scholar]
- 7.Van Leeuwen WB, Melles DC, Alaidan A, Al-Ahdal M, Boelens HA, Snijders SV, Wertheim H, van Duijkeren E, Peeters JK, van der Spek PJ, et al. Host- and tissue-specific pathogenic traits of Staphylococcus aureus. J. Bacteriol. 2005;187:4584–4591. doi: 10.1128/JB.187.13.4584-4591.2005. [DOI] [PMC free article] [PubMed] [Google Scholar]
- 8.Leung DY, Hauk P, Strickland I, Travers JB, Norris DA. The role of superantigens in human diseases: therapeutic implications for the treatment of skin diseases. Br. J. Dermatol. 1998;139(Suppl 53):17–29. doi: 10.1046/j.1365-2133.1998.1390s3017.x. [DOI] [PubMed] [Google Scholar]
- 9.Leung DY, Travers JB, Norris DA. The role of superantigens in skin disease. J. Invest. Dermatol. 1995;105:37S–42S. doi: 10.1111/1523-1747.ep12315250. [DOI] [PubMed] [Google Scholar]
- 10.Leung DY, Walsh P, Giorno R, Norris DA. A potential role for superantigens in the pathogenesis of psoriasis. J. Invest. Dermatol. 1993;100:225–228. doi: 10.1111/1523-1747.ep12468941. [DOI] [PubMed] [Google Scholar]
- 11.Yarwood JM, Leung DY, Schlievert PM. Evidence for the involvement of bacterial superantigens in psoriasis, atopic dermatitis, and Kawasaki syndrome. FEMS Microbiol. Lett. 2000;192:1–7. doi: 10.1111/j.1574-6968.2000.tb09350.x. [DOI] [PubMed] [Google Scholar]
- 12.Saloga J, Knop J. Superantigens in skin diseases. Eur. J. Dermatol. 1999;9:586–590. [PubMed] [Google Scholar]
- 13.Bachert C, Gevaert P, Howarth P, Holtappels G, van Cauwenberge P, Johansson SG. IgE to Staphylococcus aureus enterotoxins in serum is related to severity of asthma. J. Allergy Clin. Immunol. 2003;111:1131–1132. [PubMed] [Google Scholar]
- 14.Bachert C, van Zele T, Gevaert P, De Schrijver L, Van Cauwenberge P. Superantigens and nasal polyps. Curr. Allergy Asthma Rep. 2003;3:523–531. doi: 10.1007/s11882-003-0065-y. [DOI] [PubMed] [Google Scholar]
- 15.Seiberling KA, Conley DB, Tripathi A, Grammer LC, Shuh L, Haines GK, III, Schleimer R, Kern RC. Superantigens and chronic rhinosinusitis: detection of staphylococcal exotoxins in nasal polyps. Laryngoscope. 2005;115:1580–1585. doi: 10.1097/01.mlg.0000168111.11802.9c. [DOI] [PubMed] [Google Scholar]
- 16.Breuer K, Kapp A, Werfel T. Bacterial infections and atopic dermatitis. Allergy. 2001;56:1034–1041. doi: 10.1034/j.1398-9995.2001.00146.x. [DOI] [PubMed] [Google Scholar]
- 17.Leung DY, Harbeck R, Bina P, Reiser RF, Yang E, Norris DA, Hanifin JM, Sampson HA. Presence of IgE antibodies to staphylococcal exotoxins on the skin of patients with atopic dermatitis: evidence for a new group of allergens. J. Clin. Invest. 1993;92:1374–1380. doi: 10.1172/JCI116711. [DOI] [PMC free article] [PubMed] [Google Scholar]
- 18.Herz U, Ruckert R, Wollenhaupt K, Tschernig T, Neuhaus-Steinmetz U, Pabst R, Renz H. Airway exposure to bacterial superantigen (SEB) induces lymphocyte-dependent airway inflammation associated with increased airway responsiveness: a model for non-allergic asthma. Eur. J. Immunol. 1999;29:1021–1031. doi: 10.1002/(SICI)1521-4141(199903)29:03<1021::AID-IMMU1021>3.0.CO;2-3. [DOI] [PubMed] [Google Scholar]
- 19.Hellings PW, Hens G, Meyts I, Bullens D, Vanoirbeek J, Gevaert P, Jorissen M, Ceuppens JL, Bachert C. Aggravation of bronchial eosinophilia in mice by nasal and bronchial exposure to Staphylococcus aureus enterotoxin B. Clin. Exp. Allergy. 2006;36:1063–1071. doi: 10.1111/j.1365-2222.2006.02527.x. [DOI] [PubMed] [Google Scholar]
- 20.Unkeless JC. Characterization of a monoclonal antibody directed against mouse macrophage and lymphocyte Fc receptors. J. Exp. Med. 1979;150:580–596. doi: 10.1084/jem.150.3.580. [DOI] [PMC free article] [PubMed] [Google Scholar]
- 21.Maddox L, Schwartz DA. The pathophysiology of asthma. Annu. Rev. Med. 2002;53:477–498. doi: 10.1146/annurev.med.53.082901.103921. [DOI] [PubMed] [Google Scholar]
- 22.Ware LB. Pathophysiology of acute lung injury and the acute respiratory distress syndrome. Semin. Respir. Crit. Care Med. 2006;27:337–349. doi: 10.1055/s-2006-948288. [DOI] [PubMed] [Google Scholar]
- 23.Ware LB, Matthay MA. The acute respiratory distress syndrome. N. Engl. J. Med. 2000;342:1334–1349. doi: 10.1056/NEJM200005043421806. [DOI] [PubMed] [Google Scholar]
- 24.Neumann B, Engelhardt B, Wagner H, Holzmann B. Induction of acute inflammatory lung injury by staphylococcal enterotoxin B. J. Immunol. 1997;158:1862–1871. [PubMed] [Google Scholar]
- 25.Jacobsen EA, Ochkur SI, Lee NA, Lee JJ. Eosinophils and asthma. Curr. Allergy Asthma Rep. 2007;7:18–26. doi: 10.1007/s11882-007-0026-y. [DOI] [PubMed] [Google Scholar]
- 26.Geerts L, Jorens PG, Willems J, De Ley M, Slegers H. Natural inhibitors of neutrophil function in acute respiratory distress syndrome. Crit. Care Med. 2001;29:1920–1924. doi: 10.1097/00003246-200110000-00012. [DOI] [PubMed] [Google Scholar]
- 27.Muralimohan G, Rossi RJ, Vella AT. Recruitment and in situ renewal regulate rapid accumulation of CD11c+ cells in the lung following intranasal superantigen challenge. Int. Arch. Allergy Immunol. 2008;147:59–73. doi: 10.1159/000128660. [DOI] [PMC free article] [PubMed] [Google Scholar]
- 28.Scherer MT, Ignatowicz L, Winslow G, Kappler JW, Marrack P. Superantigens: bacterial and viral proteins that manipulate the immune system. Annu. Rev. Cell Biol. 1993;9:101–128. doi: 10.1146/annurev.cb.09.110193.000533. [DOI] [PubMed] [Google Scholar]
- 29.Vabulas R, Bittlingmaier R, Heeg K, Wagner H, Miethke T. Rapid clearance of the bacterial superantigen staphylococcal enterotoxin B in vivo. Infect. Immun. 1996;64:4567–4573. doi: 10.1128/iai.64.11.4567-4573.1996. [DOI] [PMC free article] [PubMed] [Google Scholar]
- 30.Rajagopalan G, Iijima K, Singh M, Kita H, Patel R, David CS. Intranasal exposure to bacterial superantigens induces airway inflammation in HLA class II transgenic mice. Infect. Immun. 2006;74:1284–1296. doi: 10.1128/IAI.74.2.1284-1296.2006. [DOI] [PMC free article] [PubMed] [Google Scholar]
- 31.Foster TJ. Immune evasion by staphylococci. Nat. Rev. 2005;3:948–958. doi: 10.1038/nrmicro1289. [DOI] [PubMed] [Google Scholar]