

Abstract
The stochastic dynamics of T cell receptor (TCR) signaling are studied using a mathematical model intended to capture kinetic proofreading (sensitivity to ligand-receptor binding kinetics) and negative and positive feedback regulation mediated respectively by the phosphatase SHP1 and the MAP kinase ERK. The model incorporates protein-protein interactions involved in initiating TCR-mediated cellular responses and reproduces several experimental observations about the behavior of TCR signaling, including robust responses to as few as a handful of ligands (agonist peptide-MHC complexes on an antigen-presenting cell), distinct responses to ligands that bind TCR with different lifetimes, and antagonism. Analysis of the model indicates that TCR signaling dynamics are marked by significant stochastic fluctuations and bistability, which is caused by the competition between the positive and negative feedbacks. Stochastic fluctuations are such that single-cell trajectories differ qualitatively from the trajectory predicted in the deterministic approximation of the dynamics. Because of bistability, the average of single-cell trajectories differs markedly from the deterministic trajectory. Bistability combined with stochastic fluctuations allows for switch-like responses to signals, which may aid T cells in making committed cell-fate decisions.
Keywords: T cell activation, mathematical model, kinetic proofreading, hysteresis, ordinary differential equations, stochastic simulations
1 Introduction
Activation of T lymphocytes, or T cells, is not only sensitive to small amounts of peptide antigen but also selective, with exquisite discrimination between foreign peptides, which must be recognized for immune defense, and self peptides, which must be ignored to avoid autoimmunity. Antigen recognition begins with interaction of the T cell receptor (TCR), its co-receptor (CD4 or CD8), and major histocompatibility complex (pMHC) molecules presenting peptide antigen on the surface of an antigen-presenting cell (APC). Helper T cells, which express CD4, can be activated by as few as 10 agonist (stimulatory) pMHC present on an APC, and even the presence of a single agonist pMHC produces a measurable transient response (Irvine et al., 2002). Killer T cells, which express CD8, are more sensitive; only three pMHCs are required to induce T cell-mediated killing (Purbhoo et al., 2004). At the same time T cells ignore pMHCs with short binding lifetimes, which are typically much less than a second for self peptides. Only peptides having binding lifetimes greater than 5 s are activating and small differences in binding have disproportionately large effects on T cell responses (Kersh et al., 1999).
To explain how T cells are able to discriminate between self and foreign peptide ligands of the TCR, McKeithan (1995) introduced the concept of kinetic proofreading, demonstrating using a simple model that a signal or cellular response can be highly sensitive to the lifetime of a ligand-receptor bond. According to the model, sensitivity to ligand-receptor binding kinetics arises if a response depends on a cascade of receptor modifications, the completion of which requires continued ligand-receptor engagement. The fraction of receptors able to complete such a cascade, which is assumed to comprise a series of tyrosine phosphorylation events, depends nonlinearly on the duration of ligand-receptor binding, which is consistent with observations that the potency of a ligand tends to correlate with its strength of binding and that stimulatory and non-stimulatory ligands may have only small differences in binding strength (Davis et al., 1998; Germain and Štefanová, 1999). Since the seminal work of McKeithan (1995), the kinetic proofreading concept has been explored and extended in many ways (for reviews, see Goldstein et al., 2004; 2008; George et al., 2005; Burroughs and Anton van der Merwe, 2007). For example, Burroughs et al. (2006) have recently studied a model in which spatial segregation of kinase and phosphatase activities contributes to TCR signaling. It is now clear that the original kinetic proofreading model is unable to explain all aspects of ligand discrimination by the TCR, including the phenomenon of antagonism (Evavold et al., 1994). Antagonism occurs when a non-stimulatory ligand inhibits T cell activation signals that are generated by an agonist ligand. Several attempts have been made to develop a mathematical model of TCR signaling that accounts for antagonism.
To explain antagonism, Rabinowitz et al. (1996) extended the kinetic proofreading model to include negative feedback at an intermediate stage of the receptor modification cascade and positive feedback at the end of the cascade. The model predicts that rapidly dissociating ligands will produce no signals, slowly dissociating ligands will produce amplified positive signals for T cell activation, and ligands with intermediate binding kinetics will produce negative signals, which can inhibit positive signals. Chan et al. (2001) also considered a model with negative and positive feedbacks. Subsequent experimental studies have elucidated molecular mechanisms that generate competing negative and positive feedbacks (Stefanová et al., 2003). These studies suggest that the protein tyrosine kinase Lck, which associates constitutively with the TCR co-receptors CD4 or CD8 and phosphorylates TCR, plays a central role in feedback regulation. By activating the protein tyrosine phosphatase SHP1, its own inhibitor, Lck triggers negative feedback. Positive feedback occurs when, as a result of Lck-mediated membrane-proximal signaling events, the MAP kinase ERK becomes activated and phosphorylates S59 in Lck, which prevents SHP1-mediated inhibition of Lck activity.
Altan-Bonnet and Germain (2005) formulated a mathematical model for TCR signaling that explicitly incorporates SHP1-mediated negative feedback and ERK-mediated positive feedback. Wylie et al. (2007) considered the same feedback mechanisms in another model, which also considers the role of co-receptor (CD4) and self peptide ligands in T cell activation. Neither of these models, each of which includes large numbers of chemical species and reactions, was rigorously analyzed to determine how stochastic fluctuations in population sizes might be influencing T cell signaling. We can expect these fluctuations to be significant in physiological situations as T cells respond to small numbers of agonist ligands.
Here, to investigate the role of stochastic fluctuations in TCR signaling, we develop and analyze a model that extends the models of McKeithan (1995) and Rabinowitz et al. (1996) to incorporate feedback mechanisms considered by Altan-Bonnet and Germain (2005) and Wylie et al. (2007). In the model, we associate particular molecular events with proofreading and feedback steps. However, to keep the model relatively simple and to ease its analysis, we make various assumptions about molecular events that limit the numbers of chemical species and reactions considered in the model, which can be a cause for concern. However, the model incorporates more molecular details than the model of Artyomov et al. (2007), who also studied the role of stochastic fluctuations in TCR signaling, and we find that our model is able to reproduce many of the behaviors that are characteristic of TCR signaling. We also find that the model exhibits bistability, which allows for committed switch-like cellular responses to noisy signals.
2 Model formulation
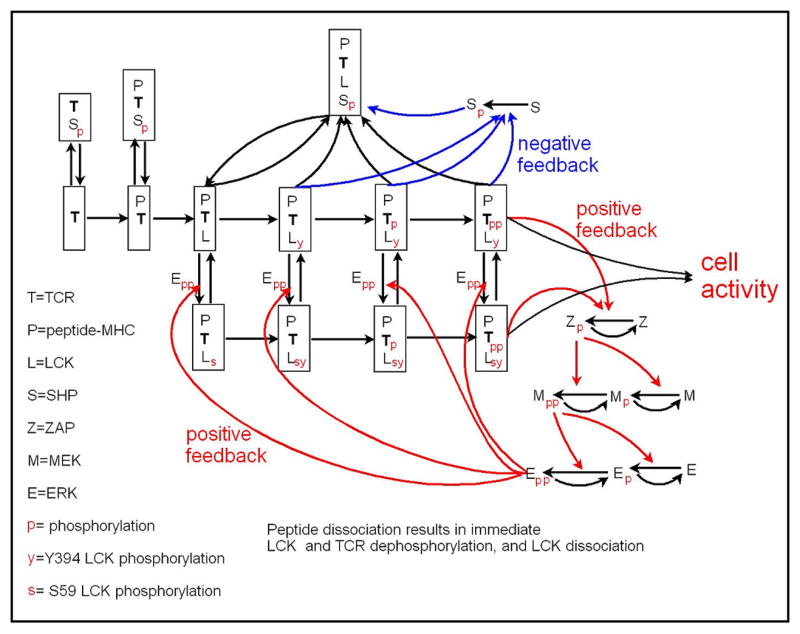
The model is illustrated in Figs. 1 and 2. Figure 1 provides a sketch of the model, indicating that it includes a number of kinetic proofreading steps that are associated with particular binding and phosphorylation events at or on a receptor. It also shows the steps at which negative and positive feedbacks originate and act. Figure 2 provides a more complete picture of the 37 chemical species and 97 reactions included in the model.
Fig. 1.

Overview of model. Discrimination between endogenous, antagonist and agonist peptides results from kinetic proofreading and competition between negative (blue) and positive (red) feedbacks. The majority of endogenous peptides dissociate before LCK phosphorylation occurs. Thus, these peptides do no induce any negative or positive signals and are ignored by a T cell. Antagonist peptides, on average, bind long enough such that LCK becomes phosphorylated, inducing negative feedback mediated by pSHP. Only agonist peptides bind long enough to fully activate TCR, resulting in production of doubly phosphorylated ERK (ppERK), which attenuates the negative feedback mediated by pSHP.
Fig. 2.
Full diagram of model. TCR signaling proceeds through a series of steps, including TCR binding to peptide-MHC ligand, ligand-induced TCR binding to LCK, autophosphorylation of LCK, and LCK-mediated phosphorylation of TCR. Phosphorylation of LCK results in SHP phosphorylation/activation, binding of pSHP to the receptor complex, and dephosphorylation of all complex components (negative feedback). Fully activated TCR, phosphorylates ZAP-70, which subsequently mediates the phosphorylation of MEK, which in turn mediates the phosphorylation of ERK. Activated ERK phosphorylates LCK(y) at S59, preventing interaction of (p)SHP and LCKs(y), and thus blocking the negative feedback mediated by pSHP.
In the model, mainly as a simplification, we take TCR signaling in the context of a cell-cell interface between a T cell and an APC to be triggered by monovalent receptor binding to peptide-MHC ligand, which is consistent with some results that have been reported in the literature (for example, see Ma et al., 2008). However, we note that the mechanism of TCR triggering is controversial and other mechanisms, such as the pseudodimer model in which co-receptors play an important role, have been proposed (Krogsgaard et al., 2007; Choudhuri and van der Merwe, 2007). We will use “MHC1” to refer to an agonist ligand, “MHC2” to refer to either an antogonist ligand or endogenous peptide, and “MHC” to refer to MHC1 and/or MHC2. Next, Lck binds to the cytoplasmic side of the receptor, which is enabled by ligand binding. We will use “LCK” to refer to unphosphorylated Lck. After association with TCR, LCK is autophosphorylated at Y394 in the activation loop, which increases its catalytic activity (Veillette et al., 1989; Veilette and Fournel 1990; Yamaguchi and Hendrickson, 1996). Autophosphorylation allows Lck to activate negative and positive feedbacks as described below. Presumably, Lck autophosphorylation is mediated in trans by the pool of Lck constitutively associated with CD4 or CD8 co-receptors. However, the model does not explicitly incorporate co-receptors. We essentially assume that autophosphorylation occurs spontaneously in a first order process. We will use “LCKy” to denote the tyrosine phosphorylated form of Lck. At this step, negative feedback is initiated; LCKy activates SHP1, which involves phosphorylation at residue Y564 (Lorenz et al., 1994; Štefanová et al., 2003). We will use “SHP” and “pSHP” to refer to the unphosphorylated and phosphorylated forms of SHP1. pSHP binds to TCR, where it dephosphorylates LCKy and prevents regeneration of LCKy (Chiang and Sefton, 2001; Štefanová et al., 2003).
LCKy is responsible for phosphorylation of immmunoreceptor tyrosine-based activation motifs (ITAMs) in TCR-associated cell-surface CD3 molecules. The TCR is associated with a heterodimer of CD3δ and CD3ε chains, a heterodimer of CD3γ and CD3ε chains, and a homodimer of CD3ζ chains (for a review of the structure of the TCR/CD3 complex, see Kuhns et al., 2006). The γ, δ, and ε chains each contain a single cytoplasmic ITAM, whereas the ζ chain contains three cytoplasmic ITAMs. The ζ chain ITAM contains two tyrosines that are substrates of Lck (Iwashima et al. 1994). As a simplification, we lump the six ITAMs of the two CD3ζ chains associated with a TCR into a single effective ITAM, which can be singly or doubly tyrosine phosphorylated. We will use “pTCR” and “ppTCR” to denote TCRs containing singly and doubly phosphorylated ζ ITAMs, respectively. We take ppTCR, but not pTCR, to be capable of recruiting and activating ZAP-70, which is a member of the Syk-family of protein tyrosine kinases. ZAP-70 is capable of binding doubly phosphorylated ITAMs through its two tandem Src homology 2 (SH2) domains, and much like Lck, ZAP-70 is activated through autophosphorylation (Chan et al., 1994; Chu et al., 1998). We assume that when ZAP-70 is associated with ppTCR, autophosphorylation occurs through a process that is effectively spontaneous and first order. This assumption is valid if cytosolic ZAP-70 is much more abundant than TCRs containing two adjacent ζ chains with doubly phosphorylated ITAMs. We will use “ZAP” to refer to the unphosphorylated from of ZAP-70 and “pZAP” to refer to the activated/phosphorylated form of ZAP-70. Finally, pZAP acts to initiate the MEK/ERK kinase cascade, resulting in production of doubly-phosphorylated ERK, which we will denote using “ppERK.” ppERK mediates positive feedback by phosphorylating LCK(y) at residue S59. The serine phosphorylated form of Lck will be denoted “LCKs.” LCKs is unable to phosphorylate SHP and competes with pSHP for binding to the TCR (Štefanová et al., 2003). Additional details about the model are provided in the Appendix.
The model structure (Figs. 1 and 2) ensures that the extent to which T cell activation proceeds depends on the mean lifetime of the interaction between TCR and MHC, te = 1/d, where d is the dissociation rate constant. Because we assume that LCK association with TCR follows binding of TCR to MHC (Fig. 2), formation of LCKy requires that a TCR-MHC bond last long enough for LCK to be recruited to TCR and then phosphorylated. Thus, formation of LCKy, which is required for signaling, is not induced when te is small compared to the expected time required for LCK recruitment and phosphorylation (e.g., te ≪ 1 s). This dependence of LCKy production on a serial cascade of events, which is interrupted and reversed immediately when TCR and MHC dissociate (Fig. 2), provides a simple mechanism by which a T cell can ignore endogenous peptides.
The competition of negative and positive feedbacks in the model ensures sharp discrimination (in te) between agonist and antagonist peptides. Antagonist peptides—those that bind long enough to produce negative feedback through pSHP but not long enough to activate ERK (positive feedback) and TCR—are inhibitory in the sense that stimulation by agonist ligands induces a weaker signal when antagonist ligands are present than when they are not. Sensitivity to a small number of agonist peptides results from strong amplification through the kinase cascade that activates ERK. This situation is in contrast to the models of Li et al. (2004) and Wylie et al. (2007). In these models, most signal amplification arises from a serial triggering mechanism that depends on low phosphatase activity. The assumption of low phosphatase activity is possibly satisfied in stages of TCR signaling after immunological synapse formation, but T cell killing does not require formation of a stable immunological synapse (Purbhoo et al., 2004).
The model is taken to represent the signaling dynamics in a single T cell and the reactions in the model are simulated as discrete events using the stochastic simulation method of Gillespie (1977), which applies when species are populated by either small or large numbers of molecules and provides information about stochastic fluctuations in population numbers. The parameter values used in simulations are summarized in Table 1 of the Appendix. To assess the importance of stochastic fluctuations and to investigate bistability, we also considered the dynamics in the deterministic limit. To do so, we formulated a system of ordinary differential equations (ODEs) corresponding to the reaction scheme illustrated in Fig. 2, and we solved these equations using standard numerical methods. A listing of the ODEs used in deterministic simulations and more details about simulation protocols are provided in the Appendix.
3 Results
3.1 Discrimination between agonist and antagonist peptides
Cytotoxic T cells respond to as few as three agonist peptides, but ignore thousands of endogenous peptides. Thus, the first expectation for a correct model is the ability to discriminate agonist from endogenous or antagonist peptides. For the measure of cell activity we select the level of ppERK. We consider a cell to be transiently activated when ppERKmax/ERKtotal > 1/2. If in a given cell ppERK(t)/ERKtotal > 1/2 for at least 2 hours we consider such a cell to be persistently activated. Cells for which ppERKmax/ERKtotal < 1/10 are considered inactive. In Fig. 3 we show domains of high, low and intermediate peak ERK activity in the (1/d, log(N)) parameter space, where d is the dissociation rate constant and N is the number of peptides per cell.
Fig. 3.
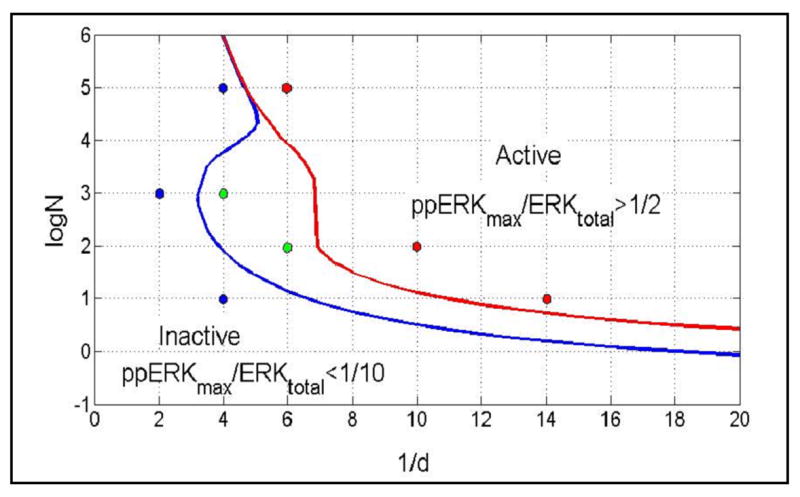
Panel A: Domains of high (ppERKmax/ERKtotal > 1/2), low (ppERKmax/ERKtotal < 1/10) and intermediate (1/10 < ppERKmax/ERKtotal < 1/2) peak ERK activity in the (1/d, log(N)) parameter space, calculated based on deterministic simulations, d is the peptide-MHC dissociation rate constant, and N is the number of peptide-MHC per cell. The colored dots indicate points at which deterministic and stochastic simulations are compared in Fig. 4.
Because the presented discrimination curves are based on deterministic simulations of the model, they must be interpreted with caution. In Fig. 4 we compare ppERK(t)/ERKtotal profiles obtained in deterministic versus stochastic simulations for the first 400 s after stimulation. As one would expect, there is high heterogeneity in single cell ERK responses. However, typically in the low ERK activity domain ppERKmax/ERKtotal < 1/5, whereas in the high ERK activity domain ppERKmax/ERKtotal > 1/2. In addition in both low and intermediate ERK activity domains the ERK activity is transient.
Fig. 4.
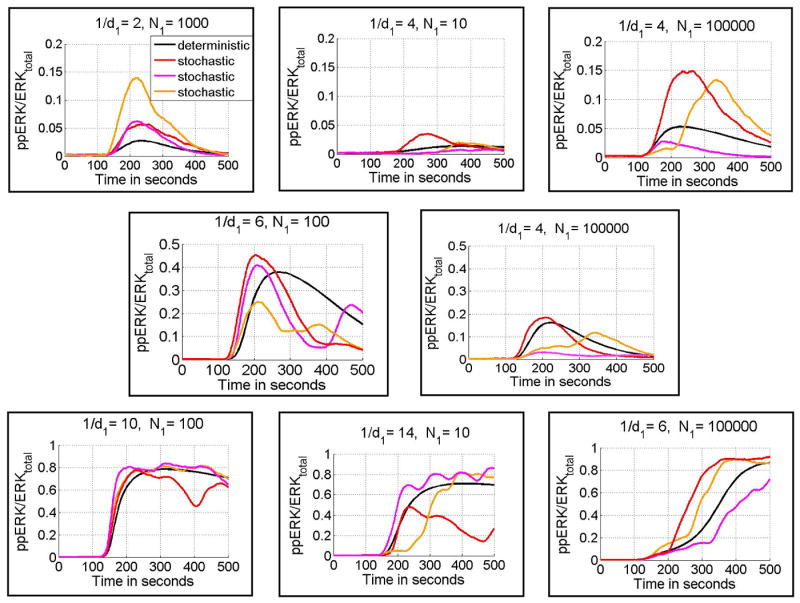
ppERK(t)/ERKtotal calculated in deterministic (black-line) and stochastic (red, pink and orange) simulations, for eight points in (1/d, log(N)) parameter space shown in Fig. 3. Panels in upper, middle, and lower rows correspond, respectively to points from low, intermediate and high ERK activity domains indicated in Fig. 3. Notice the different vertical scale for each row. Peptide stimulation started at ti = 100 s (from the beginning of the numerical simulation) and lasted for ts = 400 s.
3.2 Cell activity due to small number of agonist peptides
As follows from the analysis presented in Fig. 4 to analyze the behavior of heterogenous population responses one may not restrict oneself to the deterministic approximation but has to run many single cell stochastic simulations to obtain reliable statistics. To determine the fraction of cells transiently activated in response to simulation by a small number of agonist peptides, we performed simulation runs consisting of 500 single-cell stochastic simulations. Six populations of cells were stimulated for 6 min by, N1 = 1, 2, 3, 5, 10 or 30 agonist peptides with dissociation rate constant d1 = 0.05/s, i.e., expected binding time of 20 s. In Fig. 5 we show histograms of peak ERK activity (ppERKmax/ERKtotal) during stimulation for 6 min. As shown, most cells when stimulated by single agonist peptide remain inactive (Fig. 5A), whereas three peptides are, for most cells, sufficient for nearly full activation (Fig. 5C). A larger number of stimulating agonists makes the peak ERK activity distribution more compact, with a slightly higher average. As we will see later, the main difference between stimulation with 10, 30, 100 or 1000 peptides is in duration of ERK activity.
Fig. 5.
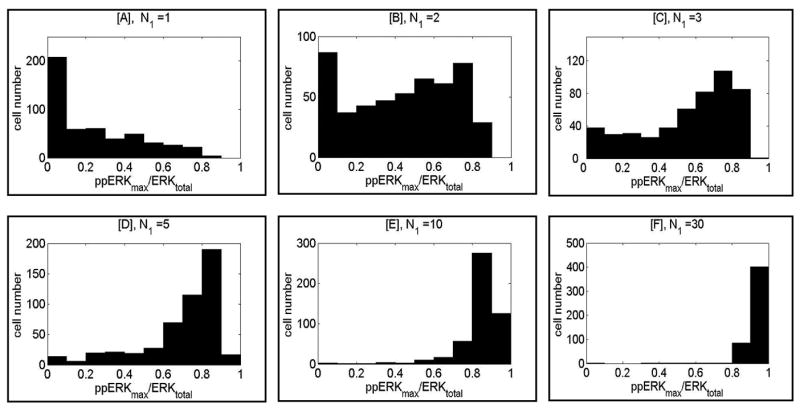
Histograms showing distribution of normalized peak ERK activity (ppERKmax/ERKtotal) in a population of M = 500 cells stimulated by different numbers of agonist peptides with dissociation rate constant d1 = 0.05/s. Panels A to F correspond to N1 = 1, 2, 3, 5, 10 or 30 peptides, respectively. In all simulations peptide stimulation started ti = 100 s and lasted for ts = 400 s.
3.3 Antagonism
It is known that antagonist peptides (peptides with a binding time of a few seconds) not only are unable to activate T cells, but also inhibit agonist peptide activation (Racioppi et al., 1996; Jameson et al., 1993). According to our model this inhibition results from activation of negative feedback mediated by pSHP rather than competition for receptors or other signaling molecules. As a result 3000 antagonist peptides (i.e., 10 times less than the total number of receptors) with a binding time of 3 s could almost completely inhibit T cell activation. As shown in Fig. 6A the optimal antagonist dissociation rate constant (d2 = dopt), i.e., the one giving the strongest inhibition, is of order of 3 s. Peptides with dissociation rate constants larger than this seldom remain bound long enough to induce negative feedback. In contrast those with dissociation rate constant smaller than dopt remain bound sufficiently long to induce also the positive feedback, and are thus stimulatory. Panels B–E in Fig. 6 show time-dependent ERK activity in individual cells costimulated by 100 agonist peptides and 0, 300, 1000 or 3000 antagonist peptides having a binding time of 3 s. This study shows that in the presence of 1000 antagonists T cell activity is highly stochastic and transient.
Fig. 6.
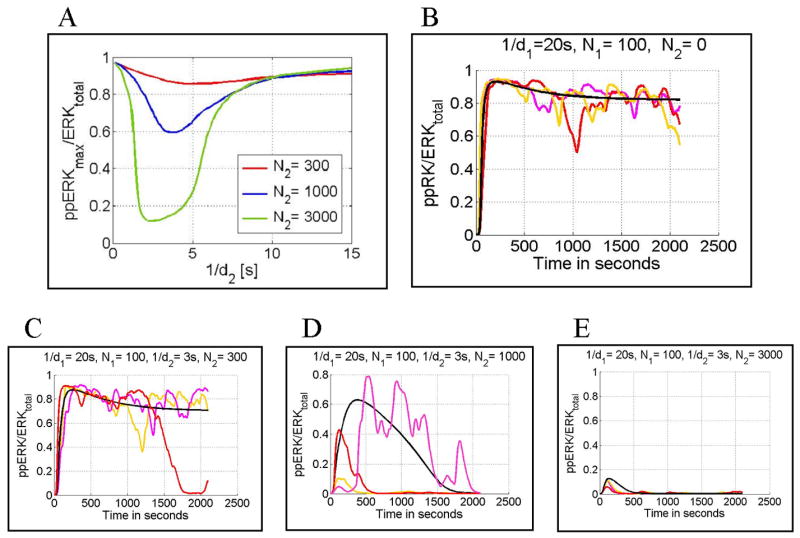
Antagonism. Panel A: normalized peak ERK activity (ppERKmax/ERKtotal) for N1 = 100 (number of agonist peptides) and d1 = 0.05/s (agonist peptide dissociation rate constant) as a function of 1/d2 (inverse antagonist peptide dissociation rate constant). The red, blue and green lines correspond to N2 = 300, 1000, 3000 (number of antagonist peptides). Panels B through E: normalized ppERK(t) calculated for N1 = 100, d1 = 0.05/s, d2 = 0.333/s and N2 = 0, 300, 1000, 3000, respectively. The black line is obtained from a deterministic simulation, whereas the red, pink, and yellow lines are obtained from stochastic simulations. In all cases, peptide stimulation started at ti = 0 s and lasted for ts = 2100 s.
3.4 Bistability, deterministic versus stochastic trajectories
The presence of negative and positive feedbacks produces bistability in the deterministic equations over a wide range of parameters. As shown in a bifurcation diagram (Fig. 7A) for each of three dissociation rate constants considered, there are two saddle-node bifurcation points in Nmin(d) and Nmax(d). Between these points the system possesses two stable solutions, one corresponding to inactive cells (ppERK/ERK < 1/10), the other corresponding to active cells (ppERK/ERK > 1/2). If the number of activating peptides N is smaller than Nmin then only the lower stable state exists, whereas for N > Nmax only the higher stable state exists. The bistability lessens the ambiguity of cellular responses because the system may more rapidly proceed from an inactive to active state as the number of activating peptides grows.
Fig. 7.
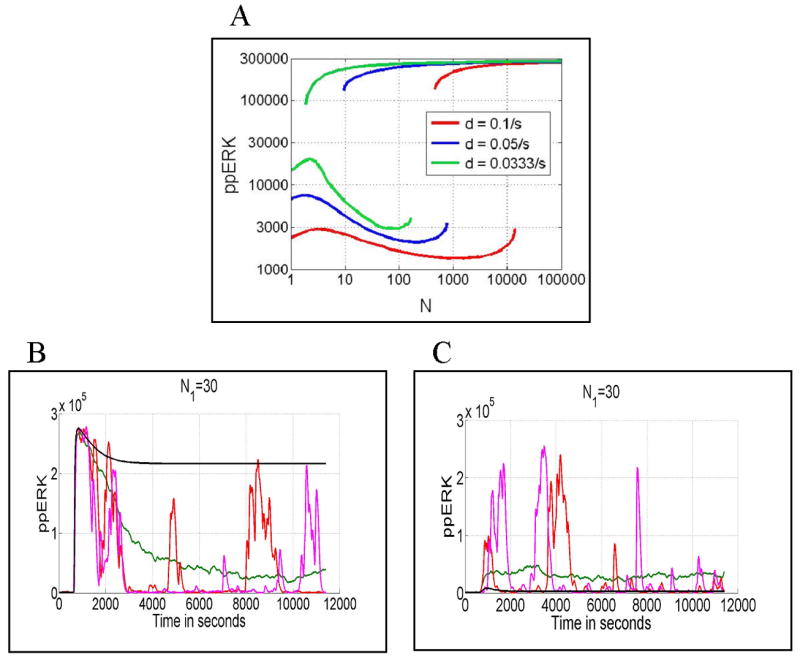
Panel A: Steady states for three different values of peptide dissociation rate constant d = 0.1/s, 0.05/s, 0.0333/s. Stable steady states for ppERK are plotted as a function of log(N), where N is the number of peptide-MHC per cell. The unstable states connecting saddle-node bifurcation points are not shown. Panels B and C: ppERK(t) calculated in deterministic (black line) and stochastic (red and pink lines) simulations, respectively for N1 = 30 and d1 = 0.05/s. In Panel B, cells are initially in a primed state (low levels of ppERK and pSHP), whereas in Panel C they are initially in an inhibited state characterized by a high level of pSHP (50 000 molecules). The green line is the average over 100 stochastic simulations. In all cases the peptide stimulation started ti = 10 min. and lasted for ts = 3 hour.
The asymptotic behavior of trajectories calculated in the deterministic approximation is determined by the initial condition. For example let us consider the case of stimulation with N1 = 30 agonist peptides per cell characterized by dissociation rate constant d1 = 0.05/s. If initially a T cell is in a primed state—a state without a history of prior peptide stimulation and characterized by a low level of ppERK (mediating positive feedback) and low level of pSHP (mediating negative feedback)—it will converge to the active state of high ppERK (Fig. 7B, black line). However, if initially a T cell is in an inhibited state characterized by a high level of inhibitory pSHP (50, 000 molecules) it will remain inactive with a low asymptotic level of ppERK (Fig. 7C, black line).
The picture changes dramatically when we consider single-cell stochastic trajectories. Due to the small number of reacting molecules (peptides) we should expect that these trajectories are substantially different from the trajectories calculated in the deterministic approximation. The quite common expectation is however that the deterministic trajectory is a good approximation of the average over many stochastic trajectories. In the case of bistable systems this expectation is not met. As shown in Figs. 7B and 7C the long time average over stochastic trajectories is not determined by the initial condition, as in the case of deterministic trajectories. This result is due to the fact that stochastic trajectories can jump between regions of attraction of the two stable steady states. In the case shown in Figs. 7B and 7C the lower steady state is more attractive than the higher one, and the trajectories remain for large t mostly in its basin of attraction. As a result the average over stochastic trajectories in Fig. 7B is much different from the deterministic trajectory converging to the higher steady state.
The approximation of the average stochastic trajectory by the deterministic one is inadequate mostly due to bistability of the system not the large magnitude of noise. As shown in Figs. 8A and 8C when the deterministic system is monostable the asymptotic behavior of the deterministic trajectory approximates the stochastic average. This result contrasts with the bistable cases shown in Figs. 7B and 8B, in which the number of activating peptides is, respectively, 30 and 100.
Fig. 8.
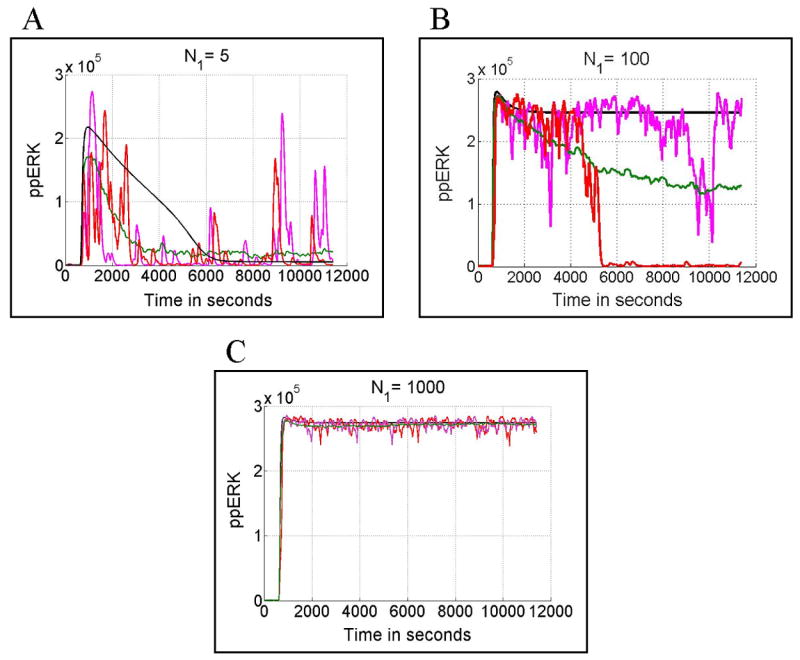
ppERK(t) calculated in deterministic (black line) and stochastic (red and pink lines) simulations, for d1 = 0.05/s and, respectively for N1 = 5 (Panel A), N1 = 100 (Panel B) and N1 = 1000 (Panel C). The green line is the average over 100 stochastic simulations. In all cases cells are initially in a primed state (low levels of ppERK and pSHP). Peptide stimulation started ti = 10 min. and lasted for ts = 3 hour.
It should be noted that our analysis of system dynamics in terms of steady states is strictly valid only under the assumption that our model accounts comprehensively for signaling events that occur over the time course required to reach a steady state. The model has been formulated to capture early membrane-proximal events in TCR signaling. Because the model omits later events, such as immunological synapse formation (Bromey et al. 2001; Lee et al. 2002) and TCR mediated internalization of peptide-MHC (Huang et al. 1999), the physiological relevance of model predictions becomes more uncertain as the time required to reach a steady state increases. However, steady-state results do reveal the long-time behavior of the system in isolation from downstream events, and they provide a starting point for future studies of the effects of these downstream events.
3.5 Sensitivity to total LCK, SHP and ERK levels
Since Lck is a necessary constituent of an active receptor complex, it is a natural expectation that a lowered total amount of Lck will result in attenuation of T cell activity. This conjecture is true when the number of activating peptides is low (Fig. 9A). However, for a high number of agonist peptides, total Lck level may decrease even 1000 fold without a substantial decrease in ERK activity (Fig. 9B). Moreover, ERK phosphorylation can proceed faster when the total number of Lck molecules is small (cf. the cases involving 103 and 105 copies of Lck in Fig. 9B). This particular behavior results from the fact that Lck mediates both positive and negative feedback. In the case where the number of stimulatory peptides is high, the higher total amount of Lck implies substantially stronger negative feedback, but not a much stronger positive one, which quickly reaches saturation.
Fig. 9.
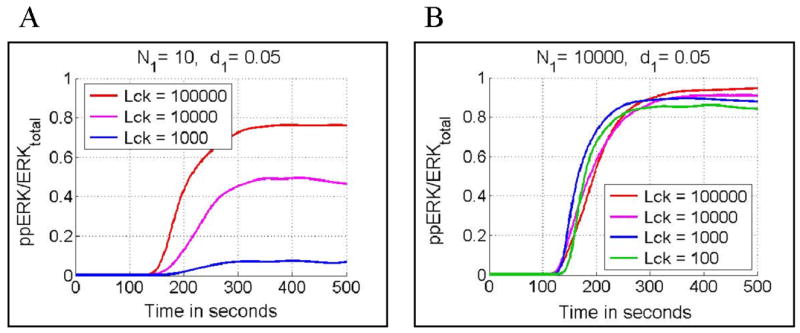
Dependence of normalized ERK activity (ppERKmax/ERKtotal) on the level of total Lck. Panel A: Stochastic simulations for N1 = 10 (number of agonist peptides), d1 = 0.05/s (agonist peptide dissociation rate constant) and three total Lck levels 105 (red), 104 (pink) and 103 (blue). Panel B: Stochastic simulations for N1 = 10000, d1 = 0.05/s and four total Lck levels 105 (red), 104 (pink), 103 (blue) and 102 (green). In all cases peptide stimulation started at ti = 100 s and lasted for ts = 400 s.
The phosphatase SHP1 mediates negative feedback and its total amount controls the strength of T cell responses (Fig. 10). A lowered total level of SHP1 results in substantially elevated ERK activity when a T cell is stimulated by peptides with a relatively short binding time (Fig. 10A). This effect can potentially be used by a T cell during maturation to calibrate discrimination potency. The analysis shown in Fig. 10A shows also that a lowered SHP1 concentration following formation of a mature synapse may allow for persistent T cell activity. As one would expect T cell sensitivity to total SHP1 level is less pronounced when the number of stimulatory peptides is low (Fig. 10B).
Fig. 10.
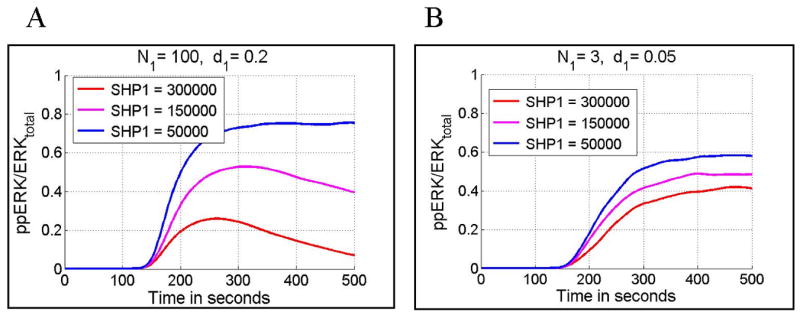
Dependence of normalized ERK activity (ppERKmax/ERKtotal) on the level of total SHP1. Panel A: Stochastic simulations for N1 = 100 (number of agonist peptides), d1 = 0.2/s (agonist peptide dissociation rate constant) and three total SHP1 levels; 3 × 10⁵ (red), 1.5 × 10⁵ (pink) and 0.5 × 10⁵ (blue). Panel B: stochastic simulations for N1 = 3, d1 = 0.05/s and three total SHP1 levels 3 × 10⁵ (red), 1.5 × 10⁵ (pink) and 0.5 × 10⁵ (blue). In all cases peptide stimulation starts at ti = 100 s and lasted for ts = 400 s.
A lowered level of total ERK results in attenuated T cell activity (Fig. 11). The effect is more pronounced for a high, rather than for a low number of activating peptides (compare Fig. 11B versus 11A). This result is due to the fact that the positive action of ERK kinase proceeds through inhibition of the negative feedback mediated by pSHP. When the number of activating peptides is low, the negative feedback is weaker and may be overcome even by a small number of ppERK molecules.
Fig. 11.
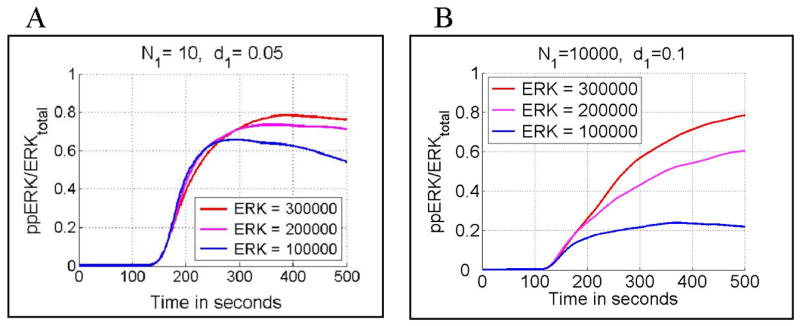
Dependence of normalized ERK activity (ppERK(t)/ERKtotal) on the level of total ERK. Panel A: Stochastic simulations for N1 = 10 (number of agonist peptides), d1 = 0.05/s (agonist peptide dissociation rate constant) and three total ERK levels; 3 × 10⁵ (red), 2 × 10⁵ (pink) and 1 × 10⁵ (blue). Panel B: Stochastic simulations for N1 = 10000, d1 = 0.1/s and three total ERK levels 3 × 10⁵(red), 2 × 10⁵ (pink) and 1 × 10⁵ (blue). In all cases the peptide stimulation started at ti = 100 s and lasted for ts = 400 s
4 Discussion
The current model extends the kinetic proofreading model introduced by McKeithan (1995), with incorporation of positive and negative feedbacks as proposed by Rabinowitz et al. (1996) and then investigated recently by Altan-Bonnet and Germain (2005) and Wylie et al. (2007). The model here is substantially simpler than the last two models (as measured by numbers of species and reactions included), but it is nevertheless useful in that it demonstrates how bistability allows for committed decisions in the face of noisy signals. Its simplicity aids in analysis, facilitating stochastic simulations that demonstrate qualitatively different kinetics than the kinetics predicted in the deterministic approximation. Bistability in TCR signaling was also studied by Zheng et al. (2005) using a different model in which the number of activated TCRs is taken as the input, and the positive feedback is mediated not by ERK but by ZAP-70. We caution that some behavioral properties of our model are built into its structure. Ideally a model would be built only on our mechanistic knowledge of signal transduction and then its behavioral properties, such as ligand discrimination, would emerge. However developing such a model is a challenging task and none of the current models reach this ideal.
The model exhibits three important properties for T cell activation: high sensitivity, ability to discriminate between agonist and self peptides, and antagonism — inhibition of cell activity in the presence of antagonist peptides. As shown in Fig. 5, three agonist peptides (with an expected binding time of 20 s) are in most cases sufficient to trigger massive ERK activation. The ability to discriminate peptides based on their expected binding time is documented in Figs. 3 and 4 where we showed that 106 peptides with an expected binding time of 3 s may not trigger cell activity, whereas the presence of 10 peptides with an expected binding time of 14 s results in high ERK activity. In Fig. 6 we showed that the presence of antagonist peptides (with a binding time of a few seconds) inhibits T cell activation. This inhibition is due to activation of negative feedback by the antagonist ligands, and not competition between agonists and antagonists for free receptors.
T cell sensitivity to MHC stimulation is controlled by the phosphatase SHP1 and kinase ERK, which governs negative and positive feedbacks. A low total level of SHP1 results in higher T cell sensitivity, whereas a lowered level of ERK causes lower T cell sensitivity. Both effects can potentially be used during T cell maturation to calibrate discrimination potency. Since Lck mediates both positive and negative feedback, the system response to a lowered total level of Lck is more complex; when the number of activating peptides is small, low total Lck level implies low signal, however at a high number of activating peptides, lower total Lck level causes a faster T cell response, of unchanged strength. This somewhat paradoxical effect was observed by Methi et al. (2005), who partially knocked down Lck using short interfering RNA and observed augmented T cell responses.
Since T cell activation is due to a small number of foreign peptides, T cell responses are highly stochastic. This situation is similar to the case of NF-κB responses stimulated by low doses of TNFα, where we showed that noise at the level of receptor activation causes single cell responses to be much different from the average trajectory (Lipniacki et al., 2007). The stochasticity means that cells do not follow their deterministic trajectories converging to a steady state, but may occasionally jump between the basins of attraction of two possible states. For example, in the case of Fig. 7B, stochastic noise causes a transition from a higher stable state to a lower one (corresponding to cell inactivation), and then most cells are transiently trapped in the basin of attraction of the lower steady state. As a result the average over a large number of stochastic trajectories is qualitatively different from the deterministic trajectory, and the difference is caused by bistability rather than the large magnitude of noise.
The interplay between negative and positive feedback causes bistability. As shown in Fig. 7, for an intermediate number of activating peptides, the system has two stable steady states, one with a low and the other with a high level of active ERK. The second state may be interpreted as a cytotoxic state that allows killer T cells to initiate death of an antigen-presenting cell. Since killer T cells decide the fate of scanned cells, their bistability provides a way to minimize ambiguity in cell fate. Poorly defined T cell responses to signal could result in damage of the scanned cell, which could possibly be worse than killing an innocent bystander cell. One can potentially observe the interplay between bistability and stochasticity in experiments. Bistability of the system manifests as sensitivity of a cell's response to its initial state, whereas stochastic noise allows a cell to forget its initial state. In Fig. 12 we showed that cells that are inhibited by antagonist pre-stimulation are not responsive to subsequent agonist stimulation, whereas cells that are stimulated by a mixture of agonist and antagonist peptides show strong ERK activation. This model prediction can perhaps be used to test for the existence of bistability in TCR signaling experimentally.
Fig. 12.
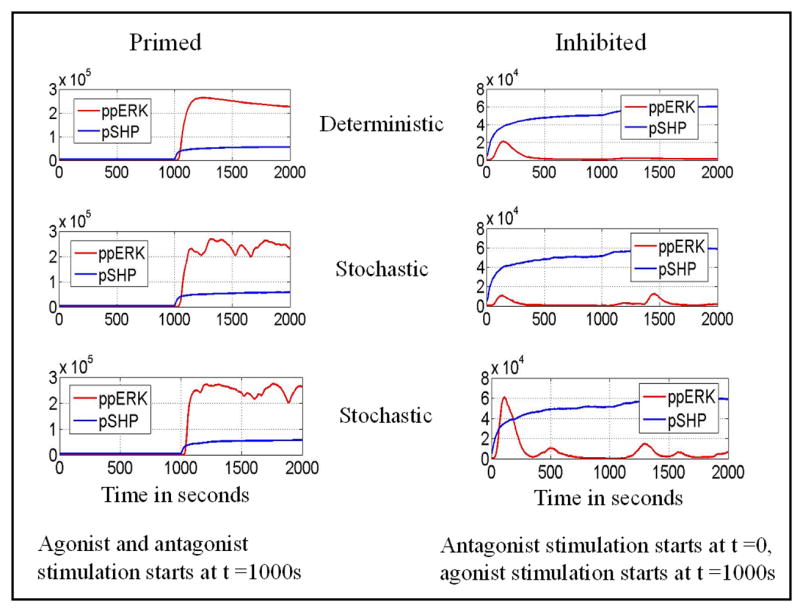
Consequences of bistability. Left column: Cells are stimulated by a mixture of agonist (N1 = 100, d1 = 0.05/s) and antagonist (N2 = 300, d2 = 0.333/s) peptides at time ts = 1000 s. Right column: Cells are inhibited by antagonist (N2 = 300, d2 = 0.333/s) stimulation starting at time ti = 0, and then at time ts = 1000 s agonist (N1 = 100, d1 = 0.05/s) peptides are added. One deterministic (first row) and two stochastic simulations (second and third row) are shown. Notice the different vertical scales for the left and right columns.
4.1 Parameters
Values of coefficients b1, b2, lb, ly1, ls2, s1, z1, m1, e1 are given based on numbers of corresponding molecules. For example e1 = (5/ERK)/s implies that each ppMEK molecule may phosphorylate at most 5 ERK molecules per second. These coefficients are kept constant in all simulations including those presented in Figs. 9, 10 and 11, in which the dependence of cell activity on the total amounts of Lck, SHP1 and ERK is studied.
4.2 Equations
| (1) |
| (2) |
| (3) |
| (4) |
| (5) |
| (6) |
| (7) |
| (8) |
| (9) |
| (10) |
| (11) |
| (12) |
| (13) |
| (14) |
| (15) |
| (16) |
| (17) |
| (18) |
| (19) |
| (20) |
| (21) |
| (22) |
| (23) |
| (24) |
| (25) |
| (26) |
| (27) |
| (28) |
| (29) |
| (30) |
| (31) |
| (32) |
| (33) |
| (34) |
| (35) |
| (36) |
| (37) |
4.3 Numerical implementation and simulation protocols
Two kinds of numerical simulations were performed. In the deterministic approximation Eqs. (1)–(37) were solved using the fourth order MATLAB solver. The stochastic simulations were performed using the Gillespie (1977) algorithm. We also encoded the model in the BioNetGen™ language (Faeder et al., 2005a; Blinov et al., 2006), which enables automatic building (and solution) of ODEs based on specified reaction rules that serve as generators of chemical reactions. This formal model specification can be used for future work as the BioNetGen™ software allows for simulations of systems of thousands of reactions (Blinov et al., 2004; Faeder et al., 2005b). We found that the stochastic simulations performed using BioNetGen™ are more than 10 times faster than in MATLAB.
The initial condition at t = 0 for both stochastic and deterministic simulations was obtained by running a deterministic simulation (for 10 h) in the absence of any MHC (the only exception was in simulations shown in Fig. 7C, where the initial condition was modified by setting pSHP = 50, 000). Then, still without any MHC present the deterministic or stochastic simulations were run from time t = 0 to time ti. Subsequently, at time ti the levels of free MHC1 and MHC2 were set to the level specified in each figure, and then the simulation was run for the specified time ts.
Stable steady states, shown in Fig. 7A, were determined as asymptotic states of the deterministic simulations. In the case of bistability, to obtain both steady states, different initial conditions were used; a high initial level of pSHP causes the system to converge to the steady state with low ppERK, whereas high initial levels pZAP, ppMEK and ppERK cause the system to converge to the steady state with high ppERK.
Table 1.
Parameters and definitions.
| Symbol | Values | Units | Description/Reaction | Comments |
|---|---|---|---|---|
| N1 | total number of MHC1 (bound + free) | various N1 are considered | ||
| N2 | total number of MHC2 (bound + free) | various N2 are considered | ||
| TCR | 3 × 10⁴ | total number of TCR molecules | in all simulations | |
| LCK | 105 | total number of Lck molecules | except for Fig. 9 | |
| ZAP | 105 | total number of ZAP molecules | in all simulations | |
| MEK | 105 | total number of MEK molecules | in all simulations | |
| ERK | 3 × 10⁵ | total number of ERK molecules | except for Fig. 11 | |
| SHP | 3 × 10⁵ | total number of SHP1 molecules | except for Fig. 10 | |
| b1 | 0.3/TCR | s−1 | TCR + MHC1 → TCR|MHC1 | |
| b2 | 0.3/TCR | s−1 | TCR + MHC2 → TCR|MHC2 | |
| d1 | s−1 | MHC1 dissociation from any TCR complex | various d1 are considered 1 | |
| d2 | s−1 | MHC2 dissociation from any TCR complex | various d2 are considered 1 | |
| lb | 0.3/LCK | s−1 | LCK +TCR|MHC → LCK|TCR|MHC | |
| ly1 | 5/SHP | s−1 | pSHP binding to TCR complex | 2 |
| ly2 | 0.3 | s−1 | LCK(s)|TCR|MHC → LCKy(s)|TCR|MHC | |
| ls1 | 0.1 | s−1 | LCK(y)s → LCK(y) | |
| ls2 | 0.5/ERK | s−1 | ppERK + LCK(y)→ ppERK+LCK(y)s | 3 |
| s0 | 10−5 | s−1 | SHP → pSHP | |
| s1 | 30/SHP | s−1 | LCKy + SHP → pSHP +LCKy, | |
| s2 | 0.0006 | s−1 | pSHP → SHP | 4 |
| s3 | 0.05 | s−1 | pSHP dissociation from TCR complex | |
| tp | 0.05 | s−1 | LCKy(s)|TCR|MHC → LCKy(s)|pTCR|MHC | |
| tp | 0.05 | s−1 | LCKy(s)|pTCR|MHC → LCKy(s)|ppTCR|MHC | |
| z0 | 2 × 10⁻⁶ | s−1 | ZAP → pZAP | |
| z1 | 5/ZAP | s−1 | ppTCR + ZAP → ppTCR+pZAP | |
| z2 | 0.02 | s−1 | pZAP → ZAP | |
| m1 | 5/MEK | s−1 | pZAP+MEK → pZAP+pMEK | |
| m1 | 5/MEK | s−1 | pZAP+pMEK → pZAP+ppMEK | |
| m2 | 0.02 | s−1 | pMEK → MEK and ppMEK → pMEK | |
| e1 | 5/ERK | s−1 | ppMEK+ERK → ppMEK+pERK | |
| e1 | 5/ERK | s−1 | ppMEK+pERK → ppMEK+ppERK | |
| e2 | 0.02 | s−1 | pERK → ERK and ppERK → pERK |
peptide-MHC dissociation from TCR complex results in immediate dephosphorylation and dissociation of LCK(s)(y) and p(p)TCR dephosphorylation.
pSHP may not bind to TCR complexes containing LCKs(y) because phosphorylation of S59 in LCK prevents pSHP binding. Binding of pSHP to the TCR complex results in immediate dephosphorylation of LCKy and p(p)TCR.
ppERK only interacts with LCK(y) associated with TCR complex in the absence of pSHP.
pSHP dephosphorylation results in its immediate dissociation from TCR complex.
Acknowledgments
TL and BH were supported by Polish Committee for Scientific Research Grants No. 4 T07A 001 30 and 3 T11A 019 29. JRF was supported by the Department of Computational Biology at the University of Pittsburgh and by NIH grant GM76570. WSH was supported by NIH grant GM76570 and by the Department of Energy through contract DE-AC52-06NA25396. We thank the Center for Nonlinear Studies at Los Alamos National Laboratory for supporting the visit of TL to Los Alamos.
Appendix. Details of the model
Proteins and complexes
Each yi stands for the number of molecules (complexes) of a given species per T cell.
Membrane complexes
y1 – free MHC1 (agonist peptide – major histocompatibility complex)
y2 – TCR|MHC1
y3 – LCK|TCR|MHC1
y4 – LCKs|TCR|MHC1
y5 – LCKy|TCR|MHC1
y6 – LCKsy|TCR|MHC1
y7 – LCKy|pTCR|MHC1
y8 – LCKsy|pTCR|MHC1
y9 – LCKy|ppTCR|MHC1
y10 – LCKsy|ppTCR|MHC1
y11 – free MHC2 (antagonist or endogenous peptide – major histocompatibility complex)
y12 – TCR|MHC2
y13 – LCK|TCR|MHC2
y14 – LCKs|TCR|MHC2
y15 – LCKy|TCR|MHC2
y16 – LCKsy|TCR|MHC2
y17 – LCKy|pTCR|MHC2
y18 – LCKsy|pTCR|MHC2
y19 – LCKy|ppTCR|MHC2
y20 – LCKsy|ppTCR|MHC2
y21 – free TCR
y22 – pSHP|TCR
y23 – pSHP|TCR|MHC1
y24 – pSHP|LCK|TCR|MHC1
y25 – pSHP|TCR|MHC2
y26 – pSHP|LCK|TCR|MHC2
Cytosolic proteins
y27 – LCK
y28 – SHP
y29 – pSHP
y30 – ZAP
y31 – pZAP
y32 – MEK
y33 – pMEK
y34 – ppMEK
y35 – ERK
y36 – pERK
y37 – ppERK
To keep our model as simple as possible we assumed that some processes, expected to be fast, are immediate. This substantially reduces the numbers of chemical species and equations. For example, we assume that MHC dissociation causes immediate dissociation and dephosphorylation of LCK(s)(y) and dephosphorylation of p(p)TCR. This assumption means that a number of unstable intermediate complexes (i.e., LCK|TCR, LCKs|TCR, LCKy|TCR, LCKsy|TCR, LCKy|pTCR, LCKsy|pTCR, LCKy|ppTCR, LCKsy|ppTCR, pSHP|LCK|TCR) are removed from the mathematical representation of the model. Similarly, we assume, that binding of pSHP to the TCR complex results in immediate dephosphorylation of LCK(s)(y) and p(p)TCR, which further reduces the number of considered complexes such that there are no complexes containing pSHP and phosphorylated forms of Lck or TCR in the model.
Footnotes
The MATLAB programs written to perform simulations are available at our website http://www.ippt.gov.pl/∼tlipnia/.
The model presented in this paper is also available as a BioNetGen™ input file, which can be downloaded from the website http://bionetgen.org.
Publisher's Disclaimer: This is a PDF file of an unedited manuscript that has been accepted for publication. As a service to our customers we are providing this early version of the manuscript. The manuscript will undergo copyediting, typesetting, and review of the resulting proof before it is published in its final citable form. Please note that during the production process errors may be discovered which could affect the content, and all legal disclaimers that apply to the journal pertain.
References
- Altan-Bonnet G, Germain RN. Modeling T cell antigen discrimination based on feedback control of digital ERK responses. PLoS Biology. 2005;3:1925–1938. doi: 10.1371/journal.pbio.0030356. [DOI] [PMC free article] [PubMed] [Google Scholar]
- Artyomov MN, Das J, Kardar M, Chakraborty AK. Purely stochastic binary decisions in cell signaling models without underlying deterministic bistabilities. Proc Natl Acad Sci U S A. 2007;104:18958–18963. doi: 10.1073/pnas.0706110104. [DOI] [PMC free article] [PubMed] [Google Scholar]
- Blinov ML, Faeder JR, Goldstein B, Hlavacek WS. BioNetGen: software for rule-based modeling of signal transduction based on the interactions of molecular domains. Bioinformatics. 2004;20:3289–3291. doi: 10.1093/bioinformatics/bth378. [DOI] [PubMed] [Google Scholar]
- Blinov ML, Yang J, Faeder JR, Hlavacek WS. Graph theory for rule-based modeling of biochemical networks. Lect Notes Comput Sci. 2006;4230:89–106. [Google Scholar]
- Bromley SK, Burack WR, Johnsonn KG, Somersalo K, Sims TN, Sumen C, Davis MM, Shaw AS, Allen PM, Dustint ML. The immunological synapse. Annu Rev Immunol. 2001;19:375–396. doi: 10.1146/annurev.immunol.19.1.375. [DOI] [PubMed] [Google Scholar]
- Burroughs NJ, Lazic Z, van der Merwe PA. Ligand detection and discrimination by spatial relocalization: a kinase-phosphatase segregation model of TCR activation. Biophys J. 2006;91:1619–1629. doi: 10.1529/biophysj.105.080044. [DOI] [PMC free article] [PubMed] [Google Scholar]
- Burroughs NJ, van der Merwe PA. Stochasticity and spatial heterogeneity in T-cell activation. Immunol Rev. 2007;216:69–80. doi: 10.1111/j.1600-065X.2006.00486.x. [DOI] [PubMed] [Google Scholar]
- Chan AC, Desai DM, Weiss A. The role of protein tyrosine kinases and protein tyrosine phosphatases in T cell antigen receptor signal transduction. Annu Rev Immunol. 1994;12:555–592. doi: 10.1146/annurev.iy.12.040194.003011. [DOI] [PubMed] [Google Scholar]
- Chan C, George AJT, Stark J. Cooperative enhancement of specificity in a lattice of T cell receptors. Proc Nat Acad Sci USA. 2001;98:5758–5763. doi: 10.1073/pnas.101113698. [DOI] [PMC free article] [PubMed] [Google Scholar]
- Chu DH, Morita CT, Weiss A. The Syk family of protein tyrosine kinases in T-cell activation and development. Immunol Rev. 1998;165:167–180. doi: 10.1111/j.1600-065x.1998.tb01238.x. [DOI] [PubMed] [Google Scholar]
- Chiang GG, Sefton BM. Specific dephosphorylation of the Lck tyrosine protein kinase at Tyr-394 by the SHP-1 protein-tyrosine phosphatase. J Biol Chem. 2001;276:23173–23178. doi: 10.1074/jbc.M101219200. [DOI] [PubMed] [Google Scholar]
- Choudhuri K, van der Merwe PA. Molecular mechanisms involved in T cell receptor triggering. Semin Immunol. 2007;19:255–261. doi: 10.1016/j.smim.2007.04.005. [DOI] [PubMed] [Google Scholar]
- Davis MM, Jay Boniface J, Reich Z, Lyons D, Hampl J, Arden B, Chien YH. Ligand recognition by αβ T cell receptors. Annu Rev Immunol. 1998;16:523–544. doi: 10.1146/annurev.immunol.16.1.523. [DOI] [PubMed] [Google Scholar]
- Evavold BD, Sloan-Lancaster J, Allen PM. Antagonism of superantigen-stimulated helper T-cell clones and hybridomas by altered peptide ligand. Proc Nat Acad Sci USA. 1994;91:2300–2304. doi: 10.1073/pnas.91.6.2300. [DOI] [PMC free article] [PubMed] [Google Scholar]
- Faeder JR, Blinov ML, Hlavacek WS. Graphical rule-based representation of signal-transduction networks. In: Liebrock LM, editor. Proc 2005 ACM Symp Appl Computing; New York, NY: ACM Press; 2005a. pp. 133–140. [Google Scholar]
- Faeder JR, Blinov ML, Goldstein B, Hlavacek WS. Rule-based modeling of biochemical networks. Complexity. 2005b;10:22–41. [Google Scholar]
- George AJT, Stark J, Chan C. Understanding specificity and sensitivity of T-cell recognition. Trends Immunol. 2005;26(12):653–659. doi: 10.1016/j.it.2005.09.011. [DOI] [PubMed] [Google Scholar]
- Germain RN, Štefanová I. The dynamics of T cell receptor signaling: Complex orchestration and the key roles of tempo and cooperation. Annu Rev Immunol. 1999;17:467–522. doi: 10.1146/annurev.immunol.17.1.467. [DOI] [PubMed] [Google Scholar]
- Gillespie DT. Exact stochastic simulations of coupled chemical reactions. J Phys Chem. 1977;81:2340–2361. [Google Scholar]
- Huang JF, Yang Y, Sepulveda H, Shi W, Hwang I, Peterson PA, Jackson MR, Sprent J, Cai Z. TCR-mediated internalization of peptide-MHC complexes acquired by T cells. Science. 1999;286:952–954. doi: 10.1126/science.286.5441.952. [DOI] [PubMed] [Google Scholar]
- Irvine DJ, Purbhoo MA, Krogsgaard M, Davis MM. Direct observation of ligand recognition by T cells. Nature. 2002;419:845–849. doi: 10.1038/nature01076. [DOI] [PubMed] [Google Scholar]
- Goldstein B, Faeder JR, Hlavacek WS. Mathematical and computational models of immune-receptor signalling. Nat Rev Immunol. 2004;4:445–456. doi: 10.1038/nri1374. [DOI] [PubMed] [Google Scholar]
- Goldstein B, Coombs D, Faeder JR, Hlavacek WS. Kinetic proofreading model. In: Sigalov AB, editor. Multichain Immune Recognition Receptor Signaling: From Spatiotemporal Organization to Human Disease. Ch 8. Landes Bioscience; Austin, TX: 2008. [Google Scholar]
- Jameson SC, Carbone FR, Bevan MJ. Clone-specific T cell receptor antagonists of major histocompatibility complex class I-restricted cytotoxic T cells. J Exp Med. 1993;177:1541–1550. doi: 10.1084/jem.177.6.1541. [DOI] [PMC free article] [PubMed] [Google Scholar]
- Kersh GJ, Kersh EN, Fremont DH, Allen PM. High- and low-potency ligands with similar affinities for the TCR: The importance of kinetics in TCR signaling. Immunity. 1998;9:817–826. doi: 10.1016/s1074-7613(00)80647-0. [DOI] [PubMed] [Google Scholar]
- Krogsgaard M, Juang J, Davis MM. A role for “self” in T-cell activation. Semin Immunol. 2007;19:236–244. doi: 10.1016/j.smim.2007.04.003. [DOI] [PMC free article] [PubMed] [Google Scholar]
- Kuhns MS, Davis MM, Garcia KG. Deconstructing the form and function of the TCR/CD3 complex. Immunity. 2006;24:133–139. doi: 10.1016/j.immuni.2006.01.006. [DOI] [PubMed] [Google Scholar]
- Lee KH, Holdorf AD, Dustin ML, Chan AC, Allen PM, Shaw AS. T cell receptor signaling precedes immunological synapse formation. Science. 2002;295:1539–1542. doi: 10.1126/science.1067710. [DOI] [PubMed] [Google Scholar]
- Li QJ, Dinner AR, Qi S, Irvine DJ, Huppa JB, Davis MM, Chakraborty AK. CD4 enhances T cell sensitivity to antigen by coordinating Lck accumulation at the immunological synapse. Nat Immunol. 2004;5:791–799. doi: 10.1038/ni1095. [DOI] [PubMed] [Google Scholar]
- Lipniacki T, Puszynski K, Paszek P, Brasier AR, Kimmel M. Single TNFα trimers mediating NF-κB activation: Stochastic robustness of NF-κB signaling. BMC Bioinformatics. 2007;8:376. doi: 10.1186/1471-2105-8-376. [DOI] [PMC free article] [PubMed] [Google Scholar]
- Lorenz U, Ravichandran KS, Pei D, Walsh CT, Burakoff SJ, Neel BG. Lck dependent tyrosyl phosphorylation of the phosphotyrosine phosphatase SH-PTP1 in murine T cells. Mol Cell Biol. 1994;14:1824–1834. doi: 10.1128/mcb.14.3.1824. [DOI] [PMC free article] [PubMed] [Google Scholar]
- McKeithan TW. Kinetic proofreading in T cell receptor signal transduction. Proc Natl Acad Sci USA. 1995;92:5042–5046. doi: 10.1073/pnas.92.11.5042. [DOI] [PMC free article] [PubMed] [Google Scholar]
- Ma Z, Sharp KA, Janmey PA, Finkel TH. Surface-anchored monomeric agonist pMHCs alone trigger TCR with high sensitivity. PLoS Biol. 2008;6(2):e43. doi: 10.1371/journal.pbio.0060043. [DOI] [PMC free article] [PubMed] [Google Scholar]
- Methi T, Ngai J, Mahic M, Amarzguioui M, Vang T, Tasken K. Short-interfering RNA-mediated Lck knockdown results in augmented downstream T cell responses. J Immunol. 2005;175:7398–7406. doi: 10.4049/jimmunol.175.11.7398. [DOI] [PubMed] [Google Scholar]
- Purbhoo MA, Irwine DJ, Huppa JB, Davis MM. T cell killing does not require the formation of a stable mature immunological synapse. Nat Immunol. 2004;5:524–530. doi: 10.1038/ni1058. [DOI] [PubMed] [Google Scholar]
- Rabinowitz JD, Beeson C, Lyons DS, Davis MM, McConnell HM. Kinetic discrimination in T cell activation. Proc Natl Acad Sci USA. 1996;93:1401–1405. doi: 10.1073/pnas.93.4.1401. [DOI] [PMC free article] [PubMed] [Google Scholar]
- Racioppi L, Matarese G, D'Oro U, De Pascale M, Masci AM, Fontana S, Zappacosta S. The role of CD4-Lck in T cell receptor antagonism: evidence for negative signaling. Proc Natl Acad Sci USA. 1996;93:10360–10365. doi: 10.1073/pnas.93.19.10360. [DOI] [PMC free article] [PubMed] [Google Scholar]
- Iwashima M, Irving BA, Show, Van Oers NSC, Chan AC, Weiss A. Sequential interactions of the TCR with two distinct cytoplasmic tyrosine kinases. Science. 1994;263:1136–1139. doi: 10.1126/science.7509083. [DOI] [PubMed] [Google Scholar]
- Štefanová I, Henner B, Vergelli M, Martin R, Biddison WE, Germain RN. TCR ligand discrimination is enforced by competing ERK positive and SHP-1 negative feedback pathway. Nat Immunol. 2003;4:248–254. doi: 10.1038/ni895. [DOI] [PubMed] [Google Scholar]
- Veillette A, Bookman MA, Horak EM, Samelson LE, Bolen JB. Signal transduction through the CD4 receptor involves the activation of the internal membrane tyrosine-protein kinase p56(lck) Nature. 1989;338:257–259. doi: 10.1038/338257a0. [DOI] [PubMed] [Google Scholar]
- Veillette A, Fournel M. The CD4 associated tyrosine protein kinase p56(lck) is positively regulated through its site of autophosphorylation. Oncogene. 1990;5:1455–1462. [PubMed] [Google Scholar]
- Wedagedera JR, Burroughs NJ. T-Cell Activation: A Queuing Theory Analysis at Low Agonist Density. Biophys J. 2006;91:1604–1618. doi: 10.1529/biophysj.105.066001. [DOI] [PMC free article] [PubMed] [Google Scholar]
- Wylie DC, Das J, Chakraborty AK. Sensitivity of T cells to antigen and antagonism emerges from differential regulation of the same molecular signaling module. Proc Natl Acad Sci USA. 2007;104:5533–5538. doi: 10.1073/pnas.0611482104. [DOI] [PMC free article] [PubMed] [Google Scholar]
- Yamaguchi H, Hendrickson WA. Structural basis for activation of human lymphocyte kinase Lck upon tyrosine phosphorylation. Nature. 1996;384:484–489. doi: 10.1038/384484a0. [DOI] [PubMed] [Google Scholar]
- Zheng Y, Balakrishnan V, Buzzard G, Geahlen R, Harrison M, Rundell A. Modeling and analysis of early events in T-lymphocyte antigen-activated intracellular-signaling pathways. J Comp Appl Math. 2005;184:320–341. [Google Scholar]