

Abstract
Background:
MRI studies have demonstrated differential rates of atrophy in the entorhinal cortex and hippocampus during the prodromal phase of Alzheimer disease (AD). The current study was designed to determine whether a broader set of temporoparietal regions show differential rates of atrophy during the evolution of AD.
Methods:
Sixteen regions of interest (ROIs) were analyzed on MRI scans obtained at baseline and follow-up in 66 subjects comprising three groups: controls = individuals who were cognitively normal at both baseline and follow-up; nonconverters = subjects with mild cognitive impairment (MCI) at both baseline and follow-up; converters had MCI at baseline but had progressed to AD at follow-up.
Results:
Annualized percent change was analyzed with multivariate analysis of variance (MANOVA), covaried for age. The MANOVA demonstrated an effect of group (p = 0.004). Post hoc comparisons demonstrated greater rates of atrophy for converters vs nonconverters for six ROIs: hippocampus, entorhinal cortex, temporal pole, middle temporal gyrus, fusiform gyrus, and inferior temporal gyrus. Converters showed differentially greater rates of atrophy than controls in five of the same ROIs (and inferior parietal lobule). Rates of change in clinical status were correlated with the atrophy rates in these regions. Comparisons between controls and nonconverters demonstrated no differences.
Conclusion:
These results demonstrate that temporoparietal regions show differential rates of atrophy on MRI during prodromal Alzheimer disease (AD). MRI data correlate with measures of clinical severity and cognitive decline, suggesting the potential of these regions of interest as antemortem markers of prodromal AD.
GLOSSARY
- AD
= Alzheimer disease;
- APC
= annualized percent change;
- CDR-SB
= Clinical Dementia Rating Sum of Boxes;
- CVLT
= California Verbal Learning Test;
- MANOVA
= multivariate analysis of variance;
- MCI
= mild cognitive impairment;
- ROI
= region of interest;
- SRT
= Selective Reminding Test.
Longitudinal MRI studies have focused on volumetric changes primarily in the hippocampus and entorhinal cortex. Postmortem studies indicate that additional regions beyond hippocampus and entorhinal cortex are involved in the early phases of Alzheimer disease (AD).1–5 The few longitudinal studies examining temporoparietal changes in subjects with mild cognitive impairment (MCI) who progressed to AD found atrophy in inferior and middle temporal gyrus, posterior cingulate, and precuneus,6 and in medial temporal lobe and posterior cortical regions.7 Two studies have also demonstrated differential rates of atrophy between individuals without dementia with a dominant genetic mutation in comparison to controls in posterior cingulate, medial temporal lobe, neocortical temporoparietal regions,8 and precuneus.9
In this study, we used analysis tools to conduct an assessment of temporoparietal gray matter regions in order to determine which regions demonstrate greater rates of atrophy among individuals destined to develop AD.
Measures of clinical severity and neuropsychological performance were available on the subjects, allowing us to examine the relationship between the atrophy rates and the rate of change in the clinical status. The clinical relevance of atrophy in the MRI measures was also examined by performing power calculations to determine the sample size needed for a clinical trial that used the three regions of interest (ROIs) with the largest effect size.
METHODS
Subjects.
A total of 66 individuals were examined. The subjects were chosen from the larger population of 339 subject as being the only ones who met the clinical criteria for this study and had two MRI scans that were acquired on a 1.5T GE scanner, obtained with an SPGR sequence. Subjects were originally recruited through the print media. The details of the screening procedures have been described elsewhere.10 All subjects provided informed consent prior to the initiation of the study, in accordance with the requirements of the Human Research Committee of Massachusetts General Hospital (Boston, MA).
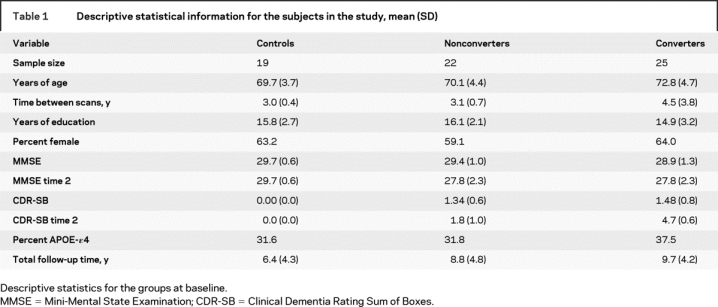
The subjects were selected to fit into three groups based upon their clinical status at baseline and follow-up: (A) control (n = 19), cognitively normal at both baseline and follow-up; (B) nonconverter (n = 22), MCI at both baseline and follow-up; (C) converter (n = 25), MCI at baseline (2 were cognitively normal at baseline), but progressed to a diagnosis of probable AD on follow-up (table 1). Nonconverters and converters showed no difference (p > 0.05) in their baseline CDR-SB scores. A comparison of baseline age showed a difference between the groups (p < 0.05). No other demographic or genetic variables differed between the groups. Data from baseline scans for 18 of the subjects have been included in prior publications related to manual ROIs.11,12
Table 1 Descriptive statistical information for the subjects in the study, mean (SD)
Assessment of clinical severity.
The degree of clinical severity was evaluated by an annual semi-structured interview that generated both an overall Clinical Dementia Rating (CDR) rating the CDR Sum of Boxes (CDR-SB).13 The mental status evaluation included the Blessed Memory and Orientation Test,14 a set of similarities and differences, calculations, and a standardized language evaluation. Mean inter-rater reliability of the CDR rating was high (r = 0.99, p < 0.0001), as was the inter-rater reliability of the 6 CDR subcategories (r = 0.90).
Annually, a consensus diagnostic process determined 1) presence of sufficient impairment for a diagnosis of dementia, and if so, 2) whether the dementia was consistent with criteria for AD15 or another entity, e.g., frontotemporal dementia, vascular dementia.16,17 Diagnoses were based on clinical history, medical records, laboratory evaluation, and neuroimaging studies (presence of infarcts). Only subjects with a diagnosis of probable AD on follow-up were included in the converter group.
Measures of clinical status.
Subjects were administered a neuropsychological battery.10 Three test scores from this battery were selected for analysis in the present study because they had previously been shown to be sensitive predictors of progression from MCI to AD.18 The three scores were total recall score on the California Verbal Learning Test (CVLT),19 free recall score on the Selective Reminding Test (SRT),20 and time to complete Trail Making Test B.21 Mean interval between acquisition of the MRI scan and the semi-structured interview was 4.7 months; mean interval between acquisition of the MRI scan and administration of the neuropsychological tests was 3.6 months.
MRI acquisition.
MRI scans were obtained at baseline and were repeated, based on a priori criteria concerning progression in level of clinical severity (i.e., subjects who crossed specific thresholds were reevaluated; those who remained stable for specific amounts of time were also reevaluated) (figure). This approach oversamples subjects who are changing the most in comparison to those who remain stable.
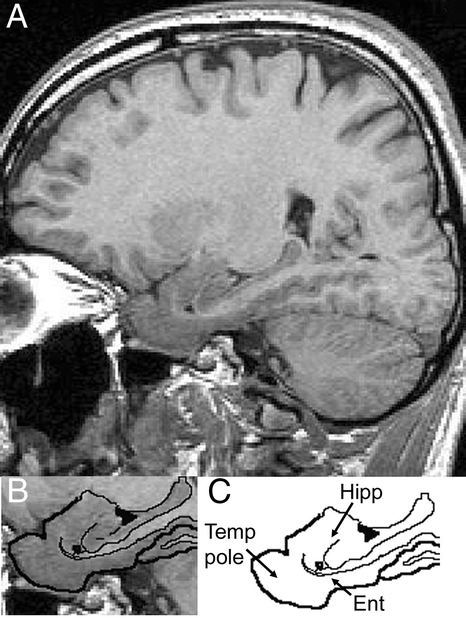
Figure Sagittal reconstructions of one MRI scan at the level of the medial temporal lobe where the temporal pole, entorhinal cortex, and hippocampus are evident
Lower left panel shows more selectively the regions of interest with the brain/tissue boundaries traced. Lower right panel shows the tracing with the structures of interest labeled. Hipp = hippocampus; Ent = entorhinal cortex; Temp Pole = temporal pole.
MRI scans were acquired on a 1.5-T scanner (General Electric, Milwaukee, WI). T1-weighted three-dimensional spoiled gradient echo (SPGR) scans were acquired using the following sequence: coronal acquisition, repetition time = 35 msec, echo time = 5 msec, field of view = 220 mm, flip angle = 45°, slice thickness = 1.5 mm, matrix size = 256 * 256 NEX = 1.
Each individual’s registered scan pair was assessed for problems of movement artifact, adequacy of scan coverage of the whole head, and change in acquisition parameters. Scan pairs were given a grading of unusable (unlikely to give a reliable estimate of volume change) or usable. Any scan pairs with a change that appeared to be due to poor scan pair quality were not included in the study.
The first MRI scan was acquired at baseline for all subjects. For controls and nonconverters, we used the follow-up scan obtained approximately 3 years after baseline. For converters, we used the scan that was obtained closest in time to the consensus diagnosis of AD.
Regions of interest.
The MRI scans were processed using the FreeSurfer software package (http://surfer.nmr.mgh.harvard.edu).22,23 The ROIs that were generated were examined for anatomic accuracy and edited by an anatomically knowledgeable operator (R.S.D.), in order to ensure that they adhered to previously published boundary definitions.24 We focused on 14 ROIs from the temporal and parietal cortices. These included 1) banks of superior temporal sulcus, 2) entorhinal cortex, 3) fusiform gyrus, 4) inferior parietal lobule, 5) inferior temporal gyrus, 6) isthmus of cingulate cortex, 7) posterior cingulate cortex, 8) middle temporal gyrus, 9) parahippocampal gyrus, 10) precuneus cortex, 11) superior parietal lobule, 12) superior temporal gyrus, 13) supramarginal gyrus, and 14) temporal pole.
The non-neocortical regions of the brain were edited by an anatomically knowledgeable operator (R.J.K.), as needed, in order to ensure that they adhered to previously published boundary definitions.12 We selected two non-neocortical ROIs: amygdala and hippocampus.
In total, 16 neocortical and non-neocortical temporoparietal ROIs were used in this study. For all of the analyses performed here, the volume of the right and the left hemispheres for each individual ROI were added together. The ROIs from the baseline scans were utilized to help identify regions on follow-up scans.25
Statistical analyses.
To account for differences in the time between MRI scans, the atrophy rate for each ROI was expressed as annualized percent change (APC), using the formula (timepoint 1 volume − timepoint 2 volume)/(timepoint 1 volume) * (time between scans) * 100. This measure has been employed in a number of previous MRI studies.26–28 The APC values for each ROI were analyzed using a multivariate analysis of variance (MANOVA), with group as a between subject variable. Since age differed between the groups at baseline, the MANOVA performed included baseline age as a covariate. In order to determine the exact nature of the difference between the groups and control for multiple comparisons, the overall MANOVA was by followed by Tukey HSD tests.29
In order to compare the magnitude of the differences among the groups in terms of rates of atrophy, effect sizes were computed for those ROIs with greater rates of atrophy on the basis of the post hoc comparisons. The effect size was measured using the Cohen d.30
The clinical relevance of these effect size calculations was evaluated by power calculations to determine the sample size needed for a theoretical clinical trial that used the three with the largest effect size. Sample size estimates needed to detect both a 25% and a 50% treatment effect were performed.31 All calculations incorporated the assumption that a clinical trial should have 90% power to detect a treatment effect, with a two-tailed 5% level of significance. Sample size estimates were recalculated to reflect a 10% loss to follow-up, and an additional 10% loss of MRI scans. Similar estimates were calculated for the CDR-Sum of Boxes and the Selective Reminding Test.
Correlation coefficients were used to examine the relationship between rates of atrophy in the ROIs and rates of change in the measures of clinical status for the subjects who were MCI at baseline. Spearman rank correlation coefficients32 were utilized. In order to account for multiple comparisons a p value of ≤0.01 was used for interpreting statistical significance.
RESULTS
Table 2 presents the mean APC for each of the ROIs. The MANOVA revealed an effect of group (Wilks’ lambda = 2.04, df = 32, p = 0.004). Post hoc comparisons demonstrated that six ROIs were different between converters and nonconverters: hippocampus (p < 0.001), temporal pole (p < 0.001), entorhinal cortex (p < 0.01), fusiform gyrus (p < 0.01), middle temporal gyrus (p < 0.01), and inferior temporal gyrus (p < 0.01). Post hoc comparisons between converters and controls demonstrated that six ROIs were different, including hippocampus (p < 0.001), entorhinal cortex (p < 0.001), temporal pole (p < 0.001), middle temporal gyrus (p < 0.01), fusiform gyrus (p < 0.01), and inferior parietal lobule (p < 0.05). None of the 16 ROIs proved to be different in the comparisons between controls and nonconverters.
Table 2 Annualized percent change for 16 temporoparietal regions of interest in the three groups, mean (SD)
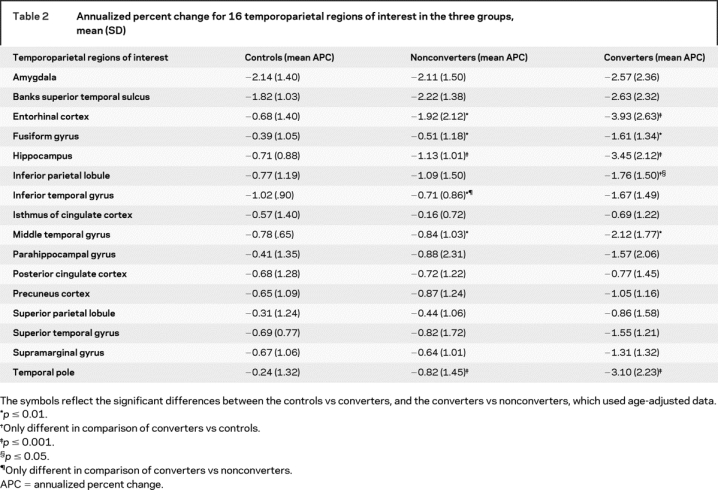
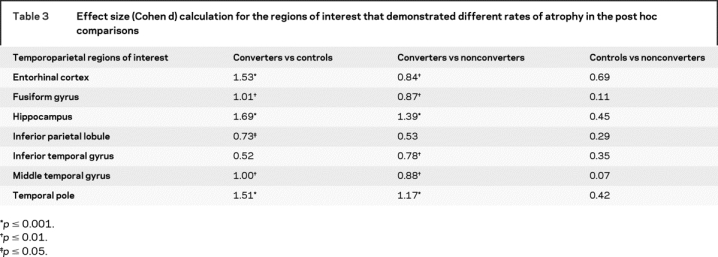
Table 3 shows the effect size calculations for each ROI with a significant APC, based on the post hoc comparisons (d values greater than 0.73 correspond to an effect size of p < 0.05). Between converters and controls, large effects were observed for hippocampus (d = 1.69), entorhinal cortex (d = 1.53), temporal pole (d = 1.51), fusiform gyrus (d = 1.01), and middle temporal gyrus (d = 1.0). Between converters and nonconverters, large effects were observed for hippocampus (d = 1.39), temporal pole (d = 1.17), middle temporal gyrus (d = 0.88), fusiform gyrus (d = 0.87), and entorhinal cortex (d = 0.84).
Table 3 Effect size (Cohen d) calculation for the regions of interest that demonstrated different rates of atrophy in the post hoc comparisons
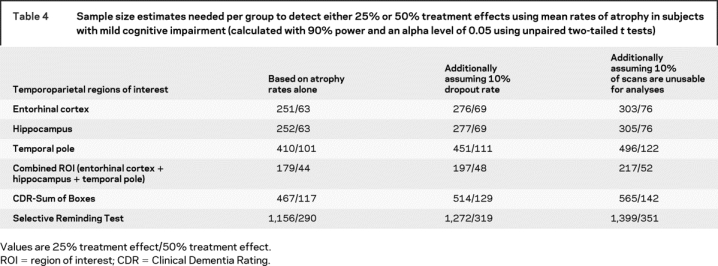
We calculated sample size estimates needed to detect 25% and 50% reduction for the ROIs that demonstrated the largest effect size for comparison of controls vs converters (i.e., entorhinal cortex, hippocampus, temporal pole). Estimates were calculated for each ROI individually and for a ROI that combined the three. All subjects categorized as MCI at baseline were included in the analysis. The estimated sample sizes were smaller for the three ROIs in combination than for any of the ROIs individually (table 4). Moreover, the sample size estimates for each MRI-based ROI were notably smaller than any clinical or cognitive measures.
Table 4 Sample size estimates needed per group to detect either 25% or 50% treatment effects using mean rates of atrophy in subjects with mild cognitive impairment (calculated with 90% power and an alpha level of 0.05 using unpaired two-tailed t tests)
For the correlations between the ROIs that differed and the annualized change in clinical measures, all of the ROIs, except the inferior parietal lobule, demonstrated a strong relationship (hippocampus [r = −0.52, p = 0.001], entorhinal cortex [r = −0.51, p = 0.001], temporal pole [r = −0.47, p = 0.001], and middle temporal gyrus [r = −0.46, p = 0.002]) with CDR-SB. With CVLT, only hippocampus (r = 0.44, p = 0.003) showed a relationship. With SRT, none of the ROIs showed a relationship. With Trails B, only entorhinal cortex showed a relationship (r = −0.37, p = 0.01).
DISCUSSION
Results show that specific temporal and parietal cortices have greater rates of atrophy in MCI subjects who progress to AD within 4–5 years than controls who remain cognitively normal and MCI subjects who do not progress to AD within this time frame. Three regions that were most discriminate were hippocampus, entorhinal cortex, and temporal pole. Of clinical interest, atrophy rates in these regions correlated with changes in clinical severity and declines in cognition. Utilizing the atrophy rate from a combined measure of these regions reduced the estimated sample size needed for a clinical trial in MCI.
The hippocampal APC had the largest effect size overall. The entorhinal cortex had a large effect size in comparison of controls vs converters. These findings corroborate reported progressive atrophy in these medial temporal regions in the evolution of AD.33
These results emphasize the importance of other regions within the temporal and parietal lobes as antemortem markers of AD. In particular, atrophy within the temporal pole has not been previously reported. Additional regions as markers of AD include fusiform gyrus and middle temporal gyrus. Examination of other reports reveal that these regions were included within areas identified by comparing groups of converters and controls, using voxel-based morphometry6,34 or fluid registration methods.7
The atrophy rates of controls and nonconverters in this study were not different from one another. Atrophy rates of nonconverters fell midway between those of controls and converters for most ROIs (table 2). We found that the effect size of the entorhinal cortex approached statistical significance in the comparison of controls and nonconverters indicating that more work needs to be done to better understand the differences between these groups.
A concern in this study pertains to the difference in baseline age between the groups. Since converters were older than the other groups at baseline, one possibility is that age could be a cause for the increased rates of atrophy observed. In order to investigate this possibility, a MANOVA, using intracranial-corrected volumes for each ROI at the baseline timepoint, with baseline age as a covariate and group as a between subjects variable, was conducted. This analysis showed that the hippocampus, entorhinal cortex, and temporal pole did not differ between the groups indicating that disease progression, not age, is the underlying factor.
The regions that did not differ between the groups in the prodromal phase of AD are also of interest. They include amygdala, banks of superior temporal sulcus, superior parietal lobule, superior temporal gyrus, supramarginal gyrus, precuneus, and posterior and isthmus portions of cingulate cortex. Differential atrophy in three of these regions (precuneus, posterior and isthmus of cingulate) has been reported in other studies.6,7 Differences between those studies and this one that may influence the outcome include clinical characteristics of subjects, size of groups, and image analysis techniques.
Differential atrophy within temporal lobe regions during prodromal AD reported here (i.e., entorhinal cortex, hippocampus, temporal pole, middle temporal gyrus, fusiform gyrus, and inferior temporal gyrus) are consistent with neurofibrillary changes reported in postmortem cases.1,2 Differential atrophy within parietal lobe regions (i.e., inferior parietal lobule) may be more related to both amyloid and tangle pathology. The preponderance of accelerated atrophy within temporal lobe regions may, in part, explain reports that neurofibrillary tangle number correlates better with cognitive performance than amyloid pathology.35
Correlations between atrophy rates in the three regions with the largest effect size (i.e., hippocampus, entorhinal cortex, and temporal pole) and change in the measures of clinical severity (i.e., CDR-SB) suggest the potential of using these MRI measures as surrogate markers of underlying disease. Correlations between changes in atrophy of hippocampus and changes in episodic memory (CVLT and the SRT) are consistent with the fact that declines in episodic memory are reported as predictors of progression.
The atrophy rates reported here correspond to previous reports. For entorhinal cortex and hippocampus, the APC for controls was less than 1% per year, and for converters 3–4% per year. This is comparable to rates reported by investigators using voxel-based morphometry techniques.6 It is slightly less than that reported by investigators who have outlined these regions manually.28,36
The sample size estimates presented here are greater than those in another study.36 This difference may be related to the nature of the subject population. For example, the mean MMSE score of the subjects in the other report was 26, whereas MMSE score of this sample was 29. This indicates that the subjects in the present study were more mildly impaired than those in the prior study. Differences in conversion rates across studies are likely the result of the same phenomenon.
Taken together, the findings in this report represent a novel approach to the analysis of MRIs among cases of prodromal AD. The MRI data presented here correlate with measures of clinical severity and cognitive decline, and can feasibly be utilized in therapeutic trials of MCI, affirming the utility of this approach for identifying antemortem markers of prodromal AD. The results also suggest that a broader range of structural MRI measures than have previously been identified may be useful as surrogate markers for the evolution of neuropathology in AD.37
ACKNOWLEDGMENT
The authors thank Dr. Mary Hyde for assistance with data analysis and Dr. Svetlana Egorova, Amanda Dow, and Marisa Tricarico for assistance with data management.
Address correspondence and reprint requests to Dr. Ronald J. Killiany, Dept. of Anatomy and Neurobiology, Center for Biomedical Imaging, Boston University School of Medicine, Boston, MA 02118 killiany@bu.edu
e-Pub ahead of print on July 30, 2008, at www.neurology.org.
Supported by grants from the National Institute on Aging (P01-AG04953), the National Center for Research Resources (P41-RR14075, R01-RR16594, U24-RR021382), the National Institute for Biomedical Imaging and Bioengineering (R01-EB001550), the National Institute for Neurological Diseases and Stroke (R01 NS052585), the BIRN Mophometric Project, and the Mental Illness and Neuroscience Discovery (MIND) Institute.
Disclosure: The authors report no disclosures.
Received October 30, 2007. Accepted in final form May 5, 2008.
REFERENCES
- 1.Braak H, Braak E. Neuropathological stageing of Alzheimer-related changes. Acta Neuropathol (Berl) 1991;82:239–259. [DOI] [PubMed] [Google Scholar]
- 2.Braak H, Braak E. Evolution of neuronal changes in the course of Alzheimer’s disease. J Neural Transm Suppl 1998;53:127–140. [DOI] [PubMed] [Google Scholar]
- 3.Tiraboschi P, Hansen LA, Thal LJ, Corey-Bloom J. The importance of neuritic plaques and tangles to the development and evolution of AD. Neurol 2004;62:1984–1989. [DOI] [PubMed] [Google Scholar]
- 4.McKee AC, Au R, Cabral HJ, et al. Visual association pathology in preclinical Alzheimer disease. J Neuropathol Exp Neurol 2006;65:621–630. [DOI] [PubMed] [Google Scholar]
- 5.Thal DR, Capetillo-Zarate E, Del Tredici K, Braak H. The development of amyloid beta protein deposits in the aged brain. Sci Aging Knowledge Environ 2006 Mar 8. [DOI] [PubMed]
- 6.Chetelat G, Landeau F, Eustache F, et al. Using voxel-based morphometry to map the structural changes associated with rapid conversion from MCI: a longitudinal MRI study. NeuroImage 2005;27:934–946. [DOI] [PubMed] [Google Scholar]
- 7.Buckner R, Snyder A, Shannon B, et al. Molecular, structural and functional characterization of Alzheimer’s disease: Evidence for relationship between default activity, amyloid and memory. J Neurosci 2005;25:7709–7717. [DOI] [PMC free article] [PubMed] [Google Scholar]
- 8.Fox NC, Crum WR, Scahill RI, Stevens JM, Janssen JC, Rossor MN. Imaging of onset and progression of Alzheimer’s disease with voxel-compression mapping of serial magnetic resonance images. Lancet 2001;358:201–205. [DOI] [PubMed] [Google Scholar]
- 9.Scahill RI, Schott JM, Stevens JM, Rossor MN, Fox NC. Mapping the evolution of regional atrophy in Alzheimer’s disease: unbiased analysis of fluid-registered serial MRI. Proc Natl Acad Sci 2002;99:4703–4707. [DOI] [PMC free article] [PubMed] [Google Scholar]
- 10.Albert M, Moss M, Tanzi R, Jones K. Preclinical prediction of AD using neuropsychological tests. J Int Neuropsychol Soc 2001;7:631–639. [DOI] [PubMed] [Google Scholar]
- 11.Killiany R, Gomez-Isla T, Moss M, et al. Use of structural magnetic resonance imaging to predict who will get Alzheimer’s disease. Ann Neurol 2000;47:430–439. [PubMed] [Google Scholar]
- 12.Killiany RJ, Hyman BT, Gomez-Isla T, et al. MRI measures of entorhinal cortex vs hippocampus in preclinical AD. Neurology 2002;58:1188–1196. [DOI] [PubMed] [Google Scholar]
- 13.Morris JC. The Clinical Dementia Rating (CDR): current version and scoring rules. Neurology 1993;43:2412–2414. [DOI] [PubMed] [Google Scholar]
- 14.Blessed G, Tomlinson B, Roth M. The association between quantitative measures of dementia and of senile change in cerebral grey matter of elderly subjects. Br J Psychiatry 1968;114:797–811. [DOI] [PubMed] [Google Scholar]
- 15.McKhann G, Drachman D, Folstein MF, Katzman R, Price D, Stadlan E. Clinical diagnosis of Alzheimer’s disease: Report of the NINCDS-ADRDA Work group under the auspices of Department of Health and Human Services Task Force. Neurology 1984;34:939–944. [DOI] [PubMed] [Google Scholar]
- 16.McKhann G, Albert M, Grossman M, Miller B, Dickson D, Trojanowski J. Clinical and pathological diagnosis of frontotemporal dementia: report of the Work Group on Frontotemporal Dementia and Pick’s Disease. Arch Neurol 2001;58:1803–1809. [DOI] [PubMed] [Google Scholar]
- 17.Roman GC, Tatemichi TK, Erkinjuntti T, et al. Vascular dementia: diagnostic criteria for research studies: Report of the NINDS-AIREN International Workshop. Neurology 1993;43:250–260. [DOI] [PubMed] [Google Scholar]
- 18.Blacker D, Lee H, Muzikansky A, et al. Neuropsychological measures in normal individuals that predict subsequent cognitive decline. Arch Neurol 2008 (in press). [DOI] [PubMed]
- 19.Delis D, Kramer J, Kaplan E, Ober B. The California Verbal Learning Test. New York: Psychological Corp, 1987. [Google Scholar]
- 20.Grober E, Buschke H. Genuine memory deficits in dementia. Dev Neuropsychol 1987;3:13–36. [Google Scholar]
- 21.Reitan RM. Validity of the Trail Making Test as an indicator of organic brain damage. Percept Mot Skills 1958;8:271–276. [Google Scholar]
- 22.Dale AM, Fischl B, Sereno M. Cortical surface-based analysis. I: Segmentation and surface reconstruction Neuroimage 1999;9:179–194. [DOI] [PubMed] [Google Scholar]
- 23.Fischl B, Sereno MI, Dale AM. Cortical surface-based analysis. II: Inflation, flattening, and a surface-based coordinate system. NeuroImage 1999;9:195–207. [DOI] [PubMed] [Google Scholar]
- 24.Desikan R, Ségonne F, Fischl B, et al. An automated labeling system for subdividing the human cerebral cortex on MRI scans into gyral based regions of interest. Neuroimage 2006;31:968–980. [DOI] [PubMed] [Google Scholar]
- 25.Han X, Jovicich J, Salat D, et al. Reliability of MRI-derived measurements of human cerebral cortical thickness: The effects of field strength, scanner upgrade and manufacturer. Neuroimage 2006;32:180–194. [DOI] [PubMed] [Google Scholar]
- 26.Cardenas VA, Du AT, Hardin D, et al. Comparison of methods for measuring longitudinal brain change in cognitive impairment and dementia. Neurobiol Aging 2003;4:537–544. [DOI] [PubMed] [Google Scholar]
- 27.Du A, Schuff N, Kraner J, et al. Higher atrophy rate of entorhinal cortex than hippocampus in AD. Neurology 2004;62:422–427. [DOI] [PMC free article] [PubMed] [Google Scholar]
- 28.Jack C, Shiung M, Weigand M, et al. Brain atrophy rates predict subsequent clinical conversion in normal elderly and amnestic MCI. Neurology 2005;65:1227–1231. [DOI] [PMC free article] [PubMed] [Google Scholar]
- 29.Hsu JC. Multiple Comparisons: Theory and Methods. London: Chapman and Hall, 1996. [Google Scholar]
- 30.Cohen J. Statistical power analysis for the behavioral sciences (2nd ed.). Hillsdale, NJ: Lawrence Earlbaum Associates, 1988. [Google Scholar]
- 31.Campbell MJ, Julious SA, Altman DG. Estimating sample sizes for binary, ordered categorical, and continuous outcomes in two group comparisons. BMJ 1995;311:1145–1148. [DOI] [PMC free article] [PubMed] [Google Scholar]
- 32.Hollander M, Wolfe DA. Nonparametric Statistical Methods. New York: John Wiley & Sons, Inc, 1973. [Google Scholar]
- 33.Anderson VC, Litvack ZN, Kaye JA. Magnetic resonance approaches to brain aging and Alzheimer disease-associated neuropathology. Top Magn Reson Imaging 2005;16:439–452. [DOI] [PubMed] [Google Scholar]
- 34.Whitwell JL, Shiung MM, Przybelski SA, et al. MRI patterns of atrophy associated with progression to AD in amnestic mild cognitive impairment. Neurology 2008;70:512–521. [DOI] [PMC free article] [PubMed] [Google Scholar]
- 35.Arriagada PV, Growdon JH, Hedley-Whyte ET, Hyman BT. Neurofibrillary tangles but not senile plaques parallel duration and severity of Alzheimer’s disease. Neurology 1992;42:631–639. [DOI] [PubMed] [Google Scholar]
- 36.Jack CR Jr, Shiung MM, Gunter JL, et al. Comparison of different MRI brain atrophy rate measures with clinical disease progression in AD. Neurology 2004;62:591–600. [DOI] [PMC free article] [PubMed] [Google Scholar]
- 37.Smith AD. Imaging the progression of Alzheimer pathology through the brain. Proc Natl Acad Sci USA 2002;99:4135–4137. [DOI] [PMC free article] [PubMed] [Google Scholar]