

Abstract
Objective
Data from electronic dosing monitors and published pharmacokinetic parameters were used to derive medication adherence measures for immediate-release metoprolol and examine their association with health care utilization of outpatients aged 50 years or older with heart failure.
Methods
We used a 1-compartment model and published population pharmacokinetic parameters to estimate mean plasma metoprolol concentrations for patients treated for 6 to 12 months. In the absence of directly measured plasma concentrations, we calculated the intended mean plasma concentration (Cp′ave) under the assumption of perfect adherence to the prescribed dose and frequency of administration. Projected mean plasma concentrations (Cpave) were estimated by use of data from recorded dosing times. In addition to taking adherence (percentage of dose taken) and scheduling adherence (percentage of doses taken on schedule), we calculated the deviation from the intended exposure (ΔCpave = Cp′ave − Cpave) and the proportion of intended exposure achieved by the patient (Cpave/Cp′ave). We assessed the association between the adherence measures and the numbers of emergency department visits and hospital admissions experienced by the patients.
Results
Patients (N = 80) were aged 62 ± 8 years. Mean ΔCpave and Cpave/Cp′ave were 7.9 ng/mL (SD, 10.7) and 0.6 (SD, 0.3), respectively. Log-linear models adjusted for patient functional status indicated that greater deviation from the intended metoprolol exposure (ΔCpave) was associated with increased numbers of emergency department visits (P < .0001) and hospital admissions (P < .0001). A higher proportion of intended exposure (Cpave/Cp′ave) corresponded to a reduced number of emergency department visits (P = .0204) and hospital admissions (P = .0093). Taking adherence was univariately associated with both emergency department visits and hospital visits (P < .0001 and P = .0010, respectively). Scheduling adherence was associated with the number of emergency department visits (P = .0181) but not with the number of hospital admissions (P = .1602). Model selection procedures consistently chose the proposed measures over taking adherence and scheduling adherence.
Conclusion
Deviation from the intended exposure and proportion of intended exposure achieved by the patient are valid adherence measures for immediate-release metoprolol and are associated with health care utilization. The potential utility of these measures for other β-adrenergic antagonists and perhaps other cardiovascular drugs should be investigated.
Patients with chronic diseases must take medications regularly to prevent deteriorating illness requiring costly use of health care services such as emergency department (ED) visits and hospitalization. However, approximately half of all patients who are prescribed medications for chronic diseases do not adhere to their prescriptions.1-3 Medication adherence is particularly important to patients with chronic heart failure (CHF) because of the propensity for such patients to require expensive health care services. Adherence to the prescribed regimen by patients with heart failure varies from 10% to 85%.4,5 Indiscretions in medication adherence or diet may result in decompensation in 44% of patients with CHF and other chronic cardiovascular diseases.6
Adherence measurement has been greatly facilitated by electronic dosing monitors that record the temporal pattern of medication container openings.7 Assuming that an appropriate number of tablets are taken each time a lid is opened, aggregate adherence measures may be computed to summarize medication event data generated by electronic monitors.8-10 Choo et al11 explored the interrelationships among these measurements and elucidated their mathematic foundation. Because of the relationship between dosing and plasma concentration,12,13 we believed that it would be appropriate to explore this relationship and assess its effect on relevant patient outcomes. As such, we derived 2 adherence measures that couple electronic dosing records with the pharmacokinetic properties of the monitored drug. In doing so, the resulting adherence measures consider the frequency, dose administration time, dose strength, and population pharmacokinetic parameters of the medication. We hypothesized that the proposed measures would be associated with disease exacerbation. We tested this hypothesis in 80 older patients with CHF treated with immediate-release metoprolol and then assessed the associations between the new measures and the numbers of ED visits and hospital admissions experienced by these patients.
In the past decade, several investigators have explored the use of dosing history data to improve the estimation of drug concentration curves by measuring plasma drug concentrations.12,14,15 Their work has highlighted the importance of dosing history data in pharmacokinetic and pharmacodynamic studies. We took a different approach. Instead of relying on directly measured drug concentrations, we estimated plasma concentrations by using an individual patient’s dosing records and published population pharmacokinetic parameters. One advantage of using published population parameters is that the resulting measures could be applicable to nonpharmacokinetic clinical trials in which drug concentrations were unavailable.
METHODS
Setting and participants
Data were obtained from a health services research, randomized, controlled trial being conducted in Indianapolis, Ind. The primary objective of the trial was to test the effectiveness of a pharmacy-based intervention program aimed at improving medication adherence in older adults with CHF.16 The study protocol was approved by the Indiana University–Purdue University Institutional Review Board (Indianapolis, Ind).
Participants were recruited from Wishard Health Services, which serves the inner-city residents of Indianapolis, Ind. The study population may be generally characterized as having limited resources and being ethnically diverse. Eligible participants were English-speaking, were aged 50 years or older, had a diagnosis of CHF, and were currently taking at least 1 cardiovascular medication, including angiotensin-converting enzyme (ACE) inhibitors, angiotensin II receptor antagonists, β-adrenergic receptor antagonists, digoxin, an aldosterone antagonist, and loop or nonloop diuretics. On enrollment, participants were provided with electronic monitor lids (see below) on their prescription containers for each of the aforementioned cardiovascular medications. Other prescription medication containers did not have electronic monitors affixed. Medication use was monitored for 6 to 12 months.
To test the operating characteristics of the proposed adherence measures, we used data from the trial’s control arm for 80 subjects who had been prescribed immediate-release metoprolol, a selective β1-adrenergic antagonist with well-established pharmacokinetics. The rationale for using only control arm patients was to avoid any effects of the intervention, which was aimed at improving medication adherence among participants assigned to the intervention arm.16
Electronic dosing records
We used MEMS Track V prescription container lids as electronic monitoring devices (AARDEX Ltd, Zug, Switzerland).17 Data recorded by the MEMS monitors were extracted into a desktop computer that in turn displayed the event patterns graphically and calculated medication taking and scheduling adherence.7 MEMS adherence logs were validated by pharmacists and data analysts via comparison of metoprolol MEMS dosing patterns with patient self-reported adherence and with prescription refill adherence.18 We also verified the phase start and end dates to ensure that the MEMS lids were correctly set. Verified MEMS data were then exported from MEMS software to SAS (SAS Institute, Cary, NC) for further analyses.
Pharmacokinetic adherence measures based on estimated plasma concentrations
To accommodate the pharmacokinetic properties of metoprolol, we constructed 2 adherence measures. The first measure estimated the magnitude of the patient’s deviation from the intended metoprolol exposure, whereas the second measure estimated adherence as the proportion of intended metoprolol exposure achieved by the patient’s dosing pattern. Both measures were calculated by use of published metoprolol pharmacokinetic parameters and dosing history data recorded by MEMS. Intended drug exposure was calculated as the average plasma concentration under perfect adherence to the prescribed regimen.
Plasma concentrations (Cp) of metoprolol and most other cardiovascular medications were not measured. We, therefore, estimated the Cp levels by using established pharmacokinetic parameters of metoprolol. Considering the standard 1-compartment model for the Cp level in the ith subject, we estimated the Cp levels at preselected time points tj, where j = 0, 1, 2, … Ji. Herein, we chose the time points at hourly intervals and at all of the recorded metoprolol dosing times. For the ith patient, we used the first recorded dosing time as the starting point (t0 = 0) and the last time point in the observation period as tJi, where tJi was allowed to vary from subject to subject. We then estimated the plasma concentration of metoprolol in the ith subject at time tj, Cp[i,t], for all of the preselected time points tj, where j = 0, 1, 2, … Ji. Using the multidose 1-compartment model,19 we considered the iterative algorithm below. An illustration for the use of the algorithm is provided in the Appendix.
Algorithm
Let d[i,j] be the dose amount of the medication that the ith subject took at time tj. If the patient did not take his or her medication at the time, d[i,j] = 0. At time t0 = 0, the cumulative dose D[i,0] is the first dose taken (d[i,0]), and the plasma concentration is as follows:
| (1) |
where F is the population-based bioavailability of the medication, V[i] is the volume of distribution adjusted for the ith patient’s weight, and ka and ke are the first-order absorption and elimination rate constants, respectively.
At all later time points tj, where j = 1, 2, … Ji, we first calculated the cumulative dose as follows:
| (2) |
Then we wrote the plasma concentration at time tj as follows:
| (3) |
We used the above-described iterative algorithm to estimate the hourly plasma concentration levels based on the dosing events recorded by the MEMS records. Specifically, we calculated the values of Cp[i,j] in hourly increments after the first dosing event for the entire duration of the study period covered by the MEMS logs. We then averaged the estimated hourly Cp[i,j] in each study subject for the mean hourly plasma concentration for the study period. We denoted this average as Cpave[i] for the ith subject as follows: , where J′i was the number of hours contained in the subject’s MEMS log. Therefore Cpave[i] can be viewed as an approximation of the mean plasma concentration of metoprolol during the study period.
In a similar fashion, we calculated the intended plasma concentration level under the assumption of perfect adherence to the prescribed dose and frequency of administration. We denoted the average of hourly Cp values under the assumption of perfect adherence as Cp′ave[i]. It should be noted that Cp′ave[i] can also be obtained by use of a steady-state equation.19 The difference between Cp′ave[i] and Cpave[i], therefore, reflected the deviation of the projected Cp from the intended (or prescribed) level. The greater this deviation, the poorer the patient’s adherence to the prescribed metoprolol regimen. Hence we propose to use ΔCpave[i] = Cp′ave[i] − Cpave[i] to measure the medication adherence of the ith patient. Unlike most of the existing adherence measures, ΔCpave[i] also accommodates the pharmacokinetic properties of the drug. For a drug with a longer half-life, the plasma concentration has a slower decrement and ΔCpave[i] is less sensitive to a delayed administration. Fig 1 depicts the estimated Cp curves of metoprolol for an abbreviated time period in 4 representative participants.
Fig 1.
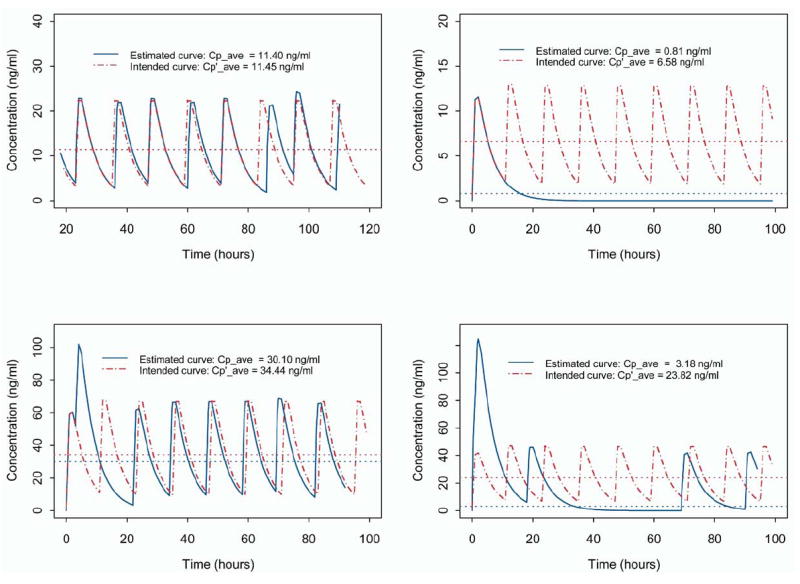
Estimated and intended metoprolol plasma concentration curves for 4 study subjects during abbreviated time interval for exemplification. The dashed curve depicts the time course of the estimated plasma concentration under perfect adherence and thus represents the intended dosing pattern. The continuous curve depicts the MEMS-recorded dosing pattern. The upper horizontal line represents the overall average value of intended metoprolol exposure (Cp′ave[i]), and the lower horizontal line represents the hourly average metoprolol concentration (Cpave[i]) estimated from the MEMS-recorded dosing pattern.
An alternative adherence measure was the ratio Cpave[i]/Cp′ave[i], which quantified the proportion of intended plasma concentration achieved by the ith patient. A larger value for this ratio indicated better patient adherence to the prescribed regimen.
Metoprolol
At therapeutic doses, metoprolol acts by selectively antagonizing the β1 receptor in the myocardium, producing negative chronotropism and inotropism. Long-term use of metoprolol in heart failure patients has been shown to be beneficial in reducing hospitalization and mortality rates.20 Abrupt discontinuation and erratic administration of the drug, on the other hand, are known risk factors of rebound tachycardia, hypertension, and subsequent cardiac ischemia.21 Patients in this study took immediate-release metoprolol at doses ranging from 12.5 mg to 100 mg at a frequency of 12 hours.
We used a 1-compartment model with published pharmacokinetic parameters to estimate plasma concentrations of metoprolol, although it more appropriately follows a 2-compartment kinetic model. Two-compartment models could be used when kinetic data were available to fit those models. Clearance based on differences in metabolism varies between 50 L/h and 409 L/h. In the absence of individual data, we used the population-based value of the elimination rate constant (ke) and the 1-compartment model to estimate the plasma concentration.
The pharmacokinetic parameters of metoprolol are well established. The drug has an elimination half-life of approximately 3.5 hours, bioavailability (F) of 0.5, ke equal to 0.198/h, and time to peak Cp (tmax) approximately equal to 1.5.22,23 On the basis of the following equation, we solved for an estimate of the absorption parameter (ka) equal to 1.585/h:
By use of these parameters, we computed the values of ΔCpave[i] and Cpave[i]/Cp′ave[i] for each of the study patients based on the dosing events recorded by MEMS.
Statistical analysis
To assess the performance of the proposed pharmacokinetic-based adherence measures, we first examined their correlations with 2 commonly used MEMS adherence measures, namely, taking adherence and scheduling adherence. Taking adherence was defined as the percentage of dose taken in the observation period, whereas scheduling adherence was defined as the percentage of dose taken on schedule (ie, ±2 hours of the desired dosing time). We then evaluated their associations with 2 important clinical outcomes—numbers of hospital admissions and numbers of ED visits, which are regarded as surrogate markers of disease exacerbation. Specifically, by use of an electronic medical record system,24,25 we determined the numbers of hospital admissions and ED visits experienced by each study participant during the time period of observation. We then fitted log-linear models by using the numbers of hospital admissions and ED visits as outcome variables. Important explanatory variables considered for the model included demographic characteristics (age, race, and gender), New York Heart Association (NYHA) classification, numbers and indicators of cardiovascular drugs, and taking and scheduling adherence and the proposed adherence measure of metoprolol. Race, gender, and NYHA classification were treated as categoric variables. Each level of a categoric variable was compared with a reference level.
The effects of variables were evaluated by use of the Wald test.26 Because lengths of observation differed among subjects, we introduced the length of follow-up period into the model as an offset parameter.27 The 4 metoprolol adherence measures (taking and scheduling adherence and the 2 new pharmacokinetic-based measures) were used as independent variables for the examination of their associations with the numbers of ED visits and hospital admissions. Our general model selection strategy was to first screen all of the independent variables for their univariate associations with outcome variables. Then, for each outcome, we used both forward and stepwise selection procedures to choose the final models. Because 2 new adherence measures were proposed in this research, to assess the performance of each one independently, we conducted 2 parallel selection processes for each outcome, one for ΔCpave[i] and all other covariates (excluding Cpave[i]/Cp′ave[i]) and the other for Cpave[i]/Cp′ave[i] and all of the covariates (excluding ΔCpave[i]). This resulted in the 4 final models.
Although the primary objective of this research was to develop new pharmacokinetic-based adherence measures and use them to assess the effect of metoprolol adherence on health care utilization, it was important to present the results within the context of other concomitantly used cardiovascular drugs. In our study sample, 87% and 83% of the patients, respectively, took diuretics and ACE inhibitors concurrently with metoprolol. Fewer patients were taking angiotensin II receptor antagonists, digoxin, and spironolactone. To assess the adherence effects of concomitant drugs, we first evaluated the taking and scheduling effects for each of these drugs univariately via log-linear models. Taking adherence and scheduling adherence of these other cardiovascular drugs were used in the model selection process, but none of them were selected into the final models. We re-examined the adherence effects of diuretics and ACE inhibitors by including them in the final models. We did not enter diuretics and ACE inhibitors into the final models simultaneously because the stability of the models was undermined by strong multicollinearity from multiple factors and the much reduced sample size (only 53 patients were prescribed metoprolol, diuretics, and ACE inhibitors concomitantly). We do not present data on angiotensin II receptor antagonists, digoxin, and spironolactone in multivariate models because of Journal space limitation.
RESULTS
Demographic and clinical characteristics of the study patients are listed in Table I. The mean age (±SD) of the study participants was 62 ± 8 years, 69% were women, and 51% were nonwhite. Approximately half (51%) of the participants had an NYHA functional class of II. Participants were prescribed a mean of 4.3 ± 2 cardiovascular drugs, including diuretics (87%), ACE inhibitors (83%), angiotensin II receptor antagonists (15%), digoxin (26%), and spironolactone (15%). Mean taking adherence of metoprolol was 63%, mean scheduling adherence was 33%, average ΔCpave was 7.87 ng/mL, and average Cpave[i]/Cp′ave[i] was 60%. For metoprolol, correlation between ΔCpave[i] and taking adherence was −0.4718 (P < .0001) and correlation between ΔCpave[i] and scheduling adherence was −0.3746 (P = .0005). Cpave[i]/Cp′ave[i] correlated strongly with both taking adherence (ρ = 0.8109, P < .0001) and scheduling adherence (ρ = 0.5918, P < .0001). The significant correlations among these 4 measures were not unexpected, because the information on the drug consumption used to calculate taking and scheduling adherence was incorporated in the computation of ΔCpave[i] and Cpave[i]/Cp′ave[i]. Graphic presentations of these relationships are shown in Fig 2 with histograms (Fig 2, f and i) depicting the distributions of ΔCpave[i] and Cpave[i]/Cp′ave[i]. We noted that ΔCpave[i] was skewed (skewness = 2.5) probably because of 2 large values in the right tail. The rest of the distribution was relatively symmetric (skewness = 0.58). Fig 2, b and c, showed that ΔCpave[i] was more sensitive to the dose input than was Cpave[i]/Cp′ave[i].
Table I.
Sample statistics and univariate associations between patient characteristics and outcomes
| Univariate model for No. of hospitalizations
|
Univariate model for No. of ED visits
|
||||
|---|---|---|---|---|---|
| Variable | Sample statistics (N = 80) | Regression coefficient and SE | P value | Regression coefficient and SE | P value |
| Age (y) | 62 (8) | 0.0131 (0.023) | .5704 | −0.0095 (0.013) | .4791 |
| Gender | .3482 | .5890 | |||
| Female | 55 (69%) | 0.4320 (0.461) | 0.1291 (0.239) | ||
| Male | 23 (31%) | 0.0 | 0.0 | ||
| Race | .1645 | .0093 | |||
| Nonwhite | 41 (51%) | 0.5625 (0.405) | 0.5940 (0.228) | ||
| White | 39 (47%) | 0.0 | 0.0 | ||
| NYHA classification* | <.0001 | <.0001 | |||
| Class I | 13 (16%) | −1.9974 (0.570) | −1.4786 (0.312) | ||
| Class II | 41 (51%) | −2.2215 (0.465) | −1.9248 (0.278) | ||
| Class III | 23 (29%) | −2.7832 (0.612) | −2.6879 (0.375) | ||
| Class IV | 3 (4%) | 0.0 | 0.0 | ||
| No. of cardiovascular drugs | 4.3 (SD, 1.76) | 0.1236 (0.099) | .2108 | 0.0787 (0.057) | .1662 |
| Metoprolol | |||||
| Dose at baseline (mg) | 48.15 (SD, 22.8) | −0.0131 (0.009) | .1522 | −0.0024 (0.005) | .6078 |
| Intended concentration (Cp′ave) (ng/ml) | 20.76 (SD, 13.7) | 0.0270 (0.020) | .1792 | 0.0164 (0.014) | .2313 |
| Measure of ΔCPave (ng/ml) | 7.9 (SD, 11.0) | 0.0412 (0.009) | <.0001 | 0.0270 (0.006) | <.0001 |
| Measure of Cpave/Cp′ave (%) | 0.6 (SD, 0.3) | −2.7598 (0.647) | <.0001 | −1.7548 (0.334) | <.0001 |
| Taking adherence (%) | 63 (SD, 34.1) | −1.9199 (0.583) | .0010 | −1.3313 (0.320) | <.0001 |
| Scheduling adherence (%) | 32.7 (SD, 31.0) | −0.9487 (0.676) | .1602 | −0.8877 (0.376) | .0181 |
| Diuretics | |||||
| Diuretic use (yes = 1, no = 0) | 69 (87%) | −0.8182 (0.418) | .0505 | −0.1385 (0.283) | .6248 |
| Taking adherence (%) | 56.4 (SD, 32.3) | −2.2319 (0.756) | .0031 | −1.1252 (0.365) | .0020 |
| Scheduling adherence (%) | 29.5 (SD, 28.3) | −2.6135 (1.156) | .0237 | −1.3247 (0.495) | .0074 |
| ACE inhibitors | |||||
| ACE inhibitor use (yes = 1, no = 0) | 66 (83%) | 0.5218 (0.611) | .3931 | 0.5863 (0.352) | .0954 |
| Taking adherence (%) | 70.5 (SD, 30.2) | −1.7480 (0.588) | .0029 | −1.2801 (0.332) | .0001 |
| Scheduling adherence (%) | 52.6 (SD, 30.9) | −2.4627 (0.678) | .0003 | −1.8124 (0.361) | <.0001 |
| ARBs | |||||
| ARB use (yes = 1, no = 0) | 12 (15%) | 0.2370 (0.461) | .6068 | −0.3226 (0.310) | .2986 |
| Taking adherence (%) | 64.9 (SD, 34.5) | −0.8313 (1.170) | .4775 | −0.6765 (0.832) | .4162 |
| Scheduling adherence (%) | 59.6 (SD, 35.4) | −1.1727 (1.133) | .3004 | 0.5762 (0.814) | .4790 |
| Digoxin | |||||
| Digoxin use (yes = 1, no = 0) | 21 (26%) | 0.1287 (0.405) | .7504 | 0.5356 (0.215) | .0128 |
| Taking adherence (%) | 81.0 (SD, 22.2) | −5.5790 (1.967) | .0046 | −4.2117 (1.615) | .0091 |
| Scheduling adherence (%) | 67.8 (SD, 27.3) | −5.0352 (2.265) | .0257 | −3.9592 (1.639) | .0157 |
| Spironolactone | |||||
| Spironolactone use (yes = 1, no = 0) | 12 (15%) | 0.6160 (0.436) | .1581 | 1.1373 (0.221) | <.0001 |
| Taking adherence (%) | 62.7 (SD, 36.0) | −4.7263 (2.141) | .0272 | −3.1037 (0.979) | .0015 |
| Scheduling adherence (%) | 40.5 (SD, 36.4) | −4.2866 (1.980) | .0304 | −3.7830 (1.353) | .0052 |
| No. of hospitalizations | 0.4 (SD, 1.1) | ||||
| No. of ED visits | 1.3 (SD, 2.5) | ||||
ED, Emergency department; Cpc′ave, intended level of hourly average metoprolol concentration in plasma; ΔCpave, deviation from intended level of hourly average metoprolol concentration in plasma; Cpave/Cp′ave, ratio of estimated and intended levels of hourly average metoprolol concentration in plasma; NYHA, New York Heart Association; ACE, angiotensin-converting enzyme; ARB, angiotensin II receptor blocker.
Functional performance is best for class I and worst for class IV.
Fig 2.

Scatter plot of Cpave (estimated level of hourly average metoprolol concentration in plasma) versus Cp′ave (intended level of hourly average metoprolol concentration in plasma) (a), ΔCpave[i] (patient’s deviation from intended level of hourly average metoprolol concentration in plasma) versus prescribed dose (b), scatter plot of Cpave/Cp′ave (ratio of estimated and intended levels of hourly average metoprolol concentration in plasma) versus prescribed dose (c), scatter plot of ΔCpave[i] versus taking adherence (d), scatter plot of ΔCpave[i] versus scheduling adherence (e), frequency distribution of ΔCpave[i] (f), scatter plot of Cpave/Cp′ave versus taking adherence (g), scatter plot of Cpave/Cp′ave versus scheduling adherence (h), and frequency distribution of Cpave/Cp′ave (i). r, Correlation coefficient.
Univariate analysis suggested that all 4 adherence measures for metoprolol were independently associated with hospitalizations and ED visits (better adherence corresponded to decreased utilization), with the exception of the nonsignificant association between scheduling adherence and hospitalization (P = .1602). Wald statistics (Coefficient/SE) corresponding to each of the 4 adherence measures showed that the values of Wald statistics for ΔCpave[i] and Cpave[i]/Cp′ave[i] were larger than those for taking adherence and scheduling adherence, suggesting that stronger associations existed between the 2 pharmacokinetic-based adherence measures and the outcomes. Better adherence to diuretics, ACE inhibitors, digoxin, and spironolactone was also independently associated with decreased utilization (Table I).
Factors significantly associated with hospital admissions and ED visits, as identified by the final models, were tabulated in part 1 of Tables II and III, respectively. For each of the outcome variables, we reported 2 final models, as follows: (1) a model selected from a pool of candidate variables including ΔCpave[i] and (2) a model selected from a pool of candidate variables including Cpave[i]/Cp′ave[i]. The reported models were chosen through a formal stepwise model selection procedure, and the significant variables meeting the selection criteria (P ≤ .05) were included in the final models. The forward selection process yielded the same models.
Table II.
Factors associated with number of hospitalization admissions*
| Variable | Coefficient and SE | P value |
|---|---|---|
| Part 1: Patients prescribed metoprolol | ||
| Model 1: Selected model containing ΔCpave | ||
| NYHA classification | <.0001 | |
| Class I | −2.2313 (0.574) | |
| Class II | −2.7142 (0.518) | |
| Class III | −2.7312 (0.613) | |
| Class IV† | 0.0 | |
| ΔCpave for metoprolol | 0.0485 (0.010) | <.0001 |
| Model 2: Selected model containing Cpave/Cp′ave | ||
| NYHA classification | .0283 | |
| Class I | −1.1650 (0.639) | |
| Class II | −1.5052 (0.521) | |
| Class III | −1.6770 (0.717) | |
| Class IV | 0.0 | |
| Cpave/Cp′ave for metoprolol | −1.9032 (0.732) | .0093 |
| Part 2: Patients prescribed metoprolol and a diuretic | ||
| Model 1: Selected model containing ΔCpave | ||
| NYHA classification | .0008 | |
| Class I | −2.2257 (0.926) | |
| Class II | −3.3555 (0.846) | |
| Class III | −2.5646 (0.884) | |
| Class IV† | 0.0 | |
| ΔCpave for metoprolol | 0.0465 (0.026) | .0762 |
| Diuretic taking adherence | −0.0386 (1.084) | .9716 |
| Model 2: Selected model containing Cpave/Cp′ave | ||
| NYHA classification | .0108 | |
| Class I | −1.3101 (0.766) | |
| Class II | −2.4764 (0.743) | |
| Class III | −1.5748 (0.801) | |
| Class IV | 0.0 | |
| Cpave/Cp′ave for metoprolol | −2.9271 (1.193) | .0141 |
| Diuretic taking adherence | 0.9630 (1.116) | .3882 |
| Part 3: Patients prescribed metoprolol and an ACE inhibitor | ||
| Model 1: Selected model containing ΔCpave | ||
| NYHA classification | <.0001 | |
| Class I | −2.4980 (0.635) | |
| Class II | −3.2846 (0.690) | |
| Class III | −2.7990 (0.678) | |
| Class IV† | 0.0 | |
| ΔCpave for metoprolol | 0.0550 (0.012) | <.0001 |
| ACE inhibitor taking adherence | −0.6179 (0.637) | .3319 |
| Model 2: Selected model containing Cpave/Cp′ave | ||
| NYHA classification | .0097 | |
| Class I | −1.5535 (0.646) | |
| Class II | −1.8602 (0.588) | |
| Class III | −1.9969 (0.718) | |
| Class IV | 0.0 | |
| Cpave/Cp′ave for metoprolol | −2.3532 (1.059) | .0262 |
| ACE inhibitor taking adherence | 0.2840 (0.930) | .7601 |
Because of missing data, 75 subjects were used for the model selection process and the fitting of the final models.
Reference category.
Table III.
Factors associated with number of ED admissions*
| Variable | Coefficient and SE | P value |
|---|---|---|
| Part 1: Patients prescribed metoprolol (N = 80) | ||
| Model 1: Selected model containing ΔCpave | ||
| NYHA classification | <.0001 | |
| Class I | −1.6112 (0.315) | |
| Class II | −2.2153 (0.297) | |
| Class III | −2.6227 (0.376) | |
| Class IV† | 0.0 | |
| ΔCpave for metoprolol | 0.0315 (0.007) | <.0001 |
| Model 2: Selected model containing Cpave/Cp′ave | ||
| NYHA classification | <.0001 | |
| Class I | −1.0710 (0.356) | |
| Class II | −1.5661 (0.314) | |
| Class III | −2.1430 (0.439) | |
| Class IV | 0.0 | |
| Cpave/Cp′ave for metoprolol | −0.8887 (0.383) | .0204 |
| Part 2: Patients prescribed metoprolol and a diuretic (n = 69) | ||
| Model 1: Selected model containing ΔCpave | ||
| NYHA classification | <.0001 | |
| Class I | −1.9023 (0.466) | |
| Class II | −2.5968 (0.413) | |
| Class III | −3.1401 (0.506) | |
| Class IV† | 0.0 | |
| ΔCpave for metoprolol | 0.0332 (0.013) | .0126 |
| Diuretic taking adherence | 0.6944 (0.492) | .1579 |
| Model 2: Selected model containing Cpave/Cp′ave | ||
| NYHA classification | <.0001 | |
| Class I | −1.2457 (0.409) | |
| Class II | −2.0234 (0.383) | |
| Class III | −2.5065 (0.509) | |
| Class IV | 0.0 | |
| Cpave/Cp′ave for metoprolol | −1.2287 (0.502) | .0143 |
| Diuretic taking adherence | 0.8155 (0.495) | .0994 |
| Part 3: Patients prescribed metoprolol and an ACE inhibitor (n = 66) | ||
| Model 1: Selected model containing ΔCpave | ||
| NYHA classification | <.0001 | |
| Class I | −1.9710 (0.348) | |
| Class II | −2.6699(0.361) | |
| Class III | −3.1329 (0.436) | |
| Class IV† | 0.0 | |
| ΔCpave for metoprolol | 0.0314 (0.007) | <.0001 |
| ACE inhibitor taking adherence | −0.2075 (0.377) | .5821 |
| Model 2: Selected model containing Cpave/Cp′ave | ||
| NYHA classification | <.0001 | |
| Class I | −1.4599 (0.352) | |
| Class II | −2.0296 (0.343) | |
| Class III | −2.6683 (0.458) | |
| Class IV | 0.0 | |
| Cpave/Cp′ave for metoprolol | −1.2461 (0.542) | .0214 |
| ACE inhibitor taking adherence | 0.1902 (0.512) | .7104 |
Because of missing data, 75 subjects were used for the model selection process and the fitting of the final models.
Reference category.
Without exception, a patient’s functional status and pharmacokinetic-based measures of metoprolol adherence were selected into the final models, suggesting that both were strong correlates of health care utilization in these heart failure patients. Specifically, ΔCpave was significantly associated with the number of hospital admissions after we controlled for the effect of NYHA classification. Exponentiating the coefficient estimate of ΔCpave, we found the relative risk of hospitalization associated with a 1-unit increase in ΔCpave to be 1.05. In other words, for each 1-ng/mL deviation from the intended exposure, there was a 5.0% increase in the risk of hospital admission (P < .0001). Similarly, increased Cpave[i]/Cp′ave[i] (a greater proportional metoprolol exposure) was associated with a decreased number of hospital admissions (P = .0093). Not surprisingly, NYHA functional classification was also found to be significantly associated with the number of hospital admissions; compared with patients with NYHA class IV, patients with all other classes had fewer numbers of hospital admissions.
For ED visits, ΔCpave and Cpave[i]/Cp′ave[i] were again identified by model selection procedures as significant correlates of the number of ED visits, along with NYHA classifications. The final models show that greater metoprolol adherence (measured by ΔCpave and Cpave[i]/Cp′ave[i]) was associated with a reduction in the number of ED visits. Again, taking and scheduling adherence measures did not reach the level of significance to be selected into the final models.
In addition to the assessment of the effect of metoprolol adherence, we also examined the adherence effects of other cardiovascular drugs. Whereas adherence effects of diuretics, ACE inhibitors, digoxin, and spironolactone were significant in univariate analyses (Table I), none were strong enough to be selected into final models. Furthermore, adherence to these other drugs was not significant when we forced them into the final models (parts 2 and 3 in Tables II and III).
DISCUSSION
The pharmacokinetic-based adherence measures ΔCpave and Cpave[i]/Cp′ave[i] account for adherence to the regimen and pharmacokinetic properties of metoprolol. From the estimated plasma concentration curves, it appeared that the proposed measures were sensitive to missing doses, as well as erratic drug administration. Significant associations between the proposed measure and ED and hospital admissions indicate their practical utility and validity.
An important feature of the proposed measures is that they can be used in nonpharmacokinetic studies where drug levels are not measured. They also offer the flexibility to incorporate dose changes because equations 2 and 3 allow the dose d[i,j] to vary across the time points. This is a clinically important feature because β-blockers such as metoprolol are usually titrated to patient response.
Unlike the taking and scheduling adherence computed by MEMS software, the pharmacokinetic measures focus on drug exposure as opposed to the medication use behaviors only. In doing so, they account for metoprolol’s kinetic characteristics, as well as the patient’s adherence behaviors. Furthermore, certain medications are less forgiving than others in terms of clinical outcomes from failure to take them.13 For this reason, we contend that the average plasma concentration of some cardiovascular medications may prove to be a more sensitive and objective assessment of true therapeutic exposure received by patients.
Both ΔCpave and Cpave[i]/Cp′ave[i] for metoprolol in patients with CHF were associated with hospital admissions and ED visits. Empiric evidence suggests that associations with utilization were stronger than those for taking or scheduling adherence. In 2 ways, ΔCpave[i] and Cpave[i]/Cp′ave[i] measure the estimated drug exposure by comparing it with the intended exposure. When there is a large deviation from the intended level (ie, larger ΔCpave[i] or smaller Cpave[i]/Cp′ave[i]), disease exacerbation occurs and may result in an ED visit or hospital admission. From a clinical perspective, poor adherence in the long run and occasional drug “holidays” are harmful behaviors.20,28,29 Because both ΔCpave[i] and Cpave[i]/Cp′ave[i] are calculated for an extended period of time, they are likely to be more sensitive to long-term poor adherence than to occasional drug “holidays.” Both measures can be modified for the examination of adherence in shorter time windows. Short-term adherence may then be linked to outcomes such as heart rate or blood pressure to explore the health effects of drug “holidays.” Unfortunately, we did not have frequently measured heart rates or blood pressure.
Our data show that the proposed adherence measure ΔCpave was associated with the hospital and ED visits whereas intended metoprolol concentration (Cp′) was not. Intended drug concentration does not always reflect the patient’s drug-taking behavior. A patient’s intended metoprolol concentration assumes 100% adherence. However, perfect adherence often does not occur in the clinical setting. In our study sample of 80 patients, the mean taking adherence of metoprolol was 63% and the scheduling adherence was 33%, suggesting a considerable lack of adherence. When a patient fails to take the prescribed medication appropriately, the intended drug concentration (Cp′) remains simply a target therapeutic level under perfect adherence to the physician’s prescription. It often does not represent the patient’s true drug exposure and, as such, will not likely be associated with the patient’s health outcomes.
In contrast, the deviation from the intended exposure (ΔCpave) incorporates the patient’s medication adherence. Greater values of ΔCpave indicate poorer adherence. Our data suggested that ΔCpave correlated well with other established adherence measures such as taking and scheduling adherence. As an adherence measure, ΔCpave for metoprolol is a strong correlate of health care utilization in older heart failure patients. Yet it would be reasonable to expect an association between Cp′ and health outcomes in situations where there is a clear dose-response relationship and adherence is good. Therefore the effect of Cp′ is likely to vary depending on the specific drug, the outcome considered, and the level of adherence.
As adherence measures, ΔCpave[i] and Cpave[i]/Cp′ave[i] differed. ΔCpave[i] was an estimate of the magnitude of a patient’s deviation from the intended drug exposure, whereas Cpave[i]/Cp′ave[i] estimated the relative level of the intended drug exposure that had been achieved by patients. The correlation between Cpave[i]/Cp′ave[i] and taking adherence was much stronger than that between ΔCpave[i] and taking adherence. In addition, the range of Cpave[i]/Cp′ave[i] remained relatively stable at all dose levels, whereas the range of ΔCpave[i] tended to vary across the doses, although not in a monotonic fashion (Fig 2, b and c). Therefore we believe that ΔCpave[i] might be more appropriate when dose variation is more limited. Ultimately, the choice of an appropriate adherence measure is likely to depend on the objective of the study and the drug under investigation.
Although it is not the focus of the current report, our data clearly show independent adherence effects of concomitant diuretics, ACE inhibitors, digoxin, and spironolactone among patients who were taking metoprolol. The lack of inclusion of these concomitant drugs in the final models was likely a result of their weaker effects compared with those of the metoprolol adherence measures. Correlations between the 2 pharmacokinetic-based metoprolol adherence measures and the taking and scheduling adherence of other concomitant cardiovascular drugs were relatively strong (correlation coefficients between 0.33 and 0.51); thus, when ΔCpave or Cpave[i]/Cp′ave[i] was in the model, the other drug effects were unlikely to be significant. We also noted that our sample represented patients who were prescribed metoprolol. The effects of other cardiovascular drugs in this group may not be directly comparable to the effects of the same drugs in a general patient population, in which patients may not be prescribed metoprolol.
The proposed pharmacokinetic-based measures have several limitations. First, as with other MEMS adherence measures, they assume that the correct dose of medication was consumed when the MEMS lid was opened. However, unlike MEMS taking and scheduling adherence, they account for the dosage and thus provide more flexibility in handling dosage changes. Second, the proposed measures rely on several additional assumptions, including the correctness of the pharmacokinetic model and the appropriateness of the pharmacokinetic parameters for a specific patient population. Although we did not have individual pharmacokinetic data in this study, it would be interesting to assess the performance of this method by use of individual pharmacokinetic models. Given the recent work by Vrijens and Goetghebeur14,15 showing the importance of dosing history data in the estimation of pharmacokinetic and pharmacodynamic models, we believe that the explanatory power of the proposed measures would increase significantly where plasma concentrations are available. Third, we recognize that both ΔCpave[i] and Cpave[i]/Cp′ave[i] are pharmacodynamically naive measures. Published findings on metoprolol suggested that after the drug is stopped a rebound increase in cardiac sensitivity to endogenous catecholamines was likely to ensue in the following 2 to 7 days.29 Short of a full pharmacodynamic analysis, we are investigating the relationship between the proposed measures in shorter time windows (in which drug exposure could be low) and clinical outcomes in the ensuing 7-day periods. Finally, the iterative computation of the proposed measures makes them more suitable for clinical investigations involving a small number of drugs as opposed to a general-purpose adherence measure for clinical practice.
As proposed measures, many important aspects of ΔCpave[i] and Cpave[i]/Cp′ave[i] remain to be studied. As mentioned previously, subject-specific pharmacokinetic models with individual dosing logs could be used to further improve the predictive power of pharmacokinetic-based adherence measures. Given the recent development in pharmacokinetic and pharmacodynamic models based on dosing history data,14,15 it would be of interest to compare the predictive powers of population-based and individual-based pharmacokinetic adherence measures. Such a comparative study is also likely to provide some practical guidance on the balance between the measures’ predictive power and their general applicability. Another important aspect is the measures’ utility with regard to other cardiovascular medications, especially those drugs with longer half-lives. We are currently studying this approach in patients prescribed carvedilol, a 3-compartment drug with a much longer half-life than metoprolol.
Notwithstanding these limitations, we conclude that by incorporating adherence and pharmacokinetic parameters the described adherence measures could contribute to our understanding of the relationships between medication adherence of metoprolol and health care utilization in heart failure patients.
Acknowledgments
We thank the Editor and 4 reviewers for their many constructive comments. We also thank Dr Song Mu for useful discussion during the preparation of this report.
This research was supported by grants AG19105, AG07631, HL69399, and HD042404 from the National Institutes of Health.
APPENDIX
To demonstrate the use of the iterative computational algorithm, we derived the metoprolol plasma concentration formulas at times t0 = 0, t1 = 1.0, t2 = 1.2, and t3 = 2.0 hours in an iterative fashion under the assumption that a patient took the medication at time t0 = 0 and t2 = 1.2 at a constant dose amount d.
At time t0 = 0, the patient took the medication at dose d, so d[i,0] = d and the cumulative dose D[i,0] = d[i,0] = d. From equation 1, we have Cp[i,0] = 0.
At time t1 = 1.0, the patient did not take the medication, so d[i,1] = 0. From equation 2, we derived the cumulative dose D[i,1] = d · exp(−ka) at this time, and from equation 3, we calculated the plasma concentration as follows:
which followed the standard 1-compartment model exactly.
Similarly, at time t2 = 1.2, because the subject took another dose of the medication, d[i,2] = d. The cumulative dose at this time point was calculated from equation 2 as D[i,2] = d · exp(−1.2ka) + d. From equation 3, we calculated the plasma concentration as follows:
which again followed the standard 1-compartment model.
At time t3 = 2.0, we had d[i,3] = 0 because the patient did not take the medication at this time point; the cumulative dose was as follows: D[i,3] = d · [exp(−2ka) + exp(−0.8ka)]. From equation 3, we calculated the plasma concentration at this time point as follows:
where the first term in the above-described expression represented the portion of plasma concentration contributed by the first dosing event at time t0 = 0 and the second term represented the portion contributed by the second dosing event at t2 = 1.2. This showed how the iterative algorithm was able to accommodate the cumulative drug effect in multiple dose regimens.
Footnotes
None of the authors has professional or financial conflicts of interest.
References
- 1.Eraker SA, Kirscht JP, Becker MH. Understanding and improving patient compliance. Ann Intern Med. 1984;100:258–68. doi: 10.7326/0003-4819-100-2-258. [DOI] [PubMed] [Google Scholar]
- 2.Finnerty FA, Jr, Shaw LW, Himmelsbach CK. Hypertension in the inner city. II. Detection and follow-up. Circulation. 1973;47:76–8. doi: 10.1161/01.cir.47.1.76. [DOI] [PubMed] [Google Scholar]
- 3.Sackett DL, Haynes RB, Gibson ES, Hackett BC, Taylor DW, Roberts RS, et al. Randomised clinical trial of strategies for improving medication compliance in primary hypertension. Lancet. 1975;1:1205–7. doi: 10.1016/s0140-6736(75)92192-3. [DOI] [PubMed] [Google Scholar]
- 4.Eisen SA, Miller DK, Woodward RS, Spitznagel E, Przybeck TR. The effect of prescribed daily dose frequency on patient medication compliance. Arch Intern Med. 1990;150:1881–4. [PubMed] [Google Scholar]
- 5.Monane M, Bohn RL, Gurwitz JH, Glynn RJ, Avorn J. Noncompliance with congestive heart failure therapy in the elderly. Arch Intern Med. 1994;154:433–7. [PubMed] [Google Scholar]
- 6.Ghali JK, Kadakia S, Cooper R, Ferlinz J. Precipitating factors leading to decompensation of heart failure. Traits among urban blacks. Arch Intern Med. 1988;148:2013–6. [PubMed] [Google Scholar]
- 7.Urquhart J. The electronic medication event monitor. Lessons for pharmacotherapy. Clin Pharmacokinet. 1997;32:345–56. doi: 10.2165/00003088-199732050-00001. [DOI] [PubMed] [Google Scholar]
- 8.Eisen SA, Woodward RS, Miller D, Spitznagel E, Windham CA. The effect of medication compliance on the control of hypertension. J Gen Intern Med. 1987;2:298–305. doi: 10.1007/BF02596162. [DOI] [PubMed] [Google Scholar]
- 9.Kruse W, Nikolaus T, Rampmaier J, Weber E, Schlierf G. Actual versus prescribed timing of lovastatin doses assessed by electronic compliance monitoring. Eur J Clin Pharmacol. 1993;45:211–5. doi: 10.1007/BF00315385. [DOI] [PubMed] [Google Scholar]
- 10.Rudd P, Ahmed S, Zachary V, Barton C, Bonduelle D. Improved compliance measures: applications in an ambulatory hypertensive drug trial. Clin Pharmacol Ther. 1990;48:676–85. doi: 10.1038/clpt.1990.211. [DOI] [PubMed] [Google Scholar]
- 11.Choo PW, Rand CS, Inui TS, Lee MT, Canning C, Platt R. Derivation of adherence metrics from electronic dosing records. J Clin Epidemiol. 2001;54:619–26. doi: 10.1016/s0895-4356(00)00348-6. [DOI] [PubMed] [Google Scholar]
- 12.Rubio A, Cox C, Weintraub M. Prediction of diltiazem plasma concentration curves from limited measurements using compliance data. Clin Pharmacokinet. 1992;22:238–46. doi: 10.2165/00003088-199222030-00006. [DOI] [PubMed] [Google Scholar]
- 13.Urquhart J. Patient non-compliance with drug regimens: measurement, clinical correlates, economic impact. Eur Heart J. 1996;17(Suppl A):8–15. doi: 10.1093/eurheartj/17.suppl_a.8. [DOI] [PubMed] [Google Scholar]
- 14.Vrijens B, Goetghebeur E. The impact of compliance in PK studies. Stat Methods Med Res. 1999;8:247–62. doi: 10.1177/096228029900800305. [DOI] [PubMed] [Google Scholar]
- 15.Vrijens B, Goetghebeur E. Electronic monitoring of variation in drug intakes can reduce bias and improve precision in pharmacokinetic/pharmacodynamic population studies. Stat Med. 2004;23:531–44. doi: 10.1002/sim.1619. [DOI] [PubMed] [Google Scholar]
- 16.Murray MD, Young JM, Morrow DG, Weiner M, Tu W, Hoke SC, et al. Methodology of an ongoing randomized, controlled trial to improve drug use for elderly patients with chronic heart failure. Am J Geriatr Pharmacother. 2004;2:53–65. doi: 10.1016/s1543-5946(04)90007-4. [DOI] [PubMed] [Google Scholar]
- 17.AARDEX Ltd. [March 30, 2004]; Web site. Available from: URL: http://www.aardex.net/ or http://www.aardex.ch/
- 18.Choo PW, Rand CS, Inui TS, Lee ML, Cain E, Cordeiro-Breault M, et al. Validation of patient reports, automated pharmacy records, and pill counts with electronic monitoring of adherence to antihypertensive therapy. Med Care. 1999;37:846–57. doi: 10.1097/00005650-199909000-00002. [DOI] [PubMed] [Google Scholar]
- 19.Gibaldi M, Perrier D. Pharmacokinetics. 2. New York: Marcel Dekker; 1982. [Google Scholar]
- 20.Shibata MC, Flather MD, Wang D. Systematic review of the impact of beta blockers on mortality and hospital admissions in heart failure. Eur J Heart Fail. 2001;3:351–7. doi: 10.1016/s1388-9842(01)00144-1. [DOI] [PubMed] [Google Scholar]
- 21.Psaty BM, Koepsell TD, Wagner EH, LoGerfo JP, Inui TS. The relative risk of incident coronary heart disease associated with recently stopping the use of beta-blockers. JAMA. 1990;263:1653–7. [PubMed] [Google Scholar]
- 22.AHFS drug information. Bethesda (MD): American Society of Health-System Pharmacists, Inc; 2001. [Google Scholar]
- 23.Cerqueira PM, Cesarino EJ, Mateus FH, Mere Y, Jr, Santos SR, Lanchote VL. Enantioselectivity in the steady-state pharmacokinetics of metoprolol in hypertensive patients. Chirality. 1999;11:591–7. doi: 10.1002/(SICI)1520-636X(1999)11:7<591::AID-CHIR12>3.0.CO;2-T. [DOI] [PubMed] [Google Scholar]
- 24.McDonald CJ, Overhage JM, Tierney WM, Dexter PR, Martin DK, Suico JG, et al. The Regenstrief Medical Record System: a quarter century experience. Int J Med Inf. 1999;54:225–53. doi: 10.1016/s1386-5056(99)00009-x. [DOI] [PubMed] [Google Scholar]
- 25.Murray MD, Smith FE, Fox J, Teal EY, Kesterson JG, Stiffler TA, et al. Structure, functions, and activities of a research support informatics section. J Am Med Inform Assoc. 2003;10:389–98. doi: 10.1197/jamia.M1252. [DOI] [PMC free article] [PubMed] [Google Scholar]
- 26.Le CT. Introductory biostatistics. New York: John Wiley & Sons; 2003. [Google Scholar]
- 27.SAS/STAT user’s guide. 8. Cary (NC): SAS Institute, Inc; 2004. [Google Scholar]
- 28.Rangno RE, Langlois S, Lutterodt A. Metoprolol withdrawal phenomena: mechanism and prevention. Clin Pharmacol Ther. 1982;31:8–15. doi: 10.1038/clpt.1982.2. [DOI] [PubMed] [Google Scholar]
- 29.Rangno RE, Langlois S. Comparison of withdrawal phenomena after propranolol, metoprolol and pindolol. Br JClin Pharmacol. 1982;13(Suppl 2):345S–51S. doi: 10.1111/j.1365-2125.1982.tb01939.x. [DOI] [PMC free article] [PubMed] [Google Scholar]