

Abstract
Neural responses to amplitude-modulated (AM) tones in the unanesthetized rabbit inferior colliculus (IC) were studied in an effort to establish explicit relationships between physiological and psychophysical measures of temporal envelope processing. Specifically, responses to variations in modulation depth (m) at the cell’s best modulation frequency, with and without modulation maskers, were quantified in terms of average rate and synchronization to the envelope over the entire perceptual dynamic range of depths. Statistically significant variations in the metrics were used to define neural AM detection and discrimination thresholds. Synchrony emerged at modulation depths comparable with psychophysical AM detection sensitivities in some neurons, whereas the lowest rate-based neural thresholds could not account for psychoacoustical thresholds. The majority of rate thresholds (85%) were −10 dB or higher (in 20 log m), and 16% of the population exhibited no systematic dependence of average rate on m. Neural thresholds for AM detection did not decrease systematically at higher SPLs (as observed psychophysically): thresholds remained constant or increased with level for most cells tested at multiple sound-pressure levels (SPLs). At depths higher than the rate-based detection threshold, some rate modulation-depth functions were sufficiently steep with respect to the across-trial variability of the rate to predict depth discrimination thresholds as low as 1 dB (comparable with the psychophysics). Synchrony, on the other hand, did not vary systematically with m in many cells at high modulation depths. A simple computational model was extended to reproduce several features of the modulation frequency and depth dependence of both transient and sustained pure-tone responders.
INTRODUCTION
Temporal envelope fluctuations abound in natural acoustic landscapes, and the preservation of psychophysically relevant amplitude modulations is essential for robust vocalization perception (Drullman 1995; Shannon et al. 1995), auditory grouping and stream segregation (Bregman 1990), and signal detection in the presence of competing maskers (Hall et al. 1984). Although the auditory system is often described in terms of its audio-, or spectral-frequency, tuning properties, many central neurons are actually more sensitive to degradations of the stimulus temporal envelope than to smearing of spectral content (Nagarajan et al. 2002; Theunissen and Doupe 1998).
Basic psychophysical envelope-processing tasks have received renewed attention recently, caused in large part by the success of a model of the “effective” signal processing of the auditory system (Dau et al. 1997) in predicting behavioral data that are difficult to interpret unless one assumes the existence of a bank of filters tuned in the amplitude modulation (AM) frequency domain (Bacon and Grantham 1989; Dau et al. 1997; Ewert and Dau 2000; Houtgast 1989; Kay 1982). Such a conceptual framework is fundamentally different from the assumptions of earlier models of AM perception, which describe the putative central processor as a low-pass filter (Viemeister 1979).
Physiological studies of responses to AM provided some of the motivation for psychophysical studies of frequency selectivity in the AM domain (Creutzfeldt et al. 1980; Langner and Schreiner 1988), but specific hypotheses concerning the relationships between physiological responses and perceptual signal-processing models have not been adequately examined. One possibility is that single neurons in the auditory midbrain function as modulation filters. A qualitative scan of the relevant literature suggests this may be a reasonable hypothesis, because many neurons in the inferior colliculus (IC) systematically change their responses with variations in modulation frequency (fm) and modulation depth (m) (Krishna and Semple 2000; Langner and Schreiner 1988; Mueller-Preuss et al. 1994; Rees and Moller 1983). The next portion of this introduction provides a more detailed description of the published physiological responses to AM that are relevant to this hypothesis, with a focus on the gaps in evidence that the current experiments were designed to fill.
Neural representations of sounds with dynamic temporal envelopes change dramatically as the auditory neuraxis is ascended. Much of our understanding about this transformation comes from studies of physiological responses to stimuli with systematically varied AM frequencies. From this body of work, a reasonably consistent picture has emerged: peripheral neurons seem to carry envelope-frequency information in a temporal (phase-locked code), with average rates that do not change with stimulus fm (Joris and Yin 1992). More central neurons, in contrast, often exhibit average firing rates that are strongly dependent on fm and a reduced ability to synchronously follow faster fluctuations (for a review, see Joris et al. 2004). This frequency-focused description of neural responses to AM leaves a fundamental issue pertaining to the relationships between physiology and psychophysics unclear. Specifically, modulation transfer functions (MTFs) only provide information about responses to a single (usually high) modulation depth; as a result, direct comparisons to behavioral data are difficult because the goal of much of the relevant psychoacoustics is to determine the smallest detectable or discriminable m. A major objective of this study was to obtain neural responses to stimuli with a wide range of modulation depths, including depths near psychophysical AM detection thresholds.
A few studies have reported physiological responses to variations in stimulus modulation depth. In auditory-nerve fibers (ANFs) and most ventral cochlear nucleus (VCN) units, synchronization to the envelope increases monotonically with depth, with average rates that are largely depth-independent (AN: Joris and Yin 1992; VCN: Rhode 1994). Such generalizations cannot be made about AM-depth processing at higher levels of the central auditory system because of the striking response diversity. For instance, in the superior olivary complex (SOC), changes in the response with m are strongly correlated to the units’ pure-tone response properties. Sustained pure-tone responders in the periolivary nuclei of the SOC tend to be similar to ANFs in terms of the shape of rate-and synchrony-modulation depth functions (rMDFs and sMDFs), whereas offset responders exhibit monotonically increasing rMDFs and saturating sMDFs with narrow dynamic ranges (Kuwada and Batra 1999).
Krishna and Semple (2000) provided the most complete account of neural responses at the level of the IC across a range of modulation depths. They found that average firing rates in many cells varied monotonically with m, especially near the cell’s preferred modulation frequency. The change in rate could be an increase or a decrease with m, depending on the presence of regions of excitation and suppression in the cell’s rate modulation transfer function (rMTF) and their relationship to the chosen stimulus modulation frequency. Temporal response patterns also changed with m in their study. A minimum depth was required to elicit significant synchrony in individual cells; this value ranged from as low as 10% (the lowest depth tested) in some of the neurons to 70% in others (Krishna and Semple 2000). Changes in vector strength above the minimum m were less stereotypical: synchrony in some neurons varied over a wide range of depths, but it remained constant in most cells. Results from other (less systematic) studies are in qualitative agreement with the single-unit IC modulation-depth dependence description of Krishna and Semple (Mueller-Preuss et al. 1994; Nelson et al. 1966; Rees and Moller 1983). Relatively little is known about cortical responses to variation in m; Eggermont (1994) and Liang et al. (2002) measured tone-carrier modulation transfer functions (MTFs) in primary auditory cortex neurons at several depths from 25 to 100% and concluded that 1) MDFs were monotonic and 2) neural best modulation frequencies were essentially independent of m.
A survey of this previous work allows for a qualitative description of neural responses to variations in modulation depth, but a direct and quantitative comparison of physiological responses at any level of the pathway to basic psychophysical AM detection and discrimination performance is still lacking. Two requirements for such a comparison to be made are met in this study. First, the stimulus parameter space used in the physiology was designed to match that of the psychophysics. Specifically, m was varied from below detection threshold to 100%, in some cases using step sizes smaller than the behavioral just-noticeable difference (jnd). Second, a description of the statistical variability of the neural responses was included to quantify the significance of small changes in a given response metric (e.g., average rate and synchrony). In addition, because most naturally occurring sounds have complex modulation spectra, and recent models of envelope processing were developed based on masked AM detection paradigms, a similar rate- and synchrony-based analysis was applied to responses elicited by a sinusoidal signal modulation embedded in a competing masker modulation.
The IC is an inherently interesting nucleus in which to study AM processing. Structurally, it occupies a critical position in the subcortical processing pathway, as an almost obligatory ascending synapse (Aitkin and Phillips 1984; Malmierca et al. 2002; Ramon y Cajal 1904) and a receiving station for both inhibitory and excitatory inputs converging from afferent (Warr 1982; Winer et al. 1995), efferent (Winer 2004), and intrinsic and commissural connections (Saldana and Merchan 2004). In contrast to the established anatomical description of the IC and its connections, the functional representation of modulated sounds in the IC is still a matter of debate (Joris et al. 2004), but it is clear that both magnitude (rate) and phase (synchrony) information is present in the responses of single neurons (Krishna and Semple 2000; Langner and Schreiner 1988; Rees and Moller 1983). Thus the IC apparently plays a transitional role between the temporal representation of AM in the periphery (Joris and Yin 1992) and a more rate-based code in the cortex (Liang et al. 2002).
Here, we show that changes in the average firing rates of single IC neurons in the awake Dutch-belted rabbit are generally poor predictors of human behavioral performance in psychophysical AM detection tasks. Synchronization to the envelope, on the other hand, can emerge and change at modulation depths much closer to psychoacoustical thresholds. At suprathreshold depths, the situation is different; changes in average rates can, in some neurons, account for psychophysical sensitivity in masked AM detection and AM depth discrimination.
METHODS
Animal preparation
AM responses in the IC were obtained from 198 cells in three unanesthetized female Dutch-Belted rabbits (oryctolagus cuniculus). All procedures were approved by the Syracuse University Institutional Animal Care and Use Committee and conformed to National Institutes of Health guidelines and protocols. Our preparation was developed based on techniques used in several previous studies of the awake rabbit IC and superior olivary complex (Batra et al. 1989; Kuwada et al. 1987). Before recordings began, two separate aseptic surgeries were performed to allow for chronic access to the midbrain in daily 2-hour recording sessions. In both procedures, the animals were anesthetized with ketamine (66 mg/kg) and xylazine (2 mg/kg) delivered intramuscularly, and supplemental doses were administered to maintain areflexia.
In the initial surgery, a 15-mm inner diameter stainless steel cylinder and brass headbar (aligned parallel to the sagittal suture) were centered on the midline and affixed to the exposed skull with dental acrylic and screws. The rostral edge of the cylinder was aligned with bregma and a wall of dental acrylic was built up under the posterior side of the cylinder to compensate for the slope of the skull.
Each animal was given several weeks to recover from the first surgery before it was gradually adapted to sitting in the recording chamber and exposed to auditory stimuli. The rabbit was restrained with a snug blanket around the body and placed in a plexiglass chair positioned in front of a clamp used to fix the headbar. Daily sessions were increased in duration over the course of 2–3 wk until the animal was acclimated to sitting quietly for 2 h.
A small (~3– 4 mm diameter) craniotomy was made in the skull in the second surgery. The medial edge of the hole was ~2 mm lateral of the midline, and the rostral edge was slightly forward of the middle of the cylinder. The exposed dura was rinsed with sterile saline and treated with a topical antibiotic (Bacitracin), and the cylinder was filled with a sterile silastic elastopolymer cap between sessions. A 1-to 2-day recovery period was allowed before removing the silastic cap and attempting electrode penetrations. Additional craniotomy surgeries were occasionally performed to extend the existing hole or to provide access to the opposite IC. After each of the anesthetized surgeries, Banamine (flunixin meglumine, 1 mg/kg) was administered as an analgesic.
After every session, new dural scarring was removed with forceps before reapplying Bacitracin and filling the cylinder with the polymer plug. In one rabbit, the dura was also treated with an anti-mitotic compound (5-fluorouracil; 25 mg/ml saline) before sealing the cylinder to discourage scar tissue from forming between sessions (Spinks et al. 2003). Using these daily cleaning techniques, recording sessions yielded reasonable success rates in a single IC for 3– 6 mo.
Acoustic stimuli
Sound stimuli were generated digitally and converted to analog signals using a Tucker-Davis System II D-A converter (TDT DA 3– 4). The stimuli were filtered at 20 kHz (TDT FT6) and attenuated (TDT PA4), before being passed to a headphone buffer (TDT HB6) and finally to a pair of Beyer-Dynamic speakers (DT-48). The speaker outputs were delivered through custom-made soft plastic (Hal-Hen Per-form) earmolds, and a probe tube allowed daily calibration of the closed acoustic system before each session with an Etymotic ER-7C probe microphone system. Calibration tables based on the frequency shaping introduced by the system to wideband (100 Hz to 20 kHz) noises were used to determine the attenuation values required to describe the sound levels in dB SPL (dB re: 20 μPa). Monaural (usually contralateral) or diotic stimuli were presented, depending on the properties of each individual unit (see response classification below).
Recording methods
Single-unit extracellular responses were recorded using glass-insulated tungsten microelectrodes (Bullock et al. 1988). Electrode impedances between 10 and 30 MΩ measured at 135 Hz were usually required for the successful isolation and holding of neurons, but measures of impedance were only marginally reliable as predictors of electrode performance. The electrode signal was amplified (Grass Instruments), filtered (700 Hz to 3 kHz), and AC-coupled with a TDT PC1 spike conditioner before being passed to a spike discriminator (TDT SD1) and event timer (TDT ET1). Isolated spike times were recorded with respect to a stimulus onset–triggered reference with a resolution of ±10 μs.
Before lowering the electrode, a topical anesthetic (Lidocaine) was applied to desensitize the dura. The position of the electrode was set with a stereotaxic system (Edmund), which was mounted on the cylinder affixed to the rabbit’s skull. A sharply beveled, sterile, stainless-steel guide tube (23xx gauge) was used to pierce the dura and protect the electrode tip. The guide tube was lowered by hand until its sharpened end was ~2–3 mm from the proximal (dorsal) surface of the IC. From there, the electrode was lowered independent of the guide tube until a unit was isolated. Because of the tonotopic organization of the structure (low frequencies were encountered at shallower depths) and the limited recording time, the distribution of best frequencies (BFs) of the neurons described here was biased toward lower frequencies (94% of the population had a BF <10 kHz). Electrodes were advanced from outside the double-walled soundproof booth with a hydraulic microdrive (Kopf Instruments, Tujunga, CA). Stimulus presentation, on-line data analyses, and video monitoring of the animal were also controlled from outside the booth.
At the conclusion of the recordings in each rabbit, electrolytic lesions were made in the approximate center of the three-dimensional coordinates that described the spatial distribution of the population of well-studied neurons from that specific IC. Standard histological techniques were used to confirm that the recording sites were likely within the central nucleus of the IC (ICC). However, the prolonged duration of recording from each IC made it impossible to definitively state that every unit was positioned within the ICC.
Response classification and analysis
Parameters of AM stimuli were designed for each neuron based on its responses to a battery of simpler sounds. Specifically, to study a cell’s sensitivity to changes in modulation depth, it was necessary to determine the appropriate binaural configuration, tone carrier frequency, sound-pressure level (SPL), and modulation frequency. This section describes the stimuli and response quantifications used to make those decisions.
Search Stimuli and Initial Characterization
To search for driven activity, a 500-ms Gaussian wideband (100 –10,000 Hz) noise with 10-ms cos2 ramps was presented binaurally every 1.5 s. The interaural time difference (ITD) for each presentation was randomly chosen from a uniformly distributed range from −300 (contralateral ear leading) to +300 μs (ipsilateral ear leading) in steps of 100 μs, and the spectrum level of the noise was typically fixed at a level between 5 and 20 dB SPL.
Once a unit was encountered and isolated using the search stimulus, its binaural configuration preference (contralateral, ipsilateral, diotic, or silence) was quantified by counting the number of spikes elicited by each configuration in response to five repetitions of a 10-dB SPL spectrum level (50 dB SPL rms), 500-ms noise (or silent interval) presented once per second. The bandwidth of the noise was the same as the search stimulus. Next, the unit’s BF and threshold were estimated by manually controlling the frequency and level of 100-ms pure tones (10-ms cos2 ramps) separated by 500-ms interstimulus interval (ISI).
Pure Tone Responses
Based on the audio-visually determined estimates of BF and threshold, information about the response area was obtained at two SPLs, 10 and 40 dB above threshold (Ramachandran et al. 1999), and at 15 log-spaced frequencies from an octave below to an octave above BF. Average rates were measured over the entire duration of the 200-ms tones, which were presented once per second and windowed with 10-ms cos2 onset and offset ramps. Usually just one repetition was sufficient to determine the frequency that elicited an excitatory response at the lowest tested SPL (defined as BF), but more repetitions were presented if necessary.
All stimuli presented after the response area had BF tone carriers. First, a rate-level function (RLF) was obtained, usually over a 70-dB range starting about 10 dB below the threshold estimate that was determined audio-visually. Ten repetitions per level of each 100-ms tone burst (including 10-ms cos2 ramps) were presented with 400-ms ISIs. Rates were measured over the entire 100-ms stimulus presentation window, and a peristimulus time histogram (PSTH) was constructed using a bin size of 0.5 ms. From these responses, cells were classified based on their PSTH type (onset, sustained, on+sustained, or other; similar to Krishna and Semple 2000 and Le Beau et al. 1996), RLF shape (monotonic, saturating, nonmonotonic, or other), and mean first-spike latency (FSL) across the 10 repetitions. PSTH type and FSLs were often level dependent; the SPL used to classify responses was the level used for AM stimulation (below).
Fully Modulated Am Tone Responses
Next, 100%-modulated sinusoidally AM (SAM) tone responses were recorded, usually at 15 modulation frequencies log spaced from 2 to 311 Hz. The overall SPL was fixed (i.e., there was no level increment caused by modulation) and chosen to correspond to a level on the ascending portion of the RLF. This convention was followed unless the strongest response to tones was suppression of firing rate below spontaneous activity, in which case an SPL was chosen that clearly elicited such suppression (this occurred in 9 neurons). To accommodate several cycles of low-fm stimuli, a 2-s BF tone including 50-ms cos2 ramps (a common ramp duration in AM psychophysics) was used as the carrier. Modulation was applied for the entire duration of the carrier (including the ramps). Three repetitions of each stimulus were presented with an ISI of ≥1 s. Time permitting, additional (usually higher) SPLs and fms were presented.
Four metrics were used to quantify the responses to fully modulated SAM tones. The average firing rate was computed excluding the first 100 ms to avoid onset effects, although there was usually negligible temporal adaptation to AM stimulation for stimulus modulation rates near the cell’s preferred values. Synchronization or vector strength (VS, Goldberg and Brown 1969) to the modulation period was calculated from period histograms, which were constructed with a fixed number of bins per AM cycle (64 bins). Synchronized rate (Sachs et al. 1983) was defined as the product of vector strength and average rate. Synchrony and phase values were plotted only if the vector strength was significant (Rayleigh statistic >13.8, or an equivalent P < 0.001; Mardia and Jupp 2000). In addition, at least five spikes across all three stimulus repetitions were required before a response was designated as being significantly synchronized. Envelope-locked response descriptions were computed only for the component synchronized to the stimulus fm [see footnote 1 in Krishna and Semple (2000) for a brief discussion of this issue and Khanna and Teich (1989) for ANF responses examined at other stimulus-related frequencies]. Quantifications based on average rate (rMTF), synchrony (sMTF), synchronized rate (srMTF), and response phase (pMTF) provided a modulation-frequency focused description of AM responses.
Several aspects of the MTFs were extracted for comparisons across the population and for making decisions concerning the stimulus parameters to be studied at lower modulation depths. rMTFs, sMTFs, and srMTFs were classified as all-pass, low-pass, band-pass, band-reject, or high-pass (over the range of fm tested), based on a 70% change criterion in the response above or below the cell’s best modulation frequency (BMF, fm resulting in an excitatory peak in the MTF) or worst modulation frequency (WMF, fm eliciting the strongest response suppression flanked by excitatory regions). sMTFs and srMTFs were almost exclusively band-pass or low-pass, whereas rMTFs could take on any of the five shapes (see RESULTS).
Response Modulation-Depth Dependence
Because of time limitations in the unanesthetized preparation and our goal to study a wide range of modulation depths, a single fm was used to study the response dependence on m (as opposed to obtaining complete MTFs at several depths). Modulation depth functions (MDFs) based on rate, synchrony, synchronized rate, and phase were measured at a stimulus fm set equal to the frequency at the peak of the srMTF, regardless of whether the srMTF was strictly defined as band-pass or low-pass based on the 70% drop criterion. The srMTF peak was chosen as a compromise between pure rate and pure timing analyses; time permitting, additional MDFs were obtained at other interesting fms (e.g., a rate-based WMF).
Modulation depths from −35 to 0 dB in 20 log m (0.018 < m < 1) were tested in 5- or 1-dB steps. Other than m, the stimulus parameters were identical to those used in recording the MTF. Rate and synchronization analyses were also broadly similar, except the initial 500 ms of the response was discarded, and the remaining 4.5 s (1.5 s × 3 reps) was separated into nine 500-ms segments when determining a mean and variance of the rate estimate. The 500-ms window was used because it matched that used in much of the AM psychophysical literature. Ignoring the onset at low m was more crucial for avoiding artifacts than with fully modulated stimuli because a pure-tone onset response could result in artificially high values of vector strength if the duration of the onset response interacted with the period of the modulating waveform.
To determine neural detection and discrimination thresholds, responses to different stimulus depths were tested for significant differences between one another. Neural rate-based detection threshold (θrate) was defined as the lowest m that elicited a rate different from the rate in response to the lowest tested depth (paired t-test P < 0.05). An additional condition was imposed: responses to depths higher than θrate were also required to elicit significantly different rates compared with those in response to the lowest tested depth. This requirement rarely changed the resulting thresholds in practice, but it did eliminate the effect of spurious changes in rate resulting from movement or chewing by the rabbit. When calculating rate-based neural discrimination (as opposed to the special case of detection) thresholds, the responses to each depth were treated as responses to a standard; the lowest comparison depth resulting in a significantly different rate response determined the predicted just-noticeable difference in depth. Synchrony-based detection threshold (θsync) was defined as the lowest depth that resulted in a significant value of vector strength (Rayleigh statistic > 13.8). This criterion is commonly used in physiological studies (Liang et al. 2002) and almost always resulted in thresholds matching those determined qualitatively by visually inspecting the period histograms at each depth. An alternate method for comparing metrics based on physiological responses to the psychophysical results will be presented in the Discussion.
Responses to Masked Sam Tones
In addition to the tests of sensitivity to pure-SAM stimuli, neurons were also tested for their ability to represent deterministic (SAM) envelope fluctuations in the presence of a competing stochastic (Gaussian) masker modulation. The equation for the stimuli in the masked-detection task is
where fc is the carrier frequency (set equal to the neuron’s BF) and M(t) is the masker waveform (0 when measuring absolute thresholds). Masker level was defined in terms of the root-mean-square (rms) of M(t). The compensation factor c was included so the overall power in both intervals was fixed as m and M(t) varied. The response to a range of signal m was measured for three values of the overall depth of the masker: −23, −18, and −13 dB rms. The frequency composition of M(t) was defined in terms of its bandwidth, which was set to 1/2 of the neuron’s srBMF, and center frequency, which was equal to the cell’s srBMF. This was chosen to mirror a psychophysical paradigm, which used a single AM frequency (64 Hz) and a masker bandwidth of 32 Hz (Nelson and Carney 2006). The signal AM was varied as it was in the “unmasked” MDFs, but was restricted to depths below −5 dB (20 log m) for masker levels of −23 and −18 dB rms and below −10 dB for a masker level of −13 dB rms to avoid overmodulation (i.e., overall modulation indices > 1 were not presented). Data analyses and other stimulus parameters were identical to those used for the unmasked MDFs and allowed for a description of masked neural θrate and θsync.
Implementation of the computational model
Implementation details of the phenomenological model tested here were recently described, and its responses were quantitatively compared with previously published AM physiological responses (Nelson and Carney 2004). The first stage of the overall processing cascade was an auditory-nerve model. Rate functions from this peripheral model were low-pass filtered and additively combined as same-frequency inhibitory and excitatory (SFIE) inputs that interacted with one another in two successive stages to give rise to model neurons with response properties comparable with those of cells in the ventral cochlear nucleus and IC. There are three key parameters at the level of the model IC cells that significantly change the model’s overall AM response properties. By choosing appropriate values of the time constants associated with the successive low-pass filtering properties of inhibition (τinh) and excitation (τexc), the model cell’s rBMF can be adjusted to match single-unit recordings (Nelson and Carney 2004). The relative strength of inhibition with respect to excitation (SINH,IC) determines the degree of suppression observed in the SFIE model cell at low and high fms (away from BMF). This parameter was not systematically studied in the initial modeling study, but it was crucial to account for the different AM response types that we observed in this study in groups of neurons with different pure-tone response properties.
RESULTS
Our population consisted of 198 single units characterized through the MTF and 164 cells held for at least one MDF. These cells were isolated in four ICs of three animals. All of the neurons in the sample were responsive to pure-tone carrier SAM stimuli, although a small number of isolated cells were not characterized with SAM tones because of poor responses to the short tone bursts used in the search mode or response area measurements. Furthermore, all of the neurons exhibited significant synchrony to at least one modulation rate, in contrast with cortical responses, which are often not phase-locked to the envelope over a range of fms similar to the range used here (Liang et al. 2002).
Population pure tone responses and correlations with 100% SAM responses
The heterogeneity of BF pure-tone responses in the IC is impressive compared with the responses observed in lower brain stem structures such as the cochlear nucleus (Blackburn and Sachs 1989) and remarkable compared with the highly stereotypical nature of ANF responses (Kiang et al. 1965). Because of this diversity, any classification scheme is somewhat arbitrary, because the number of potential categories is essentially unlimited and at least partially subjective. We have chosen to use a small number of classifications (4) for both PSTH type and RLF shape, including one all-encompassing “other” category.
Distributions of PSTH type across the population are shown in Fig. 1A. Sustained pure-tone responses (without a clear onset component) were the most common PSTH type (43%), whereas only 13% of the neurons were pure onset responders. Nearly a third of the population (30%) exhibited some combination of an onset and sustained response. The PSTHs of the remaining 14% of the cells did not fall neatly into one of the three other categories. This PSTH group included offset responses (n = 2), pauser-buildups (n = 6), combined onset and offset responses (n = 3), responses with regularly spaced peaks of discharge not related to the stimulus periodicity (choppers, n = 2), suppression below spontaneous rate without an excitatory region (n = 9), and unusual histograms (n = 5). Because of the paucity of pauser response types in our population (n = 6), they were not identified as a separate class (as in Le Beau et al. 1996 and Krishna and Semple 2000).
Fig. 1.

Pure-tone response characteristics across the population of 198 neurons. A: distribution of peristimulus time histogram (PSTH) types. B: distribution of rate-level function (RLF) shapes. Example PSTHs and RLFs are shown above bars in each category. Dark bottom area of each bar represents neurons that were band-pass rate-tuned to modulation frequency; rate modulation transfer functions (rMTFs) of remaining units (gray regions) did not have a single or prominent peak (see Fig. 5 for a further breakdown of MTF shapes).
Many PSTH type classifications were strongly dependent on the tone SPL; the high proportion of pure sustained responses is in part due to the fact that the neurons were grouped based on their responses at a relatively low SPL (usually on the initial ascending portion of the RLF). Typically, pauser-buildup and offset PSTHs emerged only at higher SPLs. The proportion of chopper units was probably underestimated, because the number of repetitions of the short pure tones was insufficient to perform reliable regularity analyses. Responses phase-locked to the carrier frequency were not observed, even in the seven neurons with BFs <600 Hz, although more repetitions may have been required to observe significant vector strength to the fine structure.
A characterization of the population based on the shapes of single-unit BF RLFs is shown in Fig. 1B. A 50% rate drop at high SPLs relative to the peak response was required for a RLF to be classified as nonmonotonic (as in Aitkin 1991); 24% of the neurons had a single peak and such a rate drop at high SPLs. Some units that met the 50%-drop criterion were placed in the “other” RLF shape category because of multiple peaks in the RLF or a rebound from an initial rate drop at the highest levels tested (20% of the units). The remaining cells exhibited monotonic (11%) or saturating (44%) RLF shapes over the range of levels tested (almost always 70 dB).
The pure-tone response properties examined in Fig. 1 (PSTH type and RLF shape) were broken down further with respect to the corresponding neurons’ fully modulated SAM response properties. Neurons with band-pass (BP) rMTFs (which made up 47% of the population) are shown with the dark portions of the bars in Fig. 1; cells with non-BP rMTFs are represented by the light upper segments of each bar. rMTFs in onset pure-tone responders always revealed a band-pass shape (25/26 onset cells were classified as BP over the 2- to 312-Hz fm range; one onset neuron had a rBMF of 312 Hz), whereas most rMTFs in sustained pure-tone responders (63/86) were not BP. Classifications of on + sustained or “other” pure-tone responses were not predictive of the rMTF shape: approximately one half of each category was BP tuned. Similarly, RLF shape was not predictive of the presence of a single region of excitation in the rMTF (i.e., a BP shape).
One aspect of BF pure-tone responses that has been shown to be correlated with AM responses in previous studies is the mean FSL: IC neurons with longer FSLs tend to have lower BMFs (Heil et al. 1995; Krishna and Semple 2000; Langner et al. 1987). This data set corroborates the finding of a weak inverse FSL-BMF correlation (FSL-rBMF Kendall’s τ = −0.25, P < 0.001; FSL-sBMF τ = −0.26, P < 0.001; FSL-srBMF τ = −0.23, P < 0.001). Despite the significant correlations, Fig. 2 makes it clear that FSL is in general an unreliable predictor of rBMF (the same is true for srBMF and sBMF). The different symbols in Fig. 2 denote the various PSTH types; the three major groups (sustained, onset, and on + sustained) contain neurons with a similar range of rBMFs, but the longest FSLs were found in sustained pure-tone responders. Below the scatter plot in Fig. 2 is a histogram of the FSL values across the entire population (only neurons with BP rMTFs were included in the scatter plot). There was not a significant correlation between BMF and BF (Kendall’s τ < 0.1, P > 0.1 for rBMF, sBMF, and srBMF correlations with BF) (consistent with Krishna and Semple 2000). It is worth reiterating the fact that the FSLs reported here were based on responses at a relatively low SPL as opposed to the minimum mean FSL across the entire range of levels tested with pure tones. One might expect that the use of a single low SPL to derive FSLs would result in higher estimates of latency, but this was not strictly true. Some neurons in the IC exhibited an increase in FSL with level, an effect that has been termed the “paradoxical latency shift” (Sullivan 1982). In our population, 16% of the cells revealed such a latency level dependence, in the form of a mean FSL at a higher SPL > 1 SD higher than the mean latency at the (lower) SPL used for the population analysis.
Fig. 2.
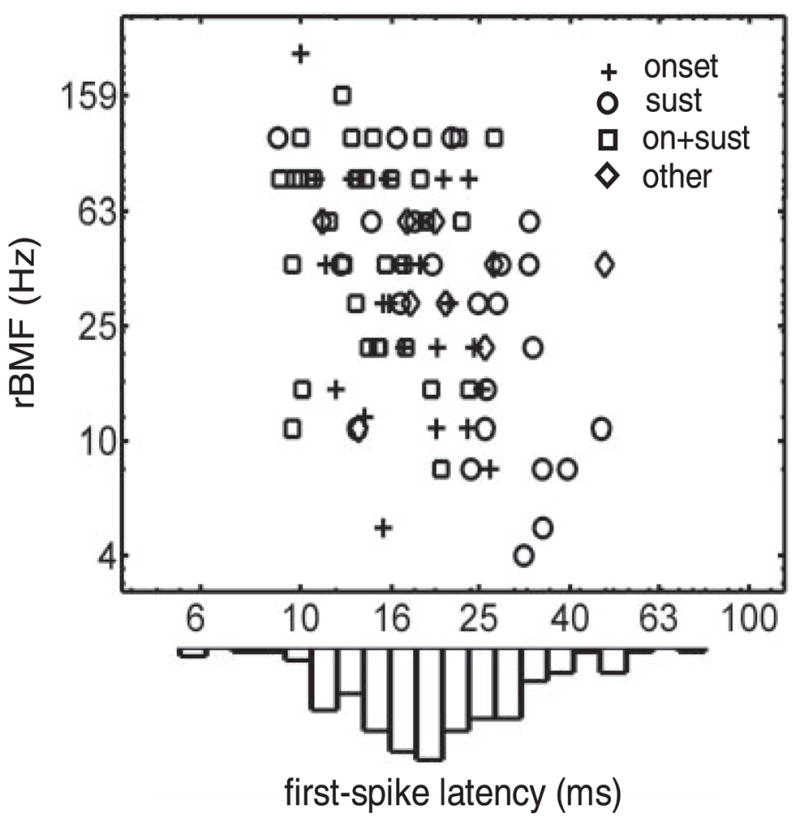
Among the neurons with a well-defined rate best modulation frequency (rBMF), cells with a longer first-spike latency (FSL) tended to have a lower rBMF. PSTH types are indicated by the symbols (categories are the same as in Fig. 1A). Histogram of FSLs shown below the axis is a description of the entire population with a measurable FSL (n = 182) not just neurons with rBMFs. Peak histogram value corresponds to a count of 27 neurons.
The range of observed rBMFs was qualitatively similar to the range of sBMFs and srBMFs, but the exact value of BMF could vary considerably across the different response quantifications in a single neuron. Figure 3 shows these points, with a comparison of BMF histograms for the three metrics (Fig. 3A) and scatter plots of the three combinations of rBMF, sBMF, and srBMF (Fig. 3B), which are summarized with a correlation coefficient. BMFs were typically between 10 and 100 Hz, although the upper bound of computed BMFs was partially biased by the range of fms used (2–311 Hz). The correlation between rBMF and sBMF (R = 0.38) was significant (P < 0.01) but considerably lower than the correlations between the srBMFs and the other two metrics (rBMF × srBMF: R = 0.88, P < 0.0001; sBMF × srBMF: R = 0.58, P < 0.0001). This is not surprising, because synchrony and rate are, by definition, correlated with synchronized rate. In any case, the even spread of points above and below the diagonal (rBMF = sBMF) in the top panel of Fig. 3B suggests that the relatively low correlation between sBMF and rBMF was not caused by a consistent bias in either direction (i.e., sBMFs were not reliably lower than rBMFs or vice versa).
Fig. 3.

Most values of rBMF, synchrony BMF (sBMF), and synchronized rate BMF (srBMF) were between 10 and 128 Hz, but BMFs based on the 3 quantifications were not always the same in single neurons. A: distributions of rBMF, sBMF, and srBMF. B: scatter plots showing the 3 combinations of BMF based on one quantification vs. BMF based on another quantification. Correlation coefficients are shown within each scatter plot. Only neurons with well-defined BMFs based on both quantifications are included in scatter plots.
Sharpness of tuning was quantified across the population of BP-tuned rMTFs with a quality factor Q = BMF/BW, where the bandwidth (BW) was defined as the width of the rMTF at 70% of the peak rate evoked at BMF. The resulting values are plotted as a function of the neuron’s rBMF in Fig. 4. Most (76%) of the Q-values were <1, and only three were >2. Onset responders to pure tones (+ symbols in Fig. 4) tended to be more sharply tuned (mean Q = 1.15) than the other unit types (mean Q = 0.61). There was no correlation between the quality factor and rBMF, suggesting a constant relative BW across the range of relevant fm. Both the overall average value (Q = 0.76) and the independence of Q on BMF are qualitatively consistent with psychophysical measures of AM-frequency tuning curves and masking patterns (Ewert and Dau 2000; Ewert et al. 2002; Houtgast 1989; Wojtczak and Viemeister 2005).
Fig. 4.

Q-values based on rMTFs with clearly defined peaks. Symbols indicate PSTH type as in Fig. 2. Inset: calculation of bandwidth at 70% of peak rate; open cross shows corresponding Q and rBMF for the neuron from inset.
The diversity of MTFs in the IC cannot be fully appreciated by limiting analyses to a determination of the cell’s BMF, because many neurons do not have a well-defined BMF (according to the 70% drop criterion both below and above BMF over a range of stimulus fm from 2 to 312 Hz). Example rMTFs representing the five shapes encountered in the rabbit IC are shown in Fig. 5, along with the distribution of the different shapes across the population. Most common were BP-tuned rMTFs, followed by low-pass (LP), high-pass (HP), band-reject (BR), and all-pass (AP) shapes. The scarcity of AP rMTFs in the IC lies in sharp contrast to peripheral (ANF) rMTFs, which are almost exclusively AP (Cooper et al. 1993; Joris and Yin 1992).
Fig. 5.

Example rMTFs and relative proportions of neurons exhibiting each rMTF shape. Unit identification numbers are included with each rMTF; representative band-pass (BP), low-pass (LP), high-pass (HP), band-reject (BR), and all-pass (AP) neurons are shown in each row.
Because IC neurons are limited in their capacity to follow envelope fluctuations faster than several hundred Hertz (Burger and Pollak 1998; Krishna and Semple 2000; Langner and Schreiner 1988; Rees and Moller 1983), MTFs based on synchrony and synchronized rate were never HP or AP; most sMTFs were either BP (49%) or LP (42%), and 70% of srMTFs were BP. It is worth noting that, although synchrony always decreased at high modulation rates, 35% (69/198) of the neurons maintained significant synchrony at the highest fm tested (usually 311 Hz; limited to 222 Hz in 30/198), and 80% (159/198) were phase-locked to the envelope at fm > 100 Hz. These proportions are comparable with those reported by Krishna and Semple (2000) in the anesthetized gerbil.
Example MTFs and MDFs
Detailed AM responses of four example neurons are highlighted in this section; they were chosen as representatives of each of the four categories of pure-tone responses (sustained, onset + sustained, onset, and other).
Representative Onset Pure-Tone Response
Without exception, onset units exhibited BP-tuned rMTFs; Fig. 6 characterizes such a neuron in more detail. Fully modulated AM responses are shown in Fig. 6A, revealing rate tuning to stimulus fm between 30 and 100 Hz. The mismatch between the peaks in the rMTF and the sMTF resulted in a srBMF (58 Hz) between the rBMF (81 Hz) and the sBMF (41 Hz). The sharpness of rMTF tuning was relatively high in this example (Q = 1.5). Raw period and PSTHs are also included in Fig. 6, B and C. Two features of the histograms in Fig. 6 were consistently observed across neurons. First, the response phase changed near BMF (as expected with period histograms constructed using a fixed starting point in time; Fig. 6B). Second, there was negligible temporal adaptation observed over the 2-s stimulation period in the PSTHs in response to AM tones near BMF (Fig. 6, C and F).
Fig. 6.

AM response properties of a neuron with a pure onset response to best frequency (BF) tones as a function of modulation frequency (fm, A–C) and modulation depth (m, D–F). A: MTFs based on rate (rMTF), synchrony (sMTF), and synchronized rate (srMTF). Asterisks correspond to the srBMF (and fm used in D–F). Quantifications including synchrony are only plotted for significant values of vector strength. B: period histograms for each fm represented in MTF. Spikes were binned into 1 period of modulation, and resulting histogram was plotted twice for clarity. C: PSTHs for each tested fm. D: modulation depth functions (MDFs), again based on rate, synchrony, and synchronized rate. Rate responses plotted with open squares were significantly different (P < 0.05) from rate response to lowest tested m (−35 dB). Bold portion of axes indicates an approximate range of behavioral AM detection thresholds. E and F: period histograms and PSTHs, respectively, for each tested m. SPL = 20 dB, fc = 2,000 Hz.
Stimulus AM depth was varied over a 35-dB range in 5-dB steps to obtain the responses shown in Fig. 6D. This corresponded to linear modulation depths ranging from 1.8 to 100%. For reference, human tone-carrier AM detection thresholds at medium SPLs and modulation rates <150 Hz are typically −25 dB (m = 5.6%) or lower (Kohlrausch et al. 2000). This range is highlighted in the panels of Fig. 6D by the thicker portions of the abscissa. First, consider the rMDF (the curve with error bars in Fig. 6D), which was typical of many neurons in the population in terms of its flat (m-independent) characteristic for depths from −35 to −15 dB. Rates that were significantly different from the rate response to the −35 dB AM tone are indicated with open squares. The lowest depth that elicited such a significant change (see Methods) was defined as the neuron’s rate threshold (θrate = −10 dB).
Plotted alongside the rMDF in Fig. 6D is the srMDF (●), which only includes values that were computed with a significant synchrony coefficient. A consistent offset between the rMDF and srMDF indicates a constant value of vector strength across depth. This is confirmed with the sMDF (○, bottom panel), in which vector strength values were all between 0.6 and 0.8. Another way to interpret depth-independent response synchrony is in terms of a modulation gain that decreases with increasing m. Single-cell synchrony-based neural thresholds were defined as the lowest modulation depth that evoked a significantly envelope-locked response (θsync = −10 dB for the neuron shown in Fig. 6). Visual inspection of the period histograms in Fig. 6E suggests that the statistical criteria used to define synchrony threshold were reasonable: response modulation clearly emerges at m = −10 dB. Also, the period histograms indicate that phase of the response did not change appreciably as m was varied. As with the PSTHs shown for different modulation frequencies (Fig. 6C), there was no evidence for gross, slow temporal adaptation in the PSTHs at different modulation depths (Fig. 6F).
Representative On + Sustained Pure-Tone Response
Several aspects of the AM responses of the on + sustained pure-tone responder (Fig. 7) are fundamentally different from those of the pure onset responders. Perhaps the most salient difference was that the entire range of 100%-AM stimuli elicited synchronized firing (from 2 to 311 Hz). The resulting rMTF reveals weaker tuning (Q = 0.81), with a peak at 81 Hz (the same rBMF as the representative onset neuron). Vector strength reached a maximum of 0.56 at 113 Hz, and synchronized rate peaked at 58 Hz. Period histograms at low fms show that the probability of firing remained relatively constant for a longer portion of the corresponding stimulus waveform than for the onset neuron, with a weak cycle-by-cycle onset adaptation component. The shape of the period histogram at the srBMF (58 Hz) was somewhat more complex, with two peaks near the onset of adaptation of the response during each cycle. This multimodal period histogram shape emerged only at higher modulation depths (Fig. 7E). PSTHs plotted in Fig. 7, C and F, again suggest minimal adaptation over a time scale on the order of hundreds of milliseconds.
Fig. 7.

AM responses of a representative neuron with an onset + sustained BF tone PSTH. Format is the same as Fig. 6. SPL = 40 dB, fc = 3,900 Hz.
The rMDF measured at 58 Hz (Fig. 7D) shows that the peak in the rMTF became apparent only at high modulation depths (θrate = 0 dB). In contrast, synchronization to the period of the modulating waveform was significant at −20 dB, and synchrony increased monotonically with increasing m. Correspondingly, the period histograms were modulated, and the timing of spikes became more phase-locked to a particular phase of the envelope as m was varied between −20 and 0 dB (Fig. 7E).
Representative Sustained Pure-Tone Response
Pure sustained responders to short tone bursts were usually associated with rMTFs that were not BP (Fig. 1A). An example of such a cell is described in terms of its MTFs and MDFs in Fig. 8. The main feature of the rMTF of Fig. 8A was the presence of a broadly tuned suppressive region (i.e., a BR rMTF); a complementary (BP) sMTF had a peak within the region of rate suppression. Taking the product of synchrony and rate resulted in a srMTF with both a region of suppression at lower fms, an excitatory region at higher fms, and a srBMF that matched the sBMF of 113 Hz (Fig. 8A). The period histograms in Fig. 8B indicate that the drop in rate was largely mediated by a suppression of firing after the onset response elicited in each cycle and that the rate recovery at higher fms was not strongly synchronized (although VS remained significant, ≤311 Hz).
Fig. 8.

AM responses of a representative neuron with a sustained BF tone PSTH. Format matched to Figs. 6 and 7. SPL = 20 dB, fc = 3,900 Hz.
Because the location of the srBMF was within the region of rate suppression, increasing the stimulus m in the MDF protocol resulted in a drop in average rate. This rate drop is quantified in the rMDF of Fig. 8D. In terms of information-carrying capacity, a rate code that is based on a decrease in firing rate is just as effective as one that requires an increase in rate as the stimulus depth is increased. However, the cell’s θrate of −10 dB based on a drop in rate was still much higher than human AM detection abilities. As with the first two example neurons, a timing-based metric such as synchrony was more sensitive to low-depth AM stimulation: the cell’s θsync was −25 dB. Also, the value of VS increased monotonically with depth; this trend was mainly observed in neurons that responded to pure tones with a substantial sustained rate (see Fig. 13B).
Fig. 13.

Changes in average rate can account for psychophysical amplitude-modulation depth discrimination, but only at high standard depths. A: comparison of neural predictions of depth discrimination performance in 20 neurons (black lines) and human psychophysical thresholds for the same task (gray connected circles, from Ewert and Dau 2004). B: raw rate MDFs (gray lines with error bars) and synchrony MDFs (black lines) for the same neurons examined in A.
Representative Inhibited Pure-Tone Response
Nine neurons in the population did not exhibit a clear excitatory response at any tested frequency or SPL using pure tones (a small island of excitation may have potentially been revealed had we used finer SPL-resolution; in that case, these neurons might belong to the type O response area category as defined in Ramachandran et al. 1999). The BFs of the units belonging to this subset were defined based on the tone frequency that evoked an inhibitory response (below spontaneous rate) at the lowest effective SPL. Figure 9 shows that the responses of such neurons can be highly dependent on the modulation properties of the stimulus. All three of the MTFs shown in Fig. 9A were LP in shape; rate and synchronized rate dropped to 70% of their peak values at ~65 Hz, whereas synchrony was ≥70% of its peak value (VSmax = 0.8) ≤ 107 Hz.
Fig. 9.

AM responses of a representative neuron that responded with a decrease in rate when stimulated using pure tones. Format is the same as Figs. 6 – 8. SPL = 10 dB, fc = 12,885 Hz.
The characteristic phase [the low-fm y-intercept of the phase-MTF (data not shown)] was ~180° out of phase with respect to those observed in the neurons shown in Figs. 6 – 8. This can be qualitatively verified by comparing the period histograms at the lowest tested fms across the four example neurons and suggests that the neuron was released from inhibition at times corresponding to the valleys of the modulating waveform. Also, in contrast to the first three examples, a weak form of slow adaptation was observed in the PSTHs: onset inhibition was slowly released over a time-course of ~1 s (this is most clearly shown by the 113-Hz PSTH; Fig. 9C).
Because there was not a clear peak in the srMTF of Fig. 9A, a modulation of 40 Hz was chosen for the MDF simply as an AM frequency within the pass-band of all three MTFs. Interestingly, based on the MDFs alone, the neurons characterized in Figs. 6D and 9D were remarkably similar (despite their obvious differences in pure-tone responses). The rMDF revealed an increase in firing rate with increasing depth (and longer effective times of release from inhibition), with a θrate of −10 dB (Fig. 9D). The synchrony-based threshold was, once again, lower than the rate threshold (θsync = −15 dB). Although VS values were similar for −15 dB ≤ m ≤ −5 dB, the corresponding period histograms were quite different. This shows one of the limitations of the synchronization coefficient alone as a general description of temporal response characteristics.
Single-unit rate- and synchrony-based AM thresholds
Performance in three basic psychoacoustic AM tasks was predicted based on changes in neural responses at different modulation depths that were quantified in terms of average rate and synchrony. The three psychophysical paradigms are 1) pure SAM detection, 2) masked SAM detection, and 3) SAM depth discrimination.
Pure Sam Detection
Human listeners can discriminate the difference between a pure tone and a SAM tone at modulation depths lower than −30 dB (Zwicker 1952). At a given SPL, performance does not systematically depend on fm or fc for modulation frequencies between 10 and 150 Hz and carrier frequencies >1,000 Hz (Kohlrausch et al. 2000). Sensitivity to SAM is best at higher SPLs, but thresholds can remain lower than −20 dB at low sensation levels (Kohlrausch et al. 2000). There is indirect psychophysical evidence suggesting that listeners probably use audio-frequency channels other than that of the carrier to perform the task at high SPLs, where the effective level is lower and peripheral saturation and compression are less likely to have a strong influence on performance (Kohlrausch et al. 2000; Ruggero et al. 1997).
Neural rate and synchrony SAM detection thresholds across the population of 164 neurons are shown in Fig. 10A as a function of the stimulus modulation rate. Consistent with the example neurons described in the previous section, the vast majority of rate thresholds (○) were −10 dB or higher (139/164 neurons). If the rate did not change across the entire range of m, thresholds were deemed immeasurable; this group of neurons is identified with the X on the axes in Fig. 10. Five neurons had a rate threshold of −20 dB, and 20 responded with a significant change in rate at −15 dB. The histogram of rate thresholds to the left of Fig. 10A reinforces the fact that rate changes in single IC neurons were, in general, poor predictors of human SAM sensitivity. There was not a strong relationship between rate thresholds and fm of stimulation, which was set equal to the most prominent peak in the cell’s srMTF.
Fig. 10.

Neural AM detection thresholds based on rate and synchrony. Axis labels marked with an X indicate that thresholds were immeasurable and that average rate was depth independent over entire dynamic range (all neurons responded with significant synchrony at m = 0 dB). A: lowest AM depth that elicited a significant change in rate (open circles) or a significant value of vector strength (crosses) for each of the 164 tested neurons. Histograms framing the y-axes in A show the distribution of rate thresholds (left axis; peak histogram value = 47 neurons) and synchrony thresholds (right axis; peak histogram value = 39 neurons). Bold portions of ordinate indicate approximate range of perceptual AM detection thresholds. B: rate threshold vs. synchrony threshold scatter plot. Points located above diagonal of equality in scatter plot indicate that the cell’s rate threshold was higher than its synchrony threshold. In both A and B, a uniformly distributed random number between −2 and 2 was added to value of threshold to facilitate visualization of responses of all of neurons. For reference, human tone-carrier AM detection thresholds at suprathreshold SPLs and modulation frequencies below ~120 Hz are between −20 and −30 dB (Kohlrausch et al. 2000).
Synchrony-based thresholds (shown in the histogram to the right of Fig. 10A) were more evenly distributed across the perceptually relevant dynamic range than the values of θrate. Twenty-eight percent (46/164) of the neurons had synchrony thresholds of −20 dB or lower; three units were significantly phase-locked at a modulation depth of −30 dB. Examination of the individual neural thresholds (Fig. 10A, X symbols) reveals no obvious trends either in maximum sensitivity or threshold distribution as a function of the stimulus fm.
Figure 10B shows a feature of the data that is suggested by but not explicitly contained in Fig. 10A: θsync was almost always lower than θrate on a neuron-by-neuron basis. In the scatter plot of Fig. 10B, this aspect of the data takes the form of almost all of the points lying above the diagonal. The three neurons that had the most sensitive synchrony thresholds (θsync = −30 dB, the 3 left points in Fig. 10B) had corresponding rate thresholds of −15 and −5 dB and one immeasurable θrate.
As mentioned above, overall SPL can affect behavioral SAM detection thresholds. The neural responses summarized in Figs. 2–10 were obtained at an SPL chosen based on individual RLFs: the SPL used for AM stimulation was set to a level on the ascending portion of the RLF, or at its peak if it was sharply nonmonotonic. One obvious question is whether the relatively poor neural rate-based thresholds might improve if a higher SPL were chosen. In 33 neurons, this question was addressed by remeasuring MTFs and MDFs at a level typically 20 – 40 dB higher than that used for the low-SPL responses. The stimulus fm for each MDF was determined based on the peak in the srMTF, which could vary across SPL (for a more detailed discussion of the level-dependence of MTF shapes, see Krishna and Semple 2000).
The resulting rate- and synchrony-based thresholds for this subset of the population are shown for both tested SPLs in Fig. 11. Thresholds that increased (i.e., sensitivity got worse) or remained the same with increasing SPL are plotted with solid lines; the other neurons, which exhibited a decrease in threshold at the higher SPL, are represented by dashed lines. The majority of rate thresholds (22/33) did not improve at high SPLs (Fig. 11A), and 11 of the comparisons revealed an increase in θrate at higher SPLs. The 11 cells that did exhibit an improvement in rate-based sensitivity with level still did not approach human detection thresholds at comparable SPLs (the lowest θrate > 40 dB SPL was 20 log m = −15 dB). Synchrony-based thresholds (Fig. 11B) were also more likely to show a decrease in sensitivity at high SPLs (16/33) than an improvement (11/33). The average θrate increased by 0.9 dB at the higher SPL, and the average θsync increased by 1.1 dB at the higher level. Overall, the trends shown in Fig. 11 suggest that the use of a relatively low SPL in the population analysis (e.g., Fig. 10) probably did not bias the results toward higher thresholds.
Fig. 11.

Increasing SPL does not systematically improve AM sensitivity in inferior colliculus (IC) neurons. A: rate-based thresholds in 33 neurons as a function of the SPL of stimulation. B: synchrony-based thresholds in the same population. In both A and B, neurons with thresholds that were level independent or increasing with SPL are depicted with solid black lines (22/33 for both rate and synchrony), and sensitivities that improved with level are plotted with the lighter gray lines.
We conclude that, for pure SAM detection, some temporal aspect of the envelope-locked response (i.e., synchrony) at the level of the IC must be taken into consideration to account for psychophysical detection thresholds based on the responses of single neurons.
Masked Sam Detection
Psychophysical experiments studying the effect of a competing masker modulation on the detectability of a SAM signal modulation have shown effects of the frequency relationship between masker and signal (Bacon and Grantham 1989; Ewert and Dau 2000; Ewert et al. 2002; Houtgast 1989; Strickland and Viemeister 1996) and of the “level” or modulation depth of the masker (Bacon and Grantham 1989; Nelson and Carney 2006; Strickland and Viemeister 1996). Because a main focus of this set of experiments was to establish the modulation-depth dependence of responses in the IC, neural masked thresholds were determined with a narrowband Gaussian masker (centered on the sinusoidal signal frequency) at several masker depths.
Over a 10-dB range of masker depths from −23 to −13 dB rms, psychophysical SAM detection thresholds in a similar task (with fm = 64 Hz, masker BW = 32 Hz, fc = 5,500 Hz, and SPL = 65 dB) increased monotonically as the masker fluctuations became stronger (more details and thresholds in a wider range of stimulus conditions can be found in Nelson and Carney 2006). The behavioral thresholds are shown in Fig. 12, along with neural thresholds obtained in 28 units, again based on rate and synchrony to the signal envelope frequency. The signal fm was set to the peak in the cell’s srBMF, and the masker bandwidth was fixed at one half of the SAM signal frequency. To avoid overmodulation (i.e., a modulation depth > 1), the signal depth was restricted to values ≤ −5 dB for masker depths of −23 and −18 dB rms and to values ≤ −10 dB for the −13 dB rms masker. As a result, there were no predicted neural thresholds at 0 dB for any masker level and no thresholds at −5 or 0 dB (20 log m) for the −13 dB rms condition.
Fig. 12.

Neural AM detection thresholds in the presence of a competing masker modulation. Thresholds are plotted as in Fig. 10A, but some neurons are represented by >1 point in these panels, if they were tested at several masker depths. Human psychophysical thresholds are plotted for reference in both panels. A: rate thresholds. B: synchrony thresholds. See text for details concerning the lack of thresholds at 0 dB (and −5 dB for the −13-dB rms masker modulation depth).
Figure 12A shows that, in general, average rates were more successful in predicting masked thresholds than they were at predicting pure SAM detection (i.e., Fig. 10). A small group of cells (8) exhibited rate thresholds within ~5 dB of the listeners’ thresholds at one or more masker depths. This is weakly suggestive that the functional contributions of rate and synchrony may depend on the range of relevant modulation depths in a given task. We will come back to this idea in the following section (see Sam Depth Discrimination), which considers a general discrimination task across the entire perceptual modulation-depth dynamic range.
Synchronization to the signal SAM was significant in some neurons at depths even lower than the behavioral thresholds, most notably at the highest tested masker modulation depth, where 7/24 neural thresholds were below the psychophysical data (Fig. 12B). As with the pure SAM detection population analysis, the distribution of synchrony thresholds was more uniform than the rate-based distribution (which was skewed toward higher or immeasurable predictions of threshold). Trends in threshold across masker depth for individual neurons are not shown in Fig. 12 for clarity, because there was not a consistently observed increase or decrease in predicted sensitivity with increasing masker level (as there was in the psychophysical data).
Sam Depth Discrimination
Another fundamental measure of envelope processing in psychoacoustics is SAM depth discrimination, which describes the ability of the system to resolve small changes in m. Pure SAM detection is a special case of this more general paradigm: the standard depth (ms) for detection is set to 0, and the comparison depth (mc) is adjusted until it is just noticeably different from the standard interval. The same procedure can be repeated for any value of ms. Psychophysical measurements of pure-tone carrier SAM-depth discrimination reveal thresholds that are approximately a constant fraction of ms for suprathreshold standard depths (Ewert and Dau 2004). In other words, Weber’s law is a reasonable first approximation to the data; a 1- or 2-dB difference in SAM depth is required to discriminate ms and mc over a range of standard depths from about −23 to −3 dB. Performance worsens at very low standard depths, where the task effectively becomes one of detection (i.e., the modulation is subthreshold in the standard interval and slightly above threshold in the comparison interval; Ewert and Dau 2004).
To determine whether SAM depth discrimination performance based on the responses of single IC neurons was comparable with perceptual thresholds, it was necessary to use higher resolution along the modulation depth axis than was used for the detection paradigms. In 20 neurons, a high-resolution MDF was obtained with step sizes smaller than behavioral jnds (1 dB in 19/20, 2 dB in 1/20; Fig. 13B). The entire 35-dB range was not usually sampled; instead, the initial coarse MDF determined the range of depths that elicited a change in rate, and the 1-dB step size analysis was limited to that range. Neural threshold was defined for a range of ms by treating the mean and SD of each rate response as the response to a standard depth and searching for the lowest comparison depth that elicited a significantly different (t-test, P < 0.05) rate response. The neural mc at threshold was required to be higher than ms; furthermore, all of the rate responses above threshold were required to be significantly different from the standard response.
Psychophysical SAM depth-discrimination thresholds are plotted in Fig. 13A (connected open circles, from Ewert and Dau 2004), along with the predictions based on significant changes in average rate in the 20 neurons (black lines without symbols). Perhaps the most salient aspect of the neural predictions is the noisiness of the functions; this reflects the relatively lenient statistical criteria that were used to identify significant changes in rate. Nonetheless, 17/19 neurons exhibited rate-based discrimination thresholds as low as 1 dB (the lowest possible value, given the 1-dB step-size), which corresponds to a Weber fraction [10 log(mc2 −ms2)/ms2)] of approximately −6 dB. All of the 1-dB depth-discrimination threshold predictions occurred for standard depths higher than −18 dB. This is consistent with the finding that all of the rate thresholds for AM detection were −20 dB or higher.
Figure 13B contains the raw rMDFs (gray lines with error bars) corresponding to the predicted performance shown in Fig. 13A. The rMDFs were all monotonic (1 was monotonically decreasing), and 12/20 neurons showed no evidence for rate saturation at high AM depths. There was no obvious dependence of rate variability on the average rate, as observed in a Poisson process (this point is addressed in more detail in the Discussion). Also included in Fig. 13B are sMDFs computed from the same responses (black lines). In contrast with the rMDFs, 17/20 sMDFs saturated at depths near 100% modulation. This suggests that rate may be more reliable than synchrony as a single-neuron predictor of depth discrimination performance at high standard depths.
Extending a computational model
The development of a model that exhibits realistic responses to AM stimuli in the IC in terms of both rate and synchrony across a wide range of modulation depths would allow for more rigorous testing of neural coding hypotheses, especially those based on population responses that may be more appropriate to compare with psychophysics than single-neuron analyses. Stimulus parameters in this study were designed for individual cells, making it difficult to directly test the feasibility of population coding strategies that combine information across a group of cells that may not all be tuned to the same stimulus dimensions. With this set of data and these motivating factors in mind, a computational model was further refined in an effort to establish its flexibility and its ability to simulate different fundamental categories of SAM responses in the IC.
The prevalence of sustained pure-tone responses in the unanesthetized rabbit IC, which were often associated with weak rate-tuning to AM (Fig. 1A), calls into question the generality of a simple phenomenological model that was developed to simulate pure onset tone responses and strong tuning to fm in the IC (Nelson and Carney 2004). In this section, we show that the adjustment of a single model parameter can give rise to model cells with a wide range of pure-tone and AM response properties. The effects of this parameter were not examined in the original modeling study.
Effectively a temporal filter, the IC stage of the SFIE model assumes the convergence of inhibitory and excitatory inputs that have low-pass or weakly band-pass sMTFs and all-pass rMTFs (typical of AN fibers and many cell types in the VCN). By assuming sluggish inhibition (a lower sMTF corner frequency) with respect to excitation, the final output of the model is rate-tuned to a modulation frequency that depends on the assumed time constants of the membrane and synaptic low-pass filtering effects. The relative strength of inhibition at the level of the IC model cells (SINH,IC) was fixed at 1.5 in Nelson and Carney (2004) but was varied here.
Predicted AM responses of the SFIE model are shown in Fig. 14, along with the responses of two example neurons, chosen to represent the two broad classes of cells with a steady-state response to pure tones and those without a steady-state response (i.e., onset responders). Actual data are plotted with black lines throughout Fig. 14; model predictions for matched stimulus conditions are shown with gray lines. In the rMTFs and rMDFs shown in Fig. 14, A and D, several model predictions are shown; SINH,IC was the parameter varied to obtain the various simulated results (the value is indicated next to each function).
Fig. 14.

Comparison of same-frequency inhibitory and excitatory (SFIE) model (gray lines) and neural data (black lines). A–C: onset + sustained responder to unmodulated tones (R9-179B); D–F: pure onset responder to unmodulated tones (R12-86A). A: rMTFs and rMDFs for the representative IC neuron and different implementations of the SFIE model. Model parameter governing relative strength of excitation with respect to inhibition (SINH,IC) is indicated next to corresponding model rMTF or rMDF. B: period histograms (as in Figs. 6 –9) for data and model (SINH,IC = 0.95) and for each tested fm. C: period histograms for each tested m. Other model parameters: τexc = 3.5 ms, τinh = 6 ms, rate scalar = 2.5. Stimulus parameters: SPL = 20 dB, fc = 800 Hz, fm for MDF = 20 Hz. D–F: same as A–C, but value of SINH,IC was set to 1.1 for period histogram comparison. Other model parameters: τexc = 1 ms, τinh = 2 ms, rate scalar = 0.5. Stimulus parameters: SPL = 40 dB, ic = 2,145 Hz, fm for MDF = 80 Hz.
The rMTF of the on + sustained neuron depicted in Fig. 14A has a peak ~20 Hz, but does not drop to near zero at lower and higher fm. In general, higher inhibitory strengths in the model resulted in stronger rate-tuning and higher rate-based AM detection thresholds. Comparing the simulated rMTFs revealed that a shape similar to the data could be obtained in the model when SINH,IC was set to 0.95. Allowing this parameter to be less than one also resulted in a sustained portion of the model response to pure tones. When modulation depth was varied (for a fixed fm of 20 Hz), the value of SINH,IC that provided the best match to the data were again 0.95. Corresponding period histograms for the data and the version of the model that best fit the rate functions are shown Fig. 14, B and C. As a function of fm (Fig. 14B), the model histograms are qualitatively similar to the data; the relative phase of the model response as a function of fm was fit to the data by choosing an appropriate fixed delay to include in the final model response (13 ms for the simulation in Fig. 14B; 11 ms for the model neuron shown in Fig. 14E). Figure 14C shows the period histogram dependence on modulation depth; in both data and model, there was a response at the lowest tested m (i.e., a sustained response to an effectively unmodulated pure tone) and synchronization to the envelope emerged at modulation depths below the rate-based AM threshold.
A similar comparison between data and model for a pure-tone onset responder with a rBMF of 80 Hz is shown in Fig. 14, D–F. To accurately predict the negligible responses at low and high fm, and at low m, it was necessary to assume inhibition with an overall strength greater than that of the excitatory input. A reasonable fit to both the rMTF and rMDF was achieved when SINH,IC was set equal to 1.1 (Fig. 14D), and the period histograms suggested that the model was also capable of predicting the temporal aspects of the responses of onset neurons in the IC. Note the lack of a consistent sustained response at modulation depths below −15 dB in both the data and model.
DISCUSSION
Relationships between single-unit neural responses in the auditory midbrain of the unanesthetized rabbit to controlled envelope fluctuations and behavioral thresholds in corresponding psychophysical tasks were examined. The stimuli used to establish neural sensitivity to AM were designed on a neuron-by-neuron basis, taking into account potential selectivity for binaural presentation mode, carrier frequency, SPL, and modulation frequency. The ranges of the resulting stimulus parameters mirrored the limits of parametric psychophysical studies of temporal modulation processing. We now turn to a discussion of the implications of the results in the context of previous work with possible alternate interpretations in mind.
Temporal versus rate information
This analysis of the average rate and envelope-locked temporal information available in neural responses over a wide range of modulation depths provides some insight into the functional contributions of these different aspects of the response at the level of the IC. To account for psychophysical pure-tone AM detection thresholds with a variation in the responses of single cells, a temporal metric (e.g., synchrony to the envelope period) must be considered. At the upper end of the modulation-domain dynamic range (m > −15 dB), where vector strength is saturated in many neurons, changes in average rate are sufficient in some neurons to predict AM depth discrimination performance.
Temporal Information: Synchrony, Phase, and Intervals
Hints of low-depth envelope synchronization can be found in previous studies of central AM processing. Significant synchronization coefficients have been measured at AM depths as low as 5% (−26 dB) in the SOC (Kuwada and Batra 1999) and IC (Rees and Moller 1983). Rhode (1994) and Krishna and Semple (2000) did not systematically use AM depths <10% (−20 dB), but some neurons in the cat VCN and gerbil IC did respond with phase-locked spikes at that depth.
Saturation of the vector strength metric at high modulation depths in the IC has been previously reported (Krishna and Semple 2000; Rees and Moller 1983; but see aggregate trends in multi-unit cluster activity in Mueller-Preuss et al. 1994), although the earlier studies were typically focused on stimulus m well above detection thresholds. A limited dynamic range does not necessarily preclude the use of changes in synchronization to code modulation depth; a population of neurons with staggered thresholds and small dynamic ranges could potentially transmit sufficient information for discrimination. This possibility remains a viable option, given the even spread of synchrony-based thresholds across the perceptually relevant AM dynamic range (Fig. 10).
The presence of synchronized spikes at low modulation depths leads to the question of whether changes in synchrony could account for AM depth discrimination performance for standard depths below −15 dB. A quantitative analysis of this question was not attempted because only nine neurons in our sample were characterized with 1-dB MDF resolution and responded with significant synchrony at depths below −15 dB. Qualitatively, the best low-depth discrimination thresholds based on single-cell synchrony would probably be found in sustained pure-tone responders, which were most likely to have monotonically increasing sMDFs. The sMDFs of these neurons were similar to those of ANFs (Joris and Yin 1992) and VCN neurons (Rhode 1994). An alternative population-based scheme for the coding of AM depth with synchronized spikes might use the spread of synchrony across neurons with different BMFs to represent an increase in stimulus m (again, also a reasonable hypothesis given the distribution of θsync shown in Fig. 10).
The synchronization coefficient is a measure of the precision of phase locking, but it is not a complete characterization of the temporal response of IC neurons. This is especially true when the shape of the period histogram changes with fm or m, which is typical of responses in the IC (Figs. 7 and 8 show clear examples of such phenomena). One step toward a more complete characterization of a neuron’s temporal response properties is to include a description of the dependence of phase on the relevant stimulus parameters (Anderson et al. 1971). For our purposes, the parameter of interest is the AM depth; response phase is plotted as a function of stimulus m (pMDFs) in Fig. 15 for 154 neurons. The main feature to be extracted from the population of pMDFs is the lack of a systematic dependence of phase on AM depth; this suggests that depth is probably not encoded by variations in phase, at least within single cells stimulated at or near their BMF. Nonetheless, the possibility remains that higher-order processing could make use of phase variations with depth across neurons with different BMFs (such that the stimulus fm is not equal to the BMF for all of the inputs to the more central processor). An evaluation of this hypothesis is not possible with this data set, because MDFs were usually only obtained at a single fm.
Fig. 15.

Response phase at srBMF does not change systematically with m. Phase MDFs for 154 neurons are shown; a significant value of vector strength was required for phase to be plotted. Not shown are y-axis phase MTF intercepts (i.e., characteristic phases), which were mainly clustered between 0 and 45°, indicating a strong response at fm low on ascending portion of stimulus envelope.
Extraction of phase information at higher levels of processing is one potential mechanism that could make use of synchronized spikes. An ISI code could also provide a representation of the stimulus AM frequency or depth that assumes phase locking. ISI histograms (ISIHs) derived from the MTFs of a subset of the population exhibited a prominent peak at 1/fm, especially at modulation rates near the sMTF peak in neurons with higher sBMFs. In general, such ISIH features are observed in spike trains with some degree of entrainment to the modulating waveform and suggest the possible existence of a first-order interval representation of AM in some cells at the level of the IC.
Rate Information: Dynamic Ranges, and Pooling
The limitations of a single-neuron rate code for AM depth in the IC are very different from the difficulties associated with rate codes for SPL in the AN (see Colburn et al. 2003). In the periphery, single-fiber rate-based pure-tone detection thresholds in quiet are in line with behavioral thresholds (Young and Barta 1986). However, predictions of suprathreshold intensity discrimination performance based on single ANF average rates are often much higher than psychophysical thresholds because of saturation and increased variance at high SPLs (Colburn et al. 2003; Heinz et al. 2001). The situation in the IC for AM coding is in a sense reversed: SAM detection cannot be accounted for with changes in rate (Figs. 10 and 11), but rate predictions of SAM depth discrimination in some neurons are consistent with psychophysical measures, at least for standard AM depths greater than −15 dB (Fig. 13).
An increase of the masker modulation depth in the masked SAM-detection task can be interpreted as an effective shift of the stimulus envelope fluctuations to a higher operating point on the MDF. The ability of average rate changes in several neurons to account for performance at the higher masker modulation depths was therefore not surprising, given the depth-discrimination predictions based on rate at higher standard depths. It is also possible that the noise masker served as a subthreshold pedestal for the signal AM, allowing for more frequent crossing of the neurons’ putative instantaneous depth threshold in the signal interval but remaining below threshold in the masker-alone interval. This is one explanation for stochastic resonance-type effects observed in biological systems (Ward et al. 2002), and a related mechanism can account for trends in psychophysical masked SAM-detection performance across a wide range of masker depths (Nelson and Carney 2006).
One way to compensate for single-cell rate-based thresholds that are higher than behavioral performance is to assume the existence of a population of neurons that respond with similar rate functions: the pooling of information across a group of cells reduces the effective variance of the rate estimate, resulting in lower thresholds. An assumption that must be met for a pooling scheme to work efficiently is that the neural responses be independent from one another; this requirement has not been established at the level of the IC. In addition, previous studies that tested the efficacy of pooling strategies in the auditory system have simulated a population response by assuming a stereotypical rate function with a fixed relationship between the mean and variance of the rate estimate (Delgutte 1987; Viemeister 1988). An analysis of this data set revealed no systematic relationship between the mean spike count and the variance of the count estimate in the unanesthetized rabbit IC (data not shown), suggesting that the assumption of a rate function with stereotypical statistical properties at the level of the IC is probably not appropriate (i.e., variance cannot be reliably predicted from the rate). Even if these issues are ignored, combining rate information across neurons can improve performance only if the rate functions exhibit some nonzero slope. Decreasing the effective response variance is not likely to significantly improve rate-based AM detection thresholds beyond the performance of the most sensitive single cells. Pooling strategies are more useful for enhancing neural thresholds in suprathreshold discrimination tasks.
Comparing animal physiology and human psychophysics
Ideally, neural and behavioral responses would be obtained and compared in the same animal, but AM sensitivity has not been determined psychophysically in the rabbit or any other lagomorph. AM detection thresholds measured with noise carriers in the chinchilla (a rodent) are better than −20 dB for modulation frequencies <64 Hz (Salvi et al. 1982). Because pure-tone carrier AM detection thresholds in humans (Kohlrausch et al. 2000) are lower than thresholds measured with noise carriers at medium to high SPLs (Viemeister 1979), it is reasonable to assume that the use of a deterministic carrier in the chinchilla experiments would yield lower thresholds as well. Furthermore, the low false-alarm rate in the animal study suggests that the chinchillas were using a relatively conservative criterion (Salvi et al. 1982), another factor that could result in elevated thresholds. Given the absence of directly relatable rabbit behavioral data, the chinchilla study provides the most compelling argument against a species difference causing the discrepancy between rate-based AM detection thresholds and human psychophysical results.
Level effects
The improvement in AM detection performance at high SPLs (Kohlrausch et al. 2000) is not easily explained with single ANF AM responses, because synchronization to the envelope decreases and average rate tends to saturate at high SPLs (Joris and Yin 1992). The synchronized responses of some neurons in the VCN to AM are less susceptible to degradation at high SPLs than for ANFs (Frisina et al. 1985), although vector strength still decreases in almost all VCN neurons at SPLs commonly used in psychophysical studies (Rhode 1994; Rhode and Greenberg 1994). In the IC, variation in SPL can have complex effects on the shapes of MTFs, including sMTF transitions from low-pass to band-pass and shifts in rBMF of an octave or more (Krishna and Semple 2000).
Figure 11 shows that AM depth sensitivity does not systematically depend on the SPL of stimulation in the IC, even when shifts in BMF with level are taken into account, and when quantifications based on both average rate and synchrony are considered. This result suggests that the psychophysical improvement in AM detection performance at high SPLs is likely caused by a spread of excitation across a population of neurons (Kohlrausch et al. 2000). In the IC, the complexity and level-dependence of tuning in both audio frequency (Ramachandran et al. 1999) and modulation frequency (Krishna and Semple 2000) serves as a reminder that the strategy used by the auditory system to code AM over a wide range of SPLs is not likely straightforward in the context of existing models of AM processing (Dau et al. 1997; Hewitt and Meddis 1994; Nelson and Carney 2004).
Alternative statistical definitions of threshold
The statistical tests used in the preceding sections to define rate and synchrony thresholds were chosen in part to facilitate comparisons with other studies of neural AM processing that used similar criteria (Liang et al. 2002), but other analyses may be more directly comparable with those used in psychophysical studies of AM detection. Most behavioral estimates of threshold correspond to a specific value of d′ (usually 1) or percent correct [often 70.7% correct in a 2-alternative forced choice (2AFC) procedure]. To ensure that the conclusions concerning the roles of rate and temporal coding were not caused by differences in the nature of these two metrics, we also explored other strategies for quantifying these responses.
To avoid making assumptions about shapes of decision-statistic distributions, a 2AFC task was simulated by comparing all pairwise combinations of the trial-by-trial responses to unmodulated (the −35-dB standard) and modulated tones. Neurometric functions were constructed by calculating the percent of trials in the modulated interval that elicited a higher value of the decision statistic (either rate or synchrony) than that in the standard interval. Rate and synchrony estimates based on nine 500-ms observation windows were available for each tested depth (as with the rate t-test analysis); this resulted in 81 comparisons used to generate each point on the neurometric functions. In the rare condition that no spikes were elicited during a 500-ms interval, the synchrony coefficient for that trial was arbitrarily set to zero. Example functions are shown in Fig. 16A. Threshold was measured by determining the lowest depth that resulted in 70.7% (or 29.3% for neurons with a reduction in rate with m) of the modulated intervals having a higher (or lower) value of rate or a higher value of vector strength (synchrony MDFs were never monotonically decreasing). Linear interpolation was used between the two successive depths that caused responses above and below 70.7% (or 29.3%) to define the final thresholds. These thresholds were deemed unmeasurable if the underlying neurometric function did not exhibit stable excursions >70.7% or <29.3% that remained above or below the appropriate criterion for higher stimulus AM depths.
Fig. 16.

A: example neurometric functions based on a simulated 2-alternative forced-choice psychophysical paradigm. Horizontal lines indicate criteria for determining threshold (70.7 and 29.3%); rate and synchrony-based functions are distinguished by filled and open circles, respectively. B: distribution of population’s rate-based thresholds. C: distribution of synchrony-based thresholds. X labeled on abscissa in C represents cells with neurometric functions that did not cross above 70.7% or below 29.3% over entire range of tested depths. In both B and C, bold portions of abscissa indicate approximate range of perceptual AM detection thresholds.
An examination of the threshold distributions derived from the neurometric functions (Fig. 16, B and C) reveals that the synchrony-based thresholds were still biased toward lower modulation depths than those based on average rates. This aspect of the distributions is consistent with the earlier analysis (i.e., Fig. 10) that used a t-test to determine rate thresholds and a minimum value of the Rayleigh statistic to establish synchrony thresholds. There were, however, several differences that emerged with the simulated 2AFC neurometric analysis when compared with the t-test and Rayleigh-statistic-based thresholds. First, there was a slight shift in rate thresholds toward lower depths: the median value of this distribution shifted from −5 to −10 dB. Several rate thresholds using the 2AFC test were as low as the most sensitive synchrony thresholds. Finally, some synchrony thresholds were unmeasurable with the 2AFC procedure, whereas all of the cells responded with a significant value of the Rayleigh statistic using a fully modulated tone (i.e., there were no unmeasurable synchrony thresholds using the Rayleigh test). Most of the cells with unmeasurable neurometric-based synchrony thresholds responded with very low rates to low modulation depths; this resulted in highly variable estimates of vector strength across trials that overwhelmed the statistical significance of synchronized spikes at higher depths.
In general, the broad conclusions made regarding rate and synchrony AM detection thresholds do not change appreciably regardless of the statistical test used to confirm the features suggested by visual inspection of many of the modulation depth functions and the corresponding period histograms.
Temporal adaptation to AM
Another question relevant to psychoacoustics is whether responses to AM in the IC adapt over time. Perceptual adaptation to AM has been shown through the measurement of decreased sensitivity (higher AM-detection thresholds) after a period of prolonged exposure to modulation (Tansley and Suffield 1983). More recently, Wojtczak and Viemeister (2005) showed that similar effects could be observed using a short-duration adaptor (i.e., a forward masker) and probe imposed on the same carrier. The effect was maximal when the masker and probe were close to one another in both frequency and time and exhibited time constants of 100 ms or longer.
Presumably, any single-cell responses consistent with the psychophysical AM forward masking effect would also show signs of temporal adaptation at the onset of stimulation. The PSTHs shown in Figs. 6 –– 8 suggest negligible variation in the magnitude of the response over time-courses of several hundred milliseconds (or any other time-course visible on the scale shown), even using fully modulated stimuli at BMF. This general finding of weak or nonexistent onset adaptation to AM was consistently observed across most neurons in our population (but see the neuron in Fig. 9). The use of typical psychophysical ramp durations (50 ms) was probably one key contributing factor, although many neurons did not respond with a clear onset component to pure tones with 10-ms ramps either (i.e., the 47% of the population identified as sustained pure-tone responders).
Preliminary results using a stimulus paradigm designed to match the psychophysical study of Wojtczak and Viemeister (2005) also suggest that the effects of previous stimulation observed in psychoacoustics are not salient in the responses of IC neurons: responses to a short (50-ms) AM probe are largely independent of the presence of a preceding 500-ms masker modulation (unpublished observations). In other words, AM responses in IC neurons seem to recover too quickly to explain the behavioral effect. Cortical neurons, in contrast, can exhibit time constants that are more in line with the psychophysical results (Bartlett and Wang 2005; Ulanovsky et al. 2004). The apparent transformation between the colliculus and the cortex can be interpreted either as increased sluggishness or as enhanced context dependence. A better understanding of the functional consequences of this transition is likely to provide new insights into relationships between single-neuron physiology and psychophysics.
Implications for models of AM processing
Both the structure and response quantification of the original signal-processing style modulation filterbank model for perceptual AM processing (Dau et al. 1997) have been simplified in its most recent implementations (Ewert and Dau 2000, 2004). Specifically, the original resonance filters (which allowed an envelope DC component to pass) were replaced with second-order band-pass filters, and the template-based optimal detector that was used to quantify responses and predict thresholds was replaced with a long-term rms energy integrator (Ewert and Dau 2000). These simplifications were psychophysically justified because they still allowed for reasonable predictions of the relevant AM behavioral data. They were also appealing because the assumption of a simple decision variable instead of a template-correlation approach allowed for a more concrete description of perceptually relevant aspects and dimensions of the stimulus.
Interestingly, a fundamental description of many IC neurons in this study is more consistent with the predictions of the original versions of Dau’s model. Most of the neurons in the unanesthetized rabbit IC responded with a sustained (DC) response to pure tones; the resonance signal-processing temporal filter predicts such a response, but the band-pass filter does not. Responses of the small proportion (13%) of onset neurons are more similar to the output of a band-pass envelope filter. With respect to the model quantification, we showed that behavioral thresholds can be more accurately predicted if some aspect of the temporal response is taken into account; the optimal detector includes such information, but the rms quantification disregards temporal structure in the response (similar to an average-rate metric in physiology).
The physiologically motivated SFIE model was shown to be flexible enough to account for the AM responses of both sustained and transient pure-tone responders as a function of fm and m. In addition, the model response exhibited envelope locking at modulation depths lower than those required to elicit an increase in rate. This feature was also observed in almost all of the neural responses. The key model parameter that allowed for the successful prediction of these aspects of the data was the strength of the putative inhibitory input to the postsynaptic model IC cell. Pharmacological studies of AM responses in the IC have shown that blocking inhibition typically does not affect the rBMF of the neuron; instead, an overall rate increase (across fm) is more common (Burger and Pollak 1998; Caspary et al. 2002; Zhang and Kelly 2003). SFIE model rMTFs (Fig. 14) are also in line with these expectations: decreasing the inhibitory strength results in a uniform shift toward higher rates in the rMTF without changing the rBMF.
Future directions
A question that deserves further consideration is “How do higher processing centers extract and use the envelope-locked timing information present in the responses of IC neurons?” One way to address this question would be to simultaneously record responses from a group of neurons with different properties to variations in AM frequency and depth. Because of the relatively broad tuning to AM observed across the population (Fig. 4), many neurons are likely to respond to a given modulation rate; an analysis of the synchronized responses across cells with different BMFs and depth thresholds might yield new ideas for coding schemes that could in turn suggest specific tests for modeling or psychophysical studies.
In addition to suggesting directions for modeling and population analyses, this study also has implications for improving predictions of responses to complex sounds such as vocalizations based on responses to simpler stimuli such as SAM tones. In general, speech and other vocalizations have dynamically fluctuating envelopes with a wide range of modulation frequencies and depths. Incorporating an appropriate description of the AM depth dependence of the response is essential to providing a complete picture of SAM tone responses in the IC and is likely to be similarly important for making reasonable predictions of vocalization responses.
Acknowledgments
We thank A. Sterns and L. Pawson for valuable technical assistance; S. Kuwada and B. Filipovic for generous contributions of time and electrode-making advice; and N. Viemeister for critical suggestions regarding the statistical comparisons of different response metrics.
GRANTS
This research was supported by National Institute of Deafness and Other Communication Disorders Grants F31-7268 to P. C. Nelson and R01-01641 to L. H. Carney.
References
- Aitkin L. Rate-level functions of neurons in the inferior colliculus of cats measured with the use of free-field sound stimuli. J Neurophysiol. 1991;65:383–392. doi: 10.1152/jn.1991.65.2.383. [DOI] [PubMed] [Google Scholar]
- Aitkin LM, Phillips SC. Is the inferior colliculus an obligatory relay in the cat auditory system? Neurosci Lett. 1984;44:259–264. doi: 10.1016/0304-3940(84)90032-6. [DOI] [PubMed] [Google Scholar]
- Anderson DJ, Rose JE, Hind JE, Brugge JF. Temporal position of discharges in single auditory nerve fibers within the cycle of a sine-wave stimulus: frequency and intensity effects. J Acoust Soc Am. 1971;49:1131–1139. doi: 10.1121/1.1912474. [DOI] [PubMed] [Google Scholar]
- Bacon SP, Grantham DW. Modulation masking: effects of modulation frequency, depth, and phase. J Acoust Soc Am. 1989;85:2575–2580. doi: 10.1121/1.397751. [DOI] [PubMed] [Google Scholar]
- Bartlett EL, Wang X. Long-lasting modulation by stimulus context in primate auditory cortex. J Neurophysiol. 2005;94:83–104. doi: 10.1152/jn.01124.2004. [DOI] [PubMed] [Google Scholar]
- Batra R, Kuwada S, Stanford TR. Temporal coding of envelopes and their interaural delays in the inferior colliculus of the unanesthetized rabbit. J Neurophysiol. 1989;61:257–268. doi: 10.1152/jn.1989.61.2.257. [DOI] [PubMed] [Google Scholar]
- Blackburn CC, Sachs MB. Classification of unit types in the anteroventral cochlear nucleus: PST histograms and regularity analysis. J Neurophysiol. 1989;62:1303–1329. doi: 10.1152/jn.1989.62.6.1303. [DOI] [PubMed] [Google Scholar]
- Bregman AS. Auditory Scene Analysis. Cambridge, MA: MIT Press; 1990. [Google Scholar]
- Bullock DC, Palmer AR, Rees A. Compact and easy-to-use tungsten-in-glass microelectrode manufacturing work station. Med Biol Eng Comput. 1988;26:669–672. doi: 10.1007/BF02447511. [DOI] [PubMed] [Google Scholar]
- Burger RM, Pollak GD. Analysis of the role of inhibition in shaping responses to sinusoidally amplitude-modulated signals in the inferior colliculus. J Neurophysiol. 1998;80:1686–1701. doi: 10.1152/jn.1998.80.4.1686. [DOI] [PubMed] [Google Scholar]
- Caspary DM, Palombi PS, Hughes LF. GABAergic inputs shape responses to amplitude modulated stimuli in the inferior colliculus. Hear Res. 2002;168:163–173. doi: 10.1016/s0378-5955(02)00363-5. [DOI] [PubMed] [Google Scholar]
- Colburn HS, Carney LH, Heinz MG. Quantifying the information in auditory-nerve responses for level discrimination. J Assoc Res Otolaryngol. 2003;4:294–311. doi: 10.1007/s10162-002-1090-6. [DOI] [PMC free article] [PubMed] [Google Scholar]
- Cooper NP, Robertson D, Yates GK. Cochlear nerve fiber responses to amplitude-modulated stimuli: variations with spontaneous rate and other response characteristics. J Neurophysiol. 1993;70:370–386. doi: 10.1152/jn.1993.70.1.370. [DOI] [PubMed] [Google Scholar]
- Creutzfeldt OD, Hellweg FC, Schreiner CE. Thalamocortical transformation of responses to complex auditory stimuli. Exp Brain Res. 1980;39:87–104. doi: 10.1007/BF00237072. [DOI] [PubMed] [Google Scholar]
- Dau T, Kollmeier B, Kohlrausch A. Modeling auditory processing of amplitude modulation. I. Detection and masking with narrow-band carriers. J Acoust Soc Am. 1997;102:2892–2905. doi: 10.1121/1.420344. [DOI] [PubMed] [Google Scholar]
- Delgutte B. Peripheral auditory processing of speech information: implications from a physiological study of intensity discrimination. In: Schouten MEH, editor. The Psychophysics of Speech Perception. Dordrecht, Germany: Nijhoff; 1987. pp. 333–353. [Google Scholar]
- Drullman R. Temporal envelope and fine structure cues for speech intelligibility. J Acoust Soc Am. 1995;97:585–592. doi: 10.1121/1.413112. [DOI] [PubMed] [Google Scholar]
- Eggermont JJ. Temporal modulation transfer functions for AM and FM stimuli in cat auditory cortex. Effects of carrier type, modulating waveform, and intensity. Hear Res. 1994;74:51–66. doi: 10.1016/0378-5955(94)90175-9. [DOI] [PubMed] [Google Scholar]
- Ewert SD, Dau T. Characterizing frequency selectivity for envelope fluctuations. J Acoust Soc Am. 2000;108:1181–1196. doi: 10.1121/1.1288665. [DOI] [PubMed] [Google Scholar]
- Ewert SD, Dau T. External and internal limitations in amplitude-modulation processing. J Acoust Soc Am. 2004;116:478–490. doi: 10.1121/1.1737399. [DOI] [PubMed] [Google Scholar]
- Ewert SD, Verhey JL, Dau T. Spectro-temporal processing in the envelope-frequency domain. J Acoust Soc Am. 2002;112:2921–2931. doi: 10.1121/1.1515735. [DOI] [PubMed] [Google Scholar]
- Frisina RD, Smith RL, Chamberlain SC. Differential encoding of rapid changes in sound amplitude by second-order auditory neurons. Exp Brain Res. 1985;60:417–422. doi: 10.1007/BF00235939. [DOI] [PubMed] [Google Scholar]
- Goldberg JM, Brown PB. Response of binaural neurons of dog superior olivary complex to dichotic tonal stimuli: some physiological mechanisms of sound localization. J Neurophysiol. 1969;32:613–636. doi: 10.1152/jn.1969.32.4.613. [DOI] [PubMed] [Google Scholar]
- Hall JW, Haggard MP, Fernandes MA. Detection in noise by spectro-temporal pattern analysis. J Acoust Soc Am. 1984;76:50–56. doi: 10.1121/1.391005. [DOI] [PubMed] [Google Scholar]
- Heil P, Schulze H, Langner G. Ontogenetic development of periodicity coding in the inferior colliculus of the Mongolian gerbil. Audit Neurosci. 1995;1:363–383. [Google Scholar]
- Heinz MG, Colburn HS, Carney LH. Evaluating auditory performance limits. I. One-parameter discrimination using a computational model for the auditory nerve. Neural Comput. 2001;13:2273–2316. doi: 10.1162/089976601750541804. [DOI] [PubMed] [Google Scholar]
- Hewitt MJ, Meddis R. A computer model of amplitude-modulation sensitivity of single units in the inferior colliculus. J Acoust Soc Am. 1994;95:2145–2159. doi: 10.1121/1.408676. [DOI] [PubMed] [Google Scholar]
- Houtgast T. Frequency selectivity in amplitude-modulation detection. J Acoust Soc Am. 1989;85:1676–1680. doi: 10.1121/1.397956. [DOI] [PubMed] [Google Scholar]
- Joris PX, Schreiner CE, Rees A. Neural processing of amplitude-modulated sounds. Physiol Rev. 2004;84:541–577. doi: 10.1152/physrev.00029.2003. [DOI] [PubMed] [Google Scholar]
- Joris PX, Yin TCT. Responses to amplitude-modulated tones in the auditory nerve of the cat. J Acoust Soc Am. 1992;91:215–232. doi: 10.1121/1.402757. [DOI] [PubMed] [Google Scholar]
- Kay RH. Hearing of modulation in sounds. Physiol Rev. 1982;62:894–975. doi: 10.1152/physrev.1982.62.3.894. [DOI] [PubMed] [Google Scholar]
- Khanna SM, Teich MC. Spectral characteristics of the responses of primary auditory-nerve fibers to amplitude-modulated signals. Hear Res. 1989;39:143–157. doi: 10.1016/0378-5955(89)90087-7. [DOI] [PubMed] [Google Scholar]
- Kiang NYS, Watanabe T, Thomas EC, Clark LF. Discharge Patterns of Single Fibers in the Cat’s Auditory Nerve. Cambridge, MA: MIT; 1965. [Google Scholar]
- Kohlrausch A, Fassel R, Dau T. The influence of carrier level and frequency on modulation and beat-detection thresholds for sinusoidal carriers. J Acoust Soc Am. 2000;108:723–734. doi: 10.1121/1.429605. [DOI] [PubMed] [Google Scholar]
- Krishna BS, Semple MN. Auditory temporal processing: responses to sinusoidally amplitude-modulated tones in the inferior colliculus. J Neurophysiol. 2000;84:255–273. doi: 10.1152/jn.2000.84.1.255. [DOI] [PubMed] [Google Scholar]
- Kuwada S, Batra R. Coding of sound envelopes by inhibitory rebound in neurons of the superior olivary complex in the unanesthetized rabbit. J Neurosci. 1999;19:2273–2287. doi: 10.1523/JNEUROSCI.19-06-02273.1999. [DOI] [PMC free article] [PubMed] [Google Scholar]
- Kuwada S, Stanford TR, Batra R. Interaural phase-sensitive units in the inferior colliculus of the unanesthetized rabbit: effects of changing frequency. J Neurophysiol. 1987;57:1338–1360. doi: 10.1152/jn.1987.57.5.1338. [DOI] [PubMed] [Google Scholar]
- Langner G, Schreiner CE. Periodicity coding in the inferior colliculus of the cat. I. Neuronal mechanisms. J Neurophysiol. 1988;60:1799–1822. doi: 10.1152/jn.1988.60.6.1799. [DOI] [PubMed] [Google Scholar]
- Langner G, Schreiner CE, Merzenich MM. Covariation of latency and temporal resolution in the inferior colliculus of the cat. Hear Res. 1987;31:197–201. doi: 10.1016/0378-5955(87)90127-4. [DOI] [PubMed] [Google Scholar]
- Le Beau FE, Rees A, Malmierca MS. Contribution of GABA- and glycine-mediate inhibition to the monaural temporal response properties of neurons in the inferior colliculus. J Neurophysiol. 1996;75:902–919. doi: 10.1152/jn.1996.75.2.902. [DOI] [PubMed] [Google Scholar]
- Liang L, Lu T, Wang X. Neural representations of sinusoidal amplitude and frequency modulations in the primary auditory cortex of awake primates. J Neurophysiol. 2002;87:2237–2261. doi: 10.1152/jn.2002.87.5.2237. [DOI] [PubMed] [Google Scholar]
- Malmierca MS, Merchan MA, Henkel CK, Oliver DL. Direct projections from cochlear nucleus complex to auditory thalamus in the rat. J Neurosci. 2002;22:10891–10897. doi: 10.1523/JNEUROSCI.22-24-10891.2002. [DOI] [PMC free article] [PubMed] [Google Scholar]
- Mardia KV, Jupp PE. Directional Statistics. New York: Wiley; 2000. [Google Scholar]
- Mueller-Preuss P, Flachskamm C, Bieser A. Neural encoding of amplitude modulation within the auditory midbrain of squirrel monkeys. Hear Res. 1994;80:197–208. doi: 10.1016/0378-5955(94)90111-2. [DOI] [PubMed] [Google Scholar]
- Nagarajan SS, Cheung SW, Bedenbaugh P, Beitel RE, Schreiner CE, Merzenich MM. Representation of spectral and temporal envelope of twitter vocalizations in common marmoset primary auditory cortex. J Neurophysiol. 2002;87:1723–1737. doi: 10.1152/jn.00632.2001. [DOI] [PubMed] [Google Scholar]
- Nelson PC, Carney LH. A phenomenological model of peripheral and central neural responses to amplitude-modulated tones. J Acoust Soc Am. 2004;116:2173–2186. doi: 10.1121/1.1784442. [DOI] [PMC free article] [PubMed] [Google Scholar]
- Nelson PC, Carney LH. Cues for masked amplitude-modulation detection. J Acoust Soc Am. 2006;120:978–990. doi: 10.1121/1.2213573. [DOI] [PMC free article] [PubMed] [Google Scholar]
- Nelson PG, Erulkar SD, Bryan JS. Responses of units in the inferior colliculus to time-varying acoustic stimuli. J Neurophysiol. 1966;29:834–860. doi: 10.1152/jn.1966.29.5.834. [DOI] [PubMed] [Google Scholar]
- Ramachandran R, Davis KA, May BJ. Rate representation of tones in noise in the inferior colliculus of decerebrate cats. J Assoc Res Otolaryngol. 1999;1:144–160. doi: 10.1007/s101620010029. [DOI] [PMC free article] [PubMed] [Google Scholar]
- Ramon y, Cajal S. Textura del Sistema Nervioso del Hombre y de los Vertebrados. Madrid: Nicolas Moya; 1904. [Google Scholar]
- Rees A, Moller AR. Responses of neurons in the inferior colliculus of the rat to AM and FM tones. Hear Res. 1983;10:301–330. doi: 10.1016/0378-5955(83)90095-3. [DOI] [PubMed] [Google Scholar]
- Rhode WS. Temporal coding of 200% amplitude modulated signals in the ventral cochlear nucleus of the cat. Hear Res. 1994;77:43–68. doi: 10.1016/0378-5955(94)90252-6. [DOI] [PubMed] [Google Scholar]
- Rhode WS, Greenberg S. Encoding of amplitude modulation in the cochlear nucleus of the cat. J Neurophysiol. 1994;71:1797–1825. doi: 10.1152/jn.1994.71.5.1797. [DOI] [PubMed] [Google Scholar]
- Ruggero MA, Rich NC, Recio A, Narayan SS, Robles L. Basilar-membrane responses to tones at the base of the chinchilla cochlea. J Acoust Soc Am. 1997;101:2151–2163. doi: 10.1121/1.418265. [DOI] [PMC free article] [PubMed] [Google Scholar]
- Sachs MB, Voigt HF, Young ED. Auditory nerve representation of vowels in background noise. J Neurophysiol. 1983;50:27–45. doi: 10.1152/jn.1983.50.1.27. [DOI] [PubMed] [Google Scholar]
- Saldana E, Merchan MA. Intrinsic and commissural connections of the inferior colliculus. In: Winer JA, Schreiner CE, editors. The Inferior Colliculus. New York: Springer; 2004. pp. 155–181. [Google Scholar]
- Salvi RJ, Giraudi DM, Henderson D, Hamernik RP. Detection of sinusoidally amplitude modulated noise by the chinchilla. J Acoust Soc Am. 1982;71:424–429. doi: 10.1121/1.387445. [DOI] [PubMed] [Google Scholar]
- Shannon RV, Zeng FG, Kamath V, Wygonski J, Elelid M. Speech recognition with primarily temporal cues. Science. 1995;270:303–304. doi: 10.1126/science.270.5234.303. [DOI] [PubMed] [Google Scholar]
- Spinks RL, Baker SN, Jackson A, Khaw PT, Lemon RN. Problem of dural scarring in recording from awake, behaving monkeys: a solution using 5-Fluorouracil. J Neurophysiol. 2003;90:1324–1332. doi: 10.1152/jn.00169.2003. [DOI] [PubMed] [Google Scholar]
- Strickland EA, Viemeister NF. Cues for discrimination of envelopes. J Acoust Soc Am. 1996;99:3638–3646. doi: 10.1121/1.414962. [DOI] [PubMed] [Google Scholar]
- Sullivan WE., III Possible neural mechanisms of target distance coding in the auditory system of the echolocating bat Myotis lucifugus. J Neurophysiol. 1982;48:1033–1047. doi: 10.1152/jn.1982.48.4.1033. [DOI] [PubMed] [Google Scholar]
- Tansley BW, Suffield JB. Time course of adaptation and recovery of channels selectively sensitive to frequency and amplitude modulation. J Acoust Soc Am. 1983;74:765–775. doi: 10.1121/1.389864. [DOI] [PubMed] [Google Scholar]
- Theunissen FE, Doupe AJ. Temporal and spectral sensitivity of complex auditory neurons in the nucleus HVc of male zebra finches. J Neurosci. 1998;18:3786–3802. doi: 10.1523/JNEUROSCI.18-10-03786.1998. [DOI] [PMC free article] [PubMed] [Google Scholar]
- Ulanovsky N, Las L, Farkas D, Nelken I. Multiple time scales of adaptation in auditory cortex neurons. J Neurosci. 2004;24:10440–10453. doi: 10.1523/JNEUROSCI.1905-04.2004. [DOI] [PMC free article] [PubMed] [Google Scholar]
- Viemeister NF. Temporal modulation transfer functions based upon modulation thresholds. J Acoust Soc Am. 1979;66:1364–1380. doi: 10.1121/1.383531. [DOI] [PubMed] [Google Scholar]
- Viemeister NF. Intensity coding and the dynamic range problem. Hear Res. 1988;34:267–274. doi: 10.1016/0378-5955(88)90007-x. [DOI] [PubMed] [Google Scholar]
- Ward LM, Neiman A, Moss F. Stochastic resonance in psychophysics and animal behavior. Biol Cybern. 2002;87:91–101. doi: 10.1007/s00422-002-0328-z. [DOI] [PubMed] [Google Scholar]
- Warr WB. Parallel ascending pathways from the cochlear nucleus: neuroanatomical evidence of functional specialization. In: Neff WD, editor. Contributions to Sensory Physiology. New York: Academic Press; 1982. pp. 1–38. [Google Scholar]
- Winer JA. Three systems of descending projections to the inferior colliculus. In: Winer JA, Schreiner CE, editors. The Inferior Colliculus. New York: Springer; 2004. pp. 231–247. [Google Scholar]
- Winer JA, Larue DT, Pollak GD. GABA and glycine in the central auditory system of the mustache bat: structural substrates for inhibitory neuronal organization. J Comp Neurol. 1995;355:317–353. doi: 10.1002/cne.903550302. [DOI] [PubMed] [Google Scholar]
- Wojtczak M, Viemeister NF. Forward masking of amplitude modulation: basic characteristics. J Acoust Soc Am. 2005;118:3198–3210. doi: 10.1121/1.2042970. [DOI] [PubMed] [Google Scholar]
- Young ED, Barta PE. Rate responses of auditory nerve fibers to tones in noise near masked threshold. J Acoust Soc Am. 1986;79:426–442. doi: 10.1121/1.393530. [DOI] [PubMed] [Google Scholar]
- Zhang H, Kelly JB. Glutamatergic and GABAergic regulation of neural responses in the inferior colliculus to amplitude modulated sounds. J Neurophysiol. 2003;90:477–490. doi: 10.1152/jn.01084.2002. [DOI] [PubMed] [Google Scholar]
- Zwicker E. Die grenzen der hörbarkeit der amplitudenmodulation und der frequenzmodulation eines tones. Acustica Akust Beih B. 1952:AB125–AB133. [Google Scholar]