

Abstract
Nuclear magnetic resonance (NMR) is a noninvasive and nondestructive tool able to access several observable quantities in biofilms such as chemical composition, diffusion, and macroscale structure and transport. Pulsed gradient spin echo (PGSE) NMR techniques were used to measure spectrally resolved biomacromolecular diffusion in biofilm biomass, extending previous research on spectrally resolved diffusion in biofilms. The dominant free water signal was nulled using an inversion recovery modification of the traditional PGSE technique in which the signal from free water is minimized in order to view the spectra of components such as the rotationally mobile carbohydrates, DNA, and proteins. Diffusion data for the major constituents obtained from each of these spectral peaks demonstrate that the biomass of the biofilm contains both a fast and slow diffusion component. The dependence of diffusion on antimicrobial and environmental challenges suggests the polymer molecular dynamics measured by NMR are a sensitive indicator of biofilm function.
Introduction
Biofilms, or microbial colonies adhered to surfaces, are found throughout nature. The prevalence of biofilms makes them of broad impact due to the role they play in medical infections, environmental remediation and industrial processes.1,2 The microbial extracellular polymeric substance (EPS), or slime, of biofilms is a biomolecular hydrogel composed of excreted polymers. Biopolymeric gels have applications ranging from biomedical tissue scaffolds and drug delivery agents to food additives. Perhaps most important, however, is the role of these gels in biological function.3-6 The EPS of biofilms plays an important but not well understood role in the biological activity of the microbes in the biofilm.4 The biofilm EPS is composed of cellular byproduct, including nucleic acids and proteins, but is thought to be predominantly polysaccharides.4,7,8 The rheology and polymer dynamics of polysaccharide gels have been extensively studied experimentally3,9 and theoretically10,11 due to their prevalence, however, such studies in biofilms are more recent.6-8,12,13
Increased knowledge of the molecular polymer dynamics in the EPS has the potential to enhance understanding of the role of stress distribution on biofilm biological function.6 Quantitative analysis of this type has recently been elucidated for Drosophilia cell development.14 Pulsed gradient spin echo (PGSE) nuclear magnetic resonance (NMR) is a primary means for noninvasively characterizing molecular diffusion.15,16 Variations and expansions of the PGSE technique have been used to explore progressively shorter times and smaller distances17,18 and to separate coherent and stochastic motion over a spectrum of times.19,20 The technique has been used extensively to separately measure the diffusion coefficient for resolvable peaks in the NMR chemical spectrum21 and has been applied to biofilms.13
The spectral resolution possible with PGSE NMR allows independent diffusion measurements of various rotationally mobile biomacromolecular components within the biofilm to be made simultaneously. These measurements provide significant experimental potential in terms of sensors that could noninvasively monitor biofilm development and environmental responses.
Biofilms are between 50–98% water22 and the biofilms used in this study are approximately 97% water in their native state.4 Unless the majority of the water signal can be eliminated, it will dominate all other spectral components of the signal. Previous NMR experiments13,23 on biofilms have used gradient pulses to preferentially weight toward less mobile protons and therefore eliminate most of the water signal. However, for diffusion studies, this also eliminates the possibility of investigating more mobile polymer protons. Other studies have looked at the less sensitive carbon 13 (C13) signal to determine biomolecular structure.24 We have used a T1 inversion recovery pulse, as seen in Figure 1, to eliminate signal from the protons with the T1 relaxation rate associated with bulk water. This preferentially reduces the bulk water signal without significantly affecting the signal from the macromolecules, resulting in a resolvable spectrum. This spectrum can then be analyzed as a function of the entire q space by acquiring it under varying gradient pulse amplitudes, g. PGSE NMR has been applied to determine the diffusion of various biomolecular components in Pseudomonas aeruginosa biofilm EPS.13 In this article, however, PGSE NMR was utilized to characterize the impact of environmental factors such as aging, temperature, and chemical challenge on the molecular dynamics and structure of the EPS hydrogel of Staphylococcus epidermidis.
Figure 1.
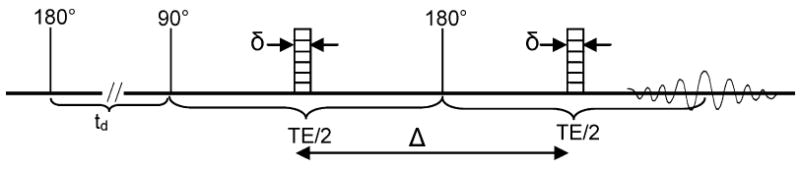
Pulse sequence shown is used to measure spectrally resolved diffusion data. The first 180° rf pulse inverts the magnetization. The inversion recovery time td is selected to minimize the water signal that is available at the initiation of the PGSE experiment with the 90° pulse. The first gradient dephases the protons, the 180° pulse between the gradients is used to reverse the precession of the protons, and the second gradient refocuses the magnetization. The rf coil detects the echo signal at the echo time, TE. The Fourier transform of this signal provides the spectrum for the sample. The signal decay as a function of an increasing gradient pulse amplitude contains the information for diffusion measurements.
Diffusion in the biofilm EPS hydrogel has been considered primarily from the perspective of hindered diffusion of solubilized molecules.25 Solubilized molecules show limited restriction in their dynamics, as measured by concentration-based methods,7 indicating that hindered diffusion alone does not seem to be a sufficient mechanism to explain biofilm resistance to antimicrobial and environmental stresses. Research on the role of molecular diffusion of EPS biomacromolecules in biofilm function has been limited, despite the fact that the biological function of the EPS biomolecular structure has been implicated in variations in biofilm formation among genetic variants of P. aeruginosa.26,27
The role of biomacromolecular dynamics in biological function has been demonstrated by changes in the viscoelastic rheological behavior of biofilms grown under different shear stress conditions28 and microbe compositions.6 Shaw et al.6 measured the creep response29 of natural and laboratory biofilms, finding a commonality of relaxation times. Such a result implies that biofilms generate an EPS biomacromolecular structure which provides a universal stress response behavior integral to the biological function of the system.14 In complex natural systems such as the biofilm matrix, signal from metabolic byproducts of varying molecular weights and interactions composed from proteins, DNA, and polysaccharides4 overlap in the NMR spectrum, and even two-dimensional NMR techniques are not sufficient to uniquely determine molecular structures. However, results presented in this paper indicate the spectral resolution combined with measurements of diffusion using PGSE NMR techniques can impact our understanding of how environmental and antimicrobial challenges affect the biofilm biomass.
Material and Methods
Biofilm Growth Conditions and Sample Preparation
Staphylococcus epidermidis colony biofilms were grown on 25 mm diameter polycarbonate membranes (Osmonics, Inc.) with a pore size of 0.22 μm on tryptic soy agar plates. An initial liquid culture was prepared using 30 g/L tryptic soy broth (TSB) and S. epidermidis cells from frozen stock ATCC# 35984. When a spectrophotometer at 600 nm is used to determine the appropriate optical density, a pipet (Rainin EDP2 Digital 100 μL) capable of delivering 10 μL drops was used to place four drops per sterilized membrane. Every 24 h the membranes were transferred to fresh agar. After four days of growth in a 37 °C incubator, the colonies were harvested and transferred into a 5 mm NMR tube. To concentrate the biomass, the tubes were gently centrifuged at 1080 g for 10 min before being placed in the magnet. The planktonic cell sample was prepared by growing multiple liquid cultures for 48 h and then centrifuging each for 10 min at 2800 g. The solid mass of cells in the bottom of each tube was collected and combined into one NMR test tube. The NMR tube was centrifuged for 10 min at 1080 g. A spectrum was collected using PGSE NMR.
Environmental and Chemical Challenges
Samples analyzed using PGSE NMR in the first 24 h after removal from the agar plate membranes were considered “fresh” samples. Samples were stored in the NMR test tube in a refrigerator at 2 °C without additional nutrients as they degraded over periods up to 20 days. These samples were removed from the refrigerator periodically and analyzed during the 20 day period using PGSE NMR. These samples were termed “aged” samples. One sample was followed over a 6 day long aging period then placed in boiling water for 30 min. To determine the impact of this thermal treatment, measurements were taken using PGSE NMR to quantify degradation on the biomacromolecular dynamics as opposed to nutrient starved degradation alone. To analyze the impact of chemical challenges on the biomacromolecular dynamics, antimicrobial agents were added to the bulk biofilm samples and allowed to react for 1 h before the centrifuge step. Three antimicrobials (quaternary ammonium compound, nisin, and glutaraldehyde) were chosen based on their broad use and their contrasting antimicrobial mechanisms. Quaternary ammonium compound (QAC) is a surfactant commonly used as a biocide that permeabilizes the cell membrane and may disrupt hydrophobic interactions within the EPS. QAC MB-80 (Lonza, lot N5228498) used for these experiments is composed of 80% n-alkyl dimethylbenzyl ammonium chloride (50% C14, 40% C12, and 10% C16) and 20% inert ingredients. Nisin, used for food preservation, is effective as an antimicrobial because it ruptures the cell wall. The nisin used to treat biofilms was 2.5% from Streptococcus lactis with FW = 3354 and stored at 5 °C. Glutaraldehyde, often used to sterilize medical and dental equipment, cross-links proteins. The Fisher glutaraldehyde was 50% W/W (lot 945160-12) with a FW = 100.12. The concentration of each antimicrobial used was 50 mg/L. These concentrations were found to be bactericidal against planktonic S. epidermidis cells (Willy Davison, Montana State University, Ph.D. Thesis, 2008, unpublished data).
NMR Pulsed Gradient Spin Echo (PGSE) Sequence
There exists a Fourier relationship between the measured NMR signal E(q,Δ) as a function of gradient pulse area q = (γgδ/2π), the experimental observation time Δ, and the average propagator Ps(R,Δ).30 The average propagator, or van Hove self-correlation function, is the probability that a particle has moved a distance R in the time Δ.30 The sequence was originally implemented as a way of measuring molecular self-diffusion D0. In the case of free Brownian motion, the propagator is the Gaussian function, Ps(R,Δ) = (4πDoΔ)−1/2 exp(−R2/4D0Δ), and the Fourier transform describes the acquired signal as E(q,Δ) = exp(−4π2q2D0Δ). A plot of ln(E(q)) versus q2 is termed a Stejskal–Tanner Plot, and the slope directly determines D0.16 In complex systems with multiple molecular populations, each with a different diffusion coefficient, the initial steeper slopes of the Stejskal–Tanner curve represent the fastest diffusing protons, and the successively shallower slopes represent the more translationally restricted populations.30 Extrapolation of each section of the curve back to the y axis allows determination of the relative percentage of protons in each population.
NMR Experimental Details
NMR experiments were conducted using a Bruker Avance DRX spectrometer system interfaced with a 250 MHz superconducting magnet. A Bruker Diff30 probe and gradient amplifiers generated magnetic field gradients. The PGSE experiment combined with a T1 inversion pulse (Figure 1) took 3–12 h per sample to run. Each experiment was performed with a minimum of 256 averages and 8–64 gradient steps from 0–3.7 T m−1. The displacement observation time Δ and gradient duration δ were set to 37.7 and 2.4 ms, respectively, and a spectral resolution of 4 kHz was used. The inversion delay time was altered for each experiment to optimize the nulling of the water signal and ranged from 0.187–0.385 s for the biofilm samples and was 2.5 s for the planktonic cell sample. All experiments were temperature controlled by the surrounding water-cooled gradients and sample temperature was maintained at 20 °C. Samples were reshimmed each time they were put back into the NMR magnet for analysis. The line width for the water after shimming was on average 20 Hz.
Results and Discussion
Molecular diffusion of biopolymer molecules in gels depends on the biopolymer molecular weight and concentration, as well as the extent of physical cross-linking present and containment within structures such as cells. The molecular weight (MW) dependence of the diffusion scales approximately as D ∝ Mw−2.31 Hence, decreases in molecular length of the biomacromolecules during chemical or environmental challenge result in an increase in the measured molecular diffusivity. In many chain systems and gels, such as the EPS, a decrease in concentration C will also increase diffusivity with the scaling D ∝ C−n, with n = 7/4 for fixed molecular weight,31 and disruption of physical cross-linking will provide greater mobility and increased diffusivity. Whether permeabilizing the cell wall or disrupting the cross-links, all of the antimicrobial and environmental challenges used in this research contribute to the above behaviors.
Water Suppression
A biofilm sample is 90% water, and about 90% of this water exhibits the translational diffusion of free water, D0 = 2 × 10⁻⁹ m2 s−1, over the observation time of 37.7 ms. The remaining 10% of water signal experiences restricted diffusion over this observation time. Most of this remaining water exhibits a diffusion of 1.3e−9 m2 s−1, but there is a small percentage that experiences a restricted diffusion as low as 4e−10 m2 s−1.
The T1 inversion recovery technique (Figure 1) relies on the fact that the majority of the water molecules in the biomass have a different T1 relaxation time than the other protons in the sample and their contribution to the NMR signal can be minimized by choosing an inversion recovery time td that targets these protons. A comparison of the diffusion components of the water peak before and after the inversion pulse indicate that we have eliminated 90% of the proton signal and removed the freely diffusing water protons with a self-diffusion coefficient D0 = 2 × 10⁻⁹ m2 s−1. The T1 inversion recovery sequence results in the remaining water peak being reduced to approximately the same amplitude as the other main spectral peak (Figure 2) and consists only of the water molecules in a more restricted translational diffusion environment, and likely most strongly associated with the biopolymers, or restricted within the gel matrix. The diffusion properties of the protons associated with other molecules in the biofilm can then be measured without being dominated by the water signal. The impact of proton exchange between water molecules and biomass molecules has been kept to a minimum by keeping the diffusion observation time small, Δ = 38 ms.
Figure 2.
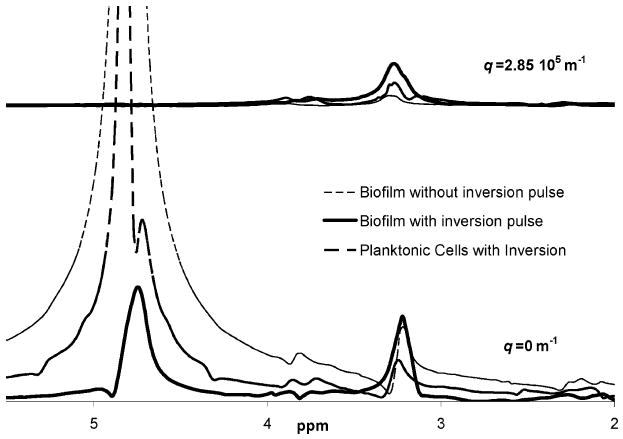
Biofilm before and after inversion. The thin black dashed line shows the dominance of the bulk water signal if the T1 inversion recovery pulse is not utilized. The spectra from a fresh biofilm after a T1 inversion recovery pulse is shown with the bold black line and compared to the spectra from a sample of planktonic cells (dashed grey line). The bottom spectra are obtained with no diffusion encoding gradient pulses (q = 0 m−1), while the upper spectra are obtained with the largest amplitude diffusion encoding gradient pulses (q = 2.85 × 10⁵ m−1). Note that the inversion recovery pulse allows information to be obtained form all spectral peaks at all q values.
Visible Spectral Peaks
The electronic environment that a proton resides in is specific to the location of that proton on the molecule to which it is bound. This electronic environment generates a magnetic shielding that determines the chemical shift observed in the NMR spectra for that proton species.32 Rotationally mobile molecules contribute narrow lines to the NMR spectra due to motional narrowing which averages out differences in the chemical shift due to the orientation of the molecules relative to the main applied magnetic field direction. Protons on rigidly bound molecules do not contribute to the NMR signal as their relaxation time is shorter than our echo time of 50.6 ms. Any signal that is observable in a narrow spectral peak is either from the side chain of a large molecule that can freely rotate, freely diffusing smaller extracellular molecules or from molecules within bacteria cells. Any signal that is still present as a narrow peak at a high q value, is necessarily translationally restricted and yet also rotationally free. It is hypothesized that most of this signal is from molecules within bacteria cells, but some could also come from the side chains of cross-linked molecules in the EPS.
Spectral Peak Assignment
In this work we assign the spectrally resolved peaks to general chemical groups which typically provide spectral features in specific frequency ranges. The signal at 4.7 ppm is assigned to the known water frequency, the signal between 3.8 and 4.1 ppm is assigned to some polysaccharide features and protein backbones, the signal between 3.0 and 3.5 ppm is assigned to polysaccharides, DNA sugar residues, and protein side chains, and the signal between 2.0 and 2.4 ppm is assigned to protein side chains and fatty acids. (Biological Magnetic Resonance Data Bank, www.bmrb.wisc.edu, and data on chemical shifts, www.bmrb.wisc.edu/ref_info).
Spectral peaks from the antimicrobial agents used in this work were not observed at these dilute concentrations, indicating that they do not contribute to the biofilm NMR spectra. Any changes in the biofilm spectra due to these antimicrobials are therefore the result of these agents cleaving either inter- or intramolecular bonds. The smaller byproducts are more rotationally free and visible in the NMR spectra as a narrow rather than broad line. Increased cross-linking would have the opposite impact, creating more restriction and a broader NMR peak for the effected component.
Fresh Biofilm Spectra
The spectra obtained using T1 inversion recovery (solid black line in Figure 2) shows that after selective removal of the dominant T1 signal, which reflects the most rotationally and translationally mobile water, other peaks are resolvable in the NMR spectra. A water peak is visible at 4.7 ppm, a comparable size peak at 3.3 ppm, and smaller peaks at 4.0 and 2.3 ppm. It is assumed that signal from the tightly bound protons in the cell membranes and highly cross-linked sections of molecules in the EPS do not significantly contribute to the fresh biofilm sample spectra due to the broad nature of the NMR signal from rigid molecules.
The biofilm sample is a highly heterogeneous sample both physically and chemically. General spectral assignments are indicated in the previous section. Biofilms are naturally variable and even with the strictly controlled growth protocols used in this work, the spectral frequency and relative amplitude of each of the spectral peaks show a degree of variation between growth batches.
The solid gray line in Figure 2 is a spectrum from a concentrated sample of planktonic cells. It is clear that some of the signal is from the cells within the biofilm, as the spectral peaks from the planktonic S. epidermidis cells overlap those from the biofilm sample. But there is also likely to be signal from smaller molecules excreted by the cells and not yet physically cross-linked in the biofilm state, as well as from regions of polymers that are rotationally free even though they are cross-linked in other regions. The top spectra in Figure 2 are acquired at the highest q value (largest gradient pulse pair amplitude). The signal remaining at this q value represents the signal that is rotationally mobile, so it gives a reasonably narrow spectral line, but that is translationally confined within a cell or on a large cross-linked biomacromolecule. Note that no water signal is present at the highest q-value, indicating that, in the biofilm sample, all motionally narrowed and rotationally free water has a translational mobility faster than 1 × 10⁻⁹ m2 s−1. Even water constrained within cellular structures can exchange across the cell membrane and is not significantly translationally restricted.
Fresh Biofilm Diffusion
The spins contributing to a single fresh biofilm spectral peak exhibit two components of diffusion, a fast and a slow component. Figure 3 shows Stejskal–Tanner plots16 of the integral of the signal under each spectral peak for two separate biofilm samples. The samples were prepared as described and although the relative amplitudes at each spectral location varied slightly between the samples, it is clear that the percentage of molecules contributing to the fast and slow diffusive regimes and the magnitudes of the observed diffusion coefficients show the same trends.
Figure 3.
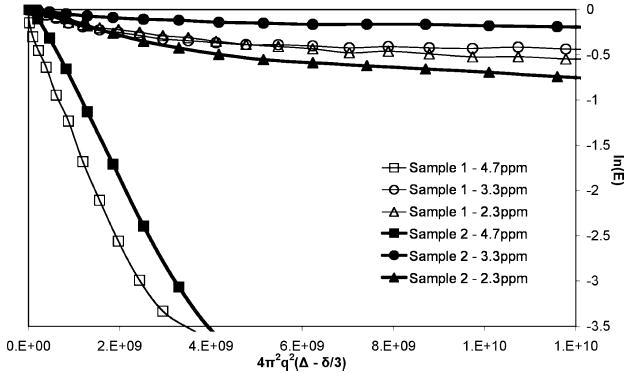
Comparison of two fresh biofilm biomass samples. This Stejskal–Tanner plot shows decay due to diffusive transport in two different growth batch biofilm samples within the first 24 h (fresh) after removal from the agar plates. There is a significant similarity between the samples. The slope of a Stejskal–Tanner plot is directly proportional to the diffusion coefficient of the molecules being measured. Each curve demonstrates two clear regimes: a fast and a slow diffusive regime. Each data point was obtained by integrating the area under a given peak for specific gradient pulse amplitude (specific q value).
These diffusion coefficients range from 10 times slower than that of free water to 103 times slower, as shown in Table 1. The T1 weighted water signal is seen to diffuse 10–100 times faster than the other peaks with diffusion coefficients of 1.3 × 10⁻⁹ m2 s−1 in agreement with the reduction of solvent molecular diffusion, which is half of the free diffusion (2.3 × 10⁻⁹ m2 s−1 at 20 °C).25 None of the water signal persists at high q values, indicating there is no measurable contribution of translationally confined water with a T1 different from free water. In contrast, the molecules contributing signal to the spectral peaks at 2.3 ppm and 3.3 ppm have over 50% of the signal that is present at q = 0 still remaining at the highest q value, providing evidence of a significant number of translationally stationary molecules due to large molecular size, strong physical cross-linking, or confinement within bacteria cells. The faster diffusion component for each specific peak is associated with more mobile molecules such as fragments of protein, polysaccharide or DNA with smaller molecular weight or nonphysically cross-linked biomolecules in the biomass.
Table 1.
Diffusion Coefficientsa
| Measured Diffusion Coefficients (m2/s)
| ||||||||||||
|---|---|---|---|---|---|---|---|---|---|---|---|---|
| peak at 2.3 ppm
|
peak at 3.3 ppm
|
peak at 4.7 ppm
|
||||||||||
| fast
|
slow
|
fast
|
slow
|
fast
|
slow
|
|||||||
| D | % | D | % | D | % | D | % | D | % | D | % | |
| fresh biofilm | 1.3E–10 | 43 | 9.0E–13 | 57 | 1.4E–10 | 35 | 3.0E–13 | 65 | 1.3E–09 | 100 | NA | 0 |
| aged 3.5 d | 2.4E–10 | 81 | 5.0E–13 | 19 | 3.1E–10 | 72 | 6.0E–13 | 28 | 1.2E–09 | 100 | NA | 0 |
| aged 5.5 d | 3.5E–10 | 91 | 2.0E–12 | 9 | 4.4E–10 | 87 | 9.0E–13 | 13 | 1.4E–09 | 100 | NA | 0 |
| boiled biofilm | 4.4E–10 | 95 | 2.0E–11 | 5 | 5.3E–10 | 100 | NA | 0 | 1.4E–09 | 100 | NA | 0 |
Boiling the Biofilm
Measurement of the spectrally resolved diffusion after heat-treating the sample at 100 °C shows the diffusion coefficients of the molecules associated with each spectral location increase significantly and almost no molecules exhibit a slow diffusion component below 4 × 10⁻¹⁰ m2 s−1. Figure 4 compares the Stejskal–Tanner plots for the same sample when it was fresh and after heat treatment. It is clear that molecular weight reduction during thermal biomacromolecular degradation, cell membrane rupture and thermal disruption of physical cross-links have almost completely eliminated signal exhibiting highly restricted diffusion seen in the fresh biofilm samples.
Figure 4.
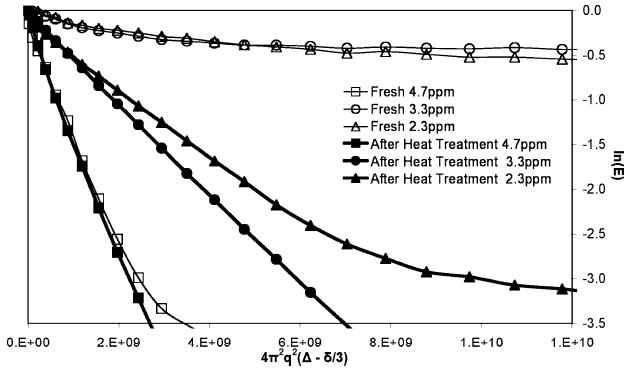
Comparison between fresh and after heat treatment. This Stejskal–Tanner plot shows decay due to diffusive transport for the same biofilm sample as Figure 3. The graph shows a comparison between the measurements made within the first 24 h (fresh) to that made after heat treatment at 100 °C. There is a dramatic decrease or elimination of any molecules exhibiting motion in the slow diffusive motion, and all the slopes increase by at least an order of magnitude indicating an increase of the same order in all diffusion coefficients.
Aging the Biofilm
Figure 5 plots the changes in the populations of the slow and fast diffusion groups as a function of the aging process. A slow breakdown of the inter- and intramolecular bonds or degradation of the cell membrane that restricts translational movement is clearly indicated by the decrease in the signal that exhibits diffusive restriction (<5 × 10⁻¹⁰ m2 s−1). There is a shift in the relative populations between the slow and fast diffusion groups with more protons exhibiting the faster diffusion as the sample ages.
Figure 5.
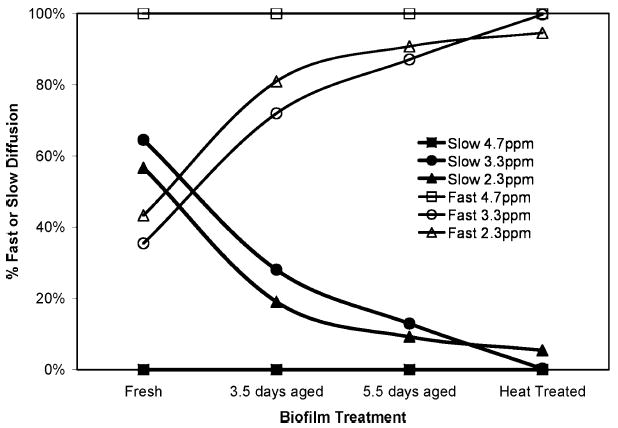
Percent weighting between fast and slow diffusion regimes. The above graph shows the percentage weighting between signal in the fast diffusion regime (>1.0 × 10⁻¹⁰ m2 s−1) and the slow diffusion regime (<2.0 × 10⁻¹¹ m2 s−1) for each of three spectral peaks. As the biofilm ages, the percentage of fast diffusing molecules increases while the percentage of slow diffusion molecules decreases. This indicates the biofilm biomass is weakening. After heat treatment, almost 100% of the signal exhibits motion in the fast diffusive regime.
It is interesting to compare the trends as the biofilm ages to the impact of heat treatment. The most significant observations are the elimination of the slow diffusion component at 3.3 ppm after boiling and the increase in the diffusion coefficient (by an order of magnitude) of the slow diffusion component at 2.3 ppm, see Table 1. It is expected that the impact of the thermal treatment would break covalent chemical bonds in large molecules contained in the EPS and disrupt cell membranes, allowing molecules to diffuse faster with fewer restrictions.
Spectral Variations
It should be noted that although the spectra vary somewhat between individual biofilm samples due to natural variation, as a specific sample ages, the spectra do not change significantly, as shown in Figure 6. For a specific growth batch, the spectra showed similar features, see Figure 10. For a specific sample, the features may have decreased or increased as the sample aged, but the general shape of the spectra remained the same. Different growth batches, however, showed different initial ratios of the peaks between 2.0 and 2.4 ppm and between 3.3 and 3.5. This indicates that the shape of the spectra is primarily influenced by the exact makeup of a specific biomass.
Figure 6.
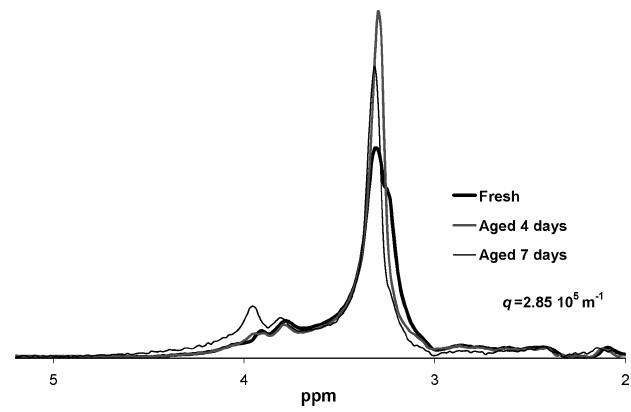
Aging impact on fresh biofilm biomass spectra. The untreated biofilm spectra that remains after application of a large diffusion encoding gradient pair (3.7 T m−1, 2.44 ms, q = 2.85 × 10⁵ m−1). A high degree of similarity exists between the spectra even after 7 days of decay. The spectra have been scaled so that the areas under the spectra are equivalent, as after 7 days of aging the absolute area under the spectra at this high q value has decreased by 93.5%.
Figure 10.
Same batch growth: Aging impact on spectra. Comparison of spectra from different treatments a few hours after application of the antimicrobial with a large diffusion encoding gradient pair (3.7 T m−1, 2.4 ms, q = 2.85 × 10⁵ m−1). These samples were all made from the same growth batch and the similarity in the spectra is evident. The spectra are all on the same absolute scale and it is clear that the total signal at the peak locations is different due to either additional cross-linking or breaking of bonds caused by the mechanistic action of each antimicrobial.
Antimicrobial Challenges
Quaternary Ammonium Compound (QAC)
Quaternary ammonium compound (QAC) is a surfactant and acts as an antimicrobial by permeabilizing the cell membranes and possibly disrupting hydrophobic interactions through modification of molecular charge. The spectrally resolved diffusion experiments show that the QAC eliminates all of the slow diffusing spectral peak components, as evident in the highest q value spectra shown in Figure 7. This is due to a breaking up of both the cells and the cross-linking, mechanisms that eliminate all the diffusive restrictions of biomacromolecules in the biofilm. All of the spectral peaks are narrowed and the broad baseline observed in the fresh biofilm is absent. These changes in the spectra appear to be a result of an increase in rotational freedom of the molecules in the cell membranes caused by permeabilization of the cell membranes and dissolution of the matrix itself. This elimination of slow diffusing biomacromolecules significantly contrasts the other antimicrobials discussed below and shown in Figures 8 and 9.
Figure 7.
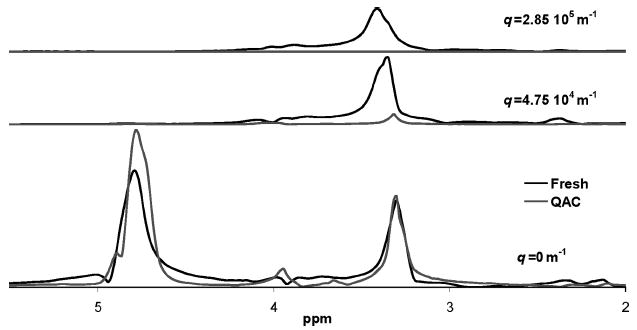
Fresh and QAC-treated biofilm biomass spectra. This comparison of biofilm treated with 50 mg/L quaternary ammonium compound (QAC) to an untreated biofilm sample shows that the amount of rotationally free compounds in the two samples are similar. This is shown in the bottom graph without any gradient. At higher gradient values, the 3.3 ppm peak present in the fresh biofilm is not present in the QAC-treated sample. There are no peaks visible at higher gradient values in the QAC sample. Thus, QAC has permeabilized the cell wall and molecules no longer show translational restriction due to confinement within stationary cells.
Figure 8.
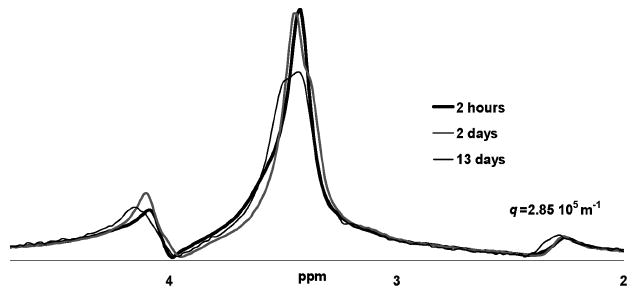
Aging impact on nisin-treated biofilm biomass spectra. The spectra that remains after application of a large diffusion encoding gradient pair (3.7 T m−1, 2.44 ms, q = 2.85 × 10⁵ m−1). A high degree of similarity exists between the spectra even after contact with the nisin for two days without additional nutrients in the refrigerator. The spectra have been scaled so that the areas under the spectra are equivalent, as after 13 days of aging, the absolute area under the spectra at this high q value has decreased by 77%.
Figure 9.
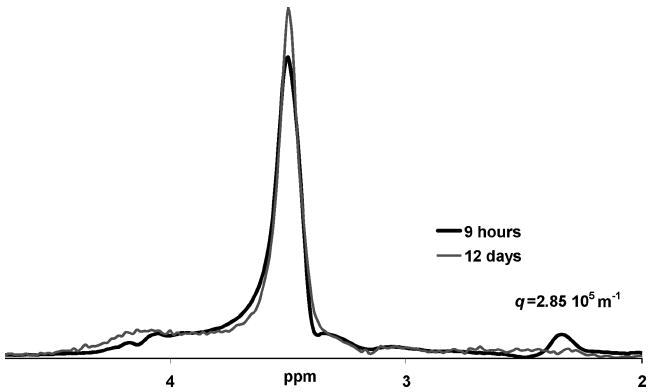
Aging impact on glutaraldehyde-treated biofilm biomass spectra. The spectra that remains after application of a large diffusion encoding gradient pair (3.7 T m−1, 2.4 ms, q = 2.85 × 10⁵ m−1). After contact with the glutaraldehyde for 12 days, without additional nutrients in the refrigerator, the signal contributing to the peak at 2.3 ppm is no longer present at this high q value. This indicates a longtime cross-linking or bond breaking action by the glutaraldehyde on the molecules that contribute to this region of the spectra. The spectra have been scaled so that the areas under the spectra are equivalent, as after 12 days of aging, the absolute area under the spectra at this high q value has decreased by 81%.
Nisin
The nisin-treated biofilm sample did not indicate a significant change in the diffusive properties. Comparison between the treated and the untreated spectra at the highest q value also showed no impact due to the nisin antimicrobial. When the biofilm is kept in contact with the nisin and aged without additional nutrients in the refrigerator, no significant changes in the spectra were noted, Figure 8. This clearly indicates the significant difference in molecular level mechanisms for biofilm degradation. The concentration of the nisin used was consistent for comparison. Changes may be observed if the experiment was repeated at higher concentrations.
Glutaraldehyde
A comparison between an untreated biofilm sample and a glutaraldehyde-treated biofilm sample from the same growth batch immediately after preparation did not indicate a significant change in the diffusive properties due to the glutaraldehyde treatment. However, a comparison between the spectra from the treated sample before and after aging spectra (at the highest q value) indicates as the biofilm is kept in contact with the glutaraldehyde, and aged without additional nutrients in the refrigerator, the peak at 2.3 ppm, attributed to protein side chains and fatty acids, disappears (Figure 9).
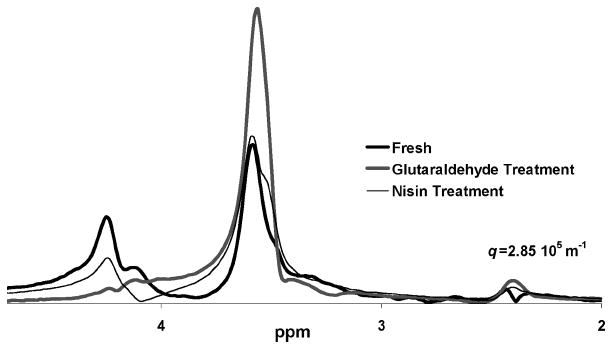
Spectral Comparison
A comparison of nisin and glutaraldehyde antimicrobials after a few hours of contact with the biomass versus an untreated sample is shown in Figure 10. These samples were all made from the same growth batch and the similarity in the spectra is evident. The spectra are shown at the highest q value on an absolute scale and, therefore, represent the relative amount of signal at each spectral location that is highly translationally restricted. Differences can be attributed to additional cross-linking, breaking of bonds, and changes in the cell wall that these chemicals are known to cause. It is interesting to note that the spectral location of these peaks is unchanged by the addition of the antimicrobials. The quaternary ammonium compound sample spectrum is not shown as it is zero at this high q value, as discussed previously. The nisin shows no significant difference in the spectra compared to the untreated sample, indicating the impact of this concentration of nisin on molecular dynamics is not significant. The glutaraldehyde generates an increase in the signal at 3.4 ppm relative to the untreated sample, indicating a reduction of mobility likely due to cross-linking within the cells. It should be noted that nothing can be concluded from the relative signal at 4.7 ppm as this is the water remaining after T1 inversion and differences are due primarily to sample heterogeneities that impact the degree of crushing caused by the T1 inversion pulse.
Conclusions
We present the first PGSE NMR measurements of the impact of environmental and chemical challenges on the biomacromolecular dynamics in medically relevant Staphylococcus epidermidis biofilm material. The data clearly demonstrate the ability of PGSE NMR to characterize molecular dynamics in biofilms, providing a basis for sensors that can indicate the state of the biofilm after thermal or chemical treatment and provide information to further understand the molecular level mechanisms of such treatments. Aging of the biofilm biomass is seen to cause a fairly slow degradation of molecular weight and physical cross-linking of biomacromolecules, including those within cell membranes, as seen by a steady decrease in the amount of biomacromolecules with a slow component of diffusion and an increase in the amplitude of that slow diffusive motion. In contrast, thermal treatment by boiling causes nearly complete elimination of biomacromolecules with a slow diffusion, and the small number of biomacromolecules remaining with a slow diffusive motion exhibit diffusivity of an order of magnitude larger than that due to aging. This observation clearly reflects the intense degradation of both the EPS matrix and the cells caused by thermal treatment.
The impact of chemical antimicrobial agents on the biomacromolecular diffusion is more complicated and shows significant differences in the molecular mechanisms of action on the biomass. No specific spectral peak variation was assignable to a specific antimicrobial treatment. In fact, we found that variation in the spectra locations and shape was greater between different biofilm growth batches than between antimicrobial treatments. On the other hand, the impact on the diffusive behavior of specific peaks with antimicrobial treatment was significant. The quaternary ammonium compound was the most distinctive in that it completely eliminated all slow diffusion components of biomacromolecules in the biofilm. The nisin showed a slight shifting in the spectral weighting between 3.5 and 4.3 ppm, but otherwise no significant behavioral differences from the fresh biofilm. The glutaraldehyde increased the percentage of slow diffusing biomacromolecules at 3.4 ppm, presumably due to an increase in cross-linking and caused the slow diffusing molecules contributing to the spectral peak at 2.3 ppm to disappear over a 10 day period.
A more specific study of model and less complex biofilms and biomacromolecule gels will help to assign more specific functionality to the observations and suggest future applications for the technique in biofilm research.
Acknowledgments
J.A.H. acknowledges the support of NIH Grant Number P20 RR16455-04 from the INBRE-BRIN Program of the National Center for Research Resources. A.A.L. acknowledges CRDF, RSSF, Council on Grants of the President of the Russian Federation (MK-5135.2007.3), SB RAS (Integrational Grant 11), RAS (Grants 5.2.3., 5.1.1.), and RFBR (Grant 07-03-12147). S.L.C. acknowledges the support of an NSF ADVANCE Award 0340709 and an NSF CAREER Award 0642328. J.D.S. acknowledges support from an NSF CAREER Award 03480076. Author sequence determines contribution. Thank you A. Agostinho at the Center for Biofilm Engineering, MSU, for the SEM biofilm image.
References and Notes
- 1.Costerton JW, Lewandowski Z, Caldwell DE, Korber DR, Lappin-Scott HM. Microbial biofilms. Annu ReV Microbiol. 1995;49:711–745. doi: 10.1146/annurev.mi.49.100195.003431. [DOI] [PubMed] [Google Scholar]
- 2.Costerton JW, Stewart PS. Battling biofilms. Sci Am. 2001;285(1):1–9. doi: 10.1038/scientificamerican0701-74. [DOI] [PubMed] [Google Scholar]
- 3.Ross-Murphy SB, Shatwell KP. Polysaccharide strong and weak gels. Biorheology. 1993;30:217–227. doi: 10.3233/bir-1993-303-407. [DOI] [PubMed] [Google Scholar]
- 4.Sutherland IW. Biofilm exopolysaccharides: A strong and sticky framework. Microbiology. 2001;147:3–9. doi: 10.1099/00221287-147-1-3. [DOI] [PubMed] [Google Scholar]
- 5.Horkay F, Amis EJ. Biological and Synthetic Polymer Networks and Gels. Vol. 227. Wiley-VCH; Weinheim, Germany: 2005. p. 382. [Google Scholar]
- 6.Shaw T, Winston M, Rupp CJ, Klapper I, Stoodley P. Commonality of elastic relaxation times in biofilms. Phys ReV Lett. 2004;93(9):098102. doi: 10.1103/PhysRevLett.93.098102. [DOI] [PubMed] [Google Scholar]
- 7.Schuerks N, Wingender J, Flemming H-C, Mayer C. Monomer composition and sequence of alginates from Pseudomonas aeruginosa. Int J Biol Macromol. 2002;30:105–111. doi: 10.1016/s0141-8130(02)00002-8. [DOI] [PubMed] [Google Scholar]
- 8.Wloka M, Rehage H, Flemming H-C, Wingender J. Rheological properties of viscoelastic biofilm extracellular polymeric substances and comparison to the behavior of calcium alginate gels. Colloid Polym Sci. 2004;282:1067–1076. [Google Scholar]
- 9.Ross-Murphy SB. Physical gelation of biopolymers; ACS Symposium Series 489. American Chemical Society; Washington DC: 1992. pp. 204–216. [Google Scholar]
- 10.Higgs PG, Ball RC. Some ideas concerning the elasticity of biopolymer networks. Macromolecules. 1989;22:2432–2437. [Google Scholar]
- 11.Tanaka F, Edwards SF. Viscoelastic properties of physically cross-linked networks. Transient network theory. Macromolecules. 1992;25:1516–1523. [Google Scholar]
- 12.Towler BW, Rupp CJ, Cunningham AB, Stoodley P. Viscoelastic properties of a mixed culture biofilm from rheometer creep analysis. Biofouling. 2003;19(5):279–285. doi: 10.1080/0892701031000152470. [DOI] [PubMed] [Google Scholar]
- 13.Vogt M, Flemming H-C, Veeman WS. Diffusion in Pseudomonas aeruginosa biofilms: A pulsed field gradient NMR study. J Biotechnol. 2000;77:137–146. doi: 10.1016/s0168-1656(99)00213-8. [DOI] [PubMed] [Google Scholar]
- 14.Shraiman BI. Mechanical feedback as a possible regulator of tissue growth. Proc Natl Acad Sci U S A. 2005;102:3318–3323. doi: 10.1073/pnas.0404782102. [DOI] [PMC free article] [PubMed] [Google Scholar]
- 15.Callaghan PT. Pulsed field gradient nuclear magnetic resonance as a probe of liquid state molecular organization. Aust J Phys. 1984;37:359–387. [Google Scholar]
- 16.Stejskal EO, Tanner JE. Spin diffusion measurements: Spin echoes in the presence of a time-dependent field gradient. J Chem Phys. 1965;42:288. [Google Scholar]
- 17.Callaghan PT, Codd SL. Flow coherence in a bead pack observed using frequency domain-modulated gradient NMR. Phys Fluids. 2001;13:412–427. [Google Scholar]
- 18.Komlosh ME, Callaghan PT. Segmental motion of entangled random coil polymer studied by pulsed gradient spin echo NMR. J Chem Phys. 1998;109:10053–10067. [Google Scholar]
- 19.Codd SL, Manz B, Seymour JD, Callaghan PT. Taylor dispersion and molecular displacements in poiseuille flow. Phys ReV E. 1999;60(4):R3491–R3494. doi: 10.1103/physreve.60.r3491. [DOI] [PubMed] [Google Scholar]
- 20.Callaghan PT, Codd SL, Seymour JD. Spatial coherence phenomena arising from translational spin motion in gradient spin echo experiments. Concepts Magn Reson. 1999;11:181–202. [Google Scholar]
- 21.Stilbs P. Fourier transform pulsed-gradient spin-echo studies of molecular diffusion. Prog Nucl Magn Reson Spectrosc. 1987;19:1–45. [Google Scholar]
- 22.Characklis WG, Marshall KC. Biofilms. John Wiley and Sons; New York: 1990. [Google Scholar]
- 23.Beuling EE, van Dusschoten D, Lens P, van den Heuvel JC, van As H, Ottengraf PP. Characterization of the diffusive properties of biofilms using pulsed field gradient-nuclear magnetic resonance. Biotechnol Bioeng. 1998;60(3):283–291. doi: 10.1002/(sici)1097-0290(19981105)60:3<283::aid-bit3>3.0.co;2-d. [DOI] [PubMed] [Google Scholar]
- 24.Mayer C, Lattner D, Schurks N. 13C nuclear magnetic resonance studies on selectively labeled bacterial biofilms. J Ind Microbiol Biotechnol. 2001;26:62–69. doi: 10.1038/sj/jim/7000070. [DOI] [PubMed] [Google Scholar]
- 25.Stewart PS. A review of experimental measurements of effective diffusion permeabilities and effective diffusion coefficients in biofilms. Biotechnol Bioeng. 1998;59(3):261–272. doi: 10.1002/(sici)1097-0290(19980805)59:3<261::aid-bit1>3.0.co;2-9. [DOI] [PubMed] [Google Scholar]
- 26.Nivens DE, Ohman DE, Williams J, Franklin MJ. Role of alginate and alginate O-acetylation in the formation of Pseudomonas aeruginosa microcolonies and biofilms. J Bacteriol. 2001;183:1047–1057. doi: 10.1128/JB.183.3.1047-1057.2001. [DOI] [PMC free article] [PubMed] [Google Scholar]
- 27.Tielen P, Strathmann M, Jaeger KE, Flemming H-C, Wingender J. Alginate acetylation influences initial surface colonization by mucoid Pseudomonas aeruginosa. Microbiol Res. 2005;160(2):165–176. doi: 10.1016/j.micres.2004.11.003. [DOI] [PubMed] [Google Scholar]
- 28.Stoodley P, Dodds I, Boyle JD, Lappin-Scott HM. Influence of hydrodynamics and nutrients on biofilm structure. J Appl Microbiol. 1999;85:19S–28S. doi: 10.1111/j.1365-2672.1998.tb05279.x. [DOI] [PubMed] [Google Scholar]
- 29.Ferry JD. Viscoelastic Properties of Polymers. John Wiley & Sons; New York: 1980. [Google Scholar]
- 30.Callaghan PT. Principles of Nuclear Magnetic Resonance Microscopy. Oxford University Press; New York: 1991. [Google Scholar]
- 31.Doi M, Edwards SF. The Theory of Polymer Dynamics. Clarendon Press; Oxford: 1986. [Google Scholar]
- 32.Abragam A. Principles of Nuclear Magnetism. Oxford University Press; New York: 1983. [Google Scholar]