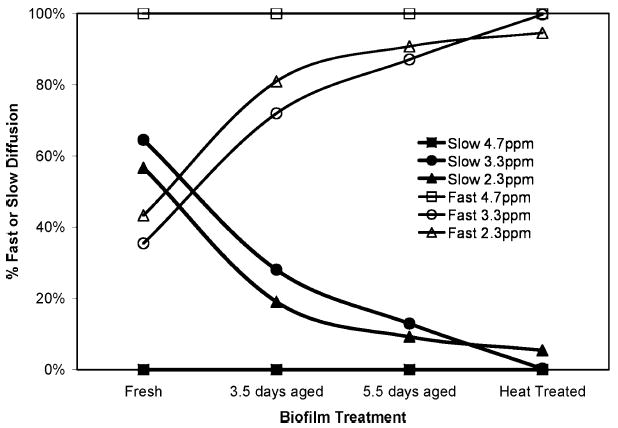
Figure 5.

Percent weighting between fast and slow diffusion regimes. The above graph shows the percentage weighting between signal in the fast diffusion regime (>1.0 × 10⁻¹⁰ m2 s−1) and the slow diffusion regime (<2.0 × 10⁻¹¹ m2 s−1) for each of three spectral peaks. As the biofilm ages, the percentage of fast diffusing molecules increases while the percentage of slow diffusion molecules decreases. This indicates the biofilm biomass is weakening. After heat treatment, almost 100% of the signal exhibits motion in the fast diffusive regime.
