Abstract
The dentate gyrus is one of the few brain regions that show proliferation of neuronal precursors postnatally and in adult life. Proliferation in the dentate gyrus has been shown to be influenced by exercise, stress and drugs such as antidepressants. Traditionally, proliferation studies rely on the time consuming and subjective manual count of labeled cells. Here we adapted the Metamorph software to automatically count cells labeled in the S phase in the developing dentate gyrus of mice. The validity of the computer-assisted method was established by showing an outcome similar to that obtained with the established manual counting procedure. In addition, by using a genetically modified mouse line with increased proliferation, the ability of the computer-assisted method to detect changes in proliferation was demonstrated.
Introduction
The hippocampus has long been known to be involved in spatial learning and memory and recent studies also identified its role in anxiety (Bannerman et al, 2004; Squire et al, 2004). The dentate gyrus is the only hippocampal subregion that develops postnatally and which shows neurogenesis in the adult brain (Kempermann et al, 2004; Kempermann et al, 1997). During early postnatal development, neuronal progenitors proliferate in the tertiary matrix located in the hilus and in the subgranular zone (SGZ) of the dentate gyrus (Altman and Das, 1965). Both the hilar and SGZ cells migrate outward to form the granule cell layer (GCL). The SGZ continues to give rise to new neurons during adult life (Kempermann et al, 2004). Interestingly, adult neurogenesis is increased by exercise (Cotman and Berchtold, 2002) and following chronic antidepressant treatment in mammals (Dulawa et al, 2004; Malberg et al, 2000). Stress on the other hand reduces neurogenesis (Duman, 2004; Malberg and Duman, 2003).
Proliferation in the dentate gyrus is assessed by counting cells pulse labeled by bromodeoxyuridine (BrdU) followed by the visualization of labeled cells using anti BrdU antibodies in histological sections. Traditionally cells are manually counted. However this procedure is labor intensive limiting the scope of studies. Manual counting is a daunting task especially when the number of immunopositive cells is relatively high in the area of interest such as in the developing dentate gyrus. Image analysis software with interactive definition of the region of interest and threshold are available and have been used to count cells in various biological systems (Cunnane et al, 1999; el-Salhy et al, 1997; Goedkoop et al, 2005; Markey et al, 2003; Taylor and Levenson, 2006; Went et al, 2006). Here we tested the Metamorph software and its cell counting module for counting S labeled nuclei in the developing dentate gyrus of mice in various experimental paradigms. The computer-assisted counting method is fast but still has the accuracy of the traditional manual counting method.
Materials and Methods
Animals
Four groups of animals were used in these studies: Wild-type (WT), serotonin (5-HT) 1A receptor (5-HT1AR) homozygote knockout (KO)(Parks et al, 1998), Ink4a homozygote KO (Kim and Sharpless, 2006) and 5-HT1AR/Ink4a double KO mice. These lines were originally used in a study that analyzed the effect of genetically inactivating either the 5-HT1AR, the Ink4a or both genes on cell proliferation (Gleason and Toth, unpublished). All mice were on the mixed (50–50%) Swiss Webster × FVB genetic background.
BrdU immunohistochemistry
Postnatal day (P) 7 pups received one subcutaneous 100 mg/kg injection of 10 mg/ml BrdU (Sigma, St. Louis, MO). We selected pups from at least 3 different litters because development during the first postnatal week in mice can show substantial individual variability within and between litters. Factors could include the time of delivery, size of the litter and postnatal maternal care. This variability may be reflected in the total number of proliferating cells as proliferation peaks during the first week of life and a slight delay or acceleration in proliferation in individuals could change the number of BrdU positive cells labeled on P7. Therefore, we tried to minimize the variability in individual development by excluding pups that deviated by more than 0.5g from the 4.5g average weight.
Three hours after the administration of BrdU mice were transcardially perfused under deep anesthesia with heparinized saline followed by 4 % paraformaldehyde (PFA) in 0.1 M phosphate buffer. Brains were dissected out, postfixed overnight in fresh 4% PFA, cryoprotected in 30% sucrose in 0.1 M phosphate buffer, and sectioned in the coronal plane at 40 µm on a freezing sliding microtome. Every fourth section throughout the hippocampus was processed for BrdU immunohistochemistry (Pham et al, 2005). Briefly, sections were mounted on slides and microwaved in preheated 0.1 M citrate buffer. Next, sections were incubated in 0.6% H2O2 in phosphate-buffered saline for twenty minutes, permeabilized in 0.1 M Tris buffer containing 0.1% trypsin with 0.1% CaCl2 and finally treated with 2 N HCl in phosphate-buffered saline. Then, sections were blocked with 3% normal horse serum and 0.3% Triton X-100 and incubated at 4°C with mouse monoclonal anti-BrdU (1:200; Novocastra, Newcastle upon Tyne, UK) overnight. The next day, sections were incubated at room temperature with the secondary antibody (biotinylated horse anti-mouse; Vector Laboratories, Burlingame, CA) for one hour, incubated at room temperature with an avidin-biotin complex (Vector Laboratories) for one hour, and then visualized with 3, 3’-diaminobenzidine (Sigma, St. Louis, MO). Finally, slides were Nissl-stained with cresyl violet, dehydrated with an ethanol series, cleared in xylene, and coverslipped using Cytoseal mounting medium.
Computer-assisted counting
Sections were derived from a total of 16 mice corresponding to 4 different genotypes (see above). In some experiments forty four sections (2–3 sections per animal) were used by randomly assigning them into three groups of sixteen, sixteen, and twelve sections. These series were counted on separate days. In other experiments, BrdU positive cell number was analyzed by the genotype. In this case, the total number of positive cells per animals was measured by counting cells in every 4th section and then multiplying the result by four.
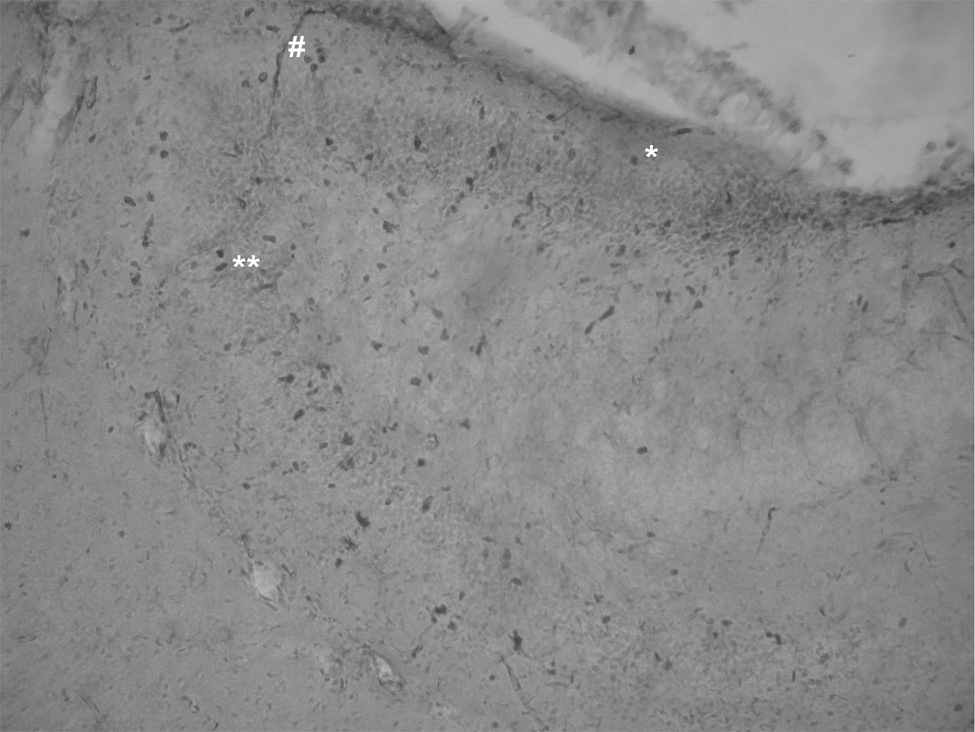
Images were captured by a blinded observer (at 10× magnification) by using a Nikon TE200 inverted fluorescence microscope with an attached Nikon Coolpix 995 digital camera. The ideal aperture was determined to be 5.0 mm, and the best exposure time was determined to be 1/30 of a second. These settings were fixed and maintained throughout the duration of the image-taking process. Since the size of the dentate gyrus increases from the dorsal to ventral axis, some of the ventral sections required multiple images to be taken. These images were merged using Adobe Photoshop. Images were imported into the MetaMorph software program (Molecular Devices, Downingtown, PA). Since the SGZ in P7 mice is not yet completely restricted to the innermost 1–2 cell layers of the GCL, BrdU positive cells were counted in the entire GCL. The GCL was marked by a line outlining this area. Then the threshold tool was used to isolate immunopositive cells. The average area for single cells was 50 pixels and we limited the counting to objects larger than 20 pixels. An upper limit was imposed as well; an object was not included in the cell count if its standard area count was more than seven cells, or 350 pixels. Although peroxidase was used to reduce nonspecific staining, blood vessels occasionally showed staining (Figure 1). However, these objects were larger than 350 pixels, the upper limit of our counting, and were automatically excluded. Once the images were thresholded the number and size of positive objects and the corresponding cell numbers (size of the cluster in pixel/50 pixel) were automatically registered and logged to an Excel spreadsheet.
Figure 1.
An example of hippocampal sections used for the automatic counting of BrdU positive cells in the dentate gyrus. Cell bodies in the GCL are counterstained by cresyl violet. Immunopositive cells are brown (black-dark grey in B@W). The symbols * and ** represent a single and two attached cells, respectively. Although the sections are treated by peroxidase, there are still some blood vessels stained nonspecifically (symbol #). Because their large size (>350 pixels), blood vessels are automatically excluded from the counting.
Manual counting with stereological analysis
BrdU-labeled cells were manually counted in each section using a Nikon microscope with the StereoInvestigator software (Microbrightfield Inc., Colchester, VT) by a blinded observer as described previously (West and Gundersen, 1990) but instead of using the “fractionator” function, all cells were counted in the GCL. A 40x objective lens was used for all counting.
Results
While Metamorph, a software with computer-assisted quantification capabilities, has been used in numerous immunological studies (Schacker et al, 2002; Zhang et al, 1998)(see Introduction), its potential as a program for counting S phase cells in the brain has not been explored. First, we tested if the computer-assisted counting of BrdU positive cells in the developing dentate gyrus of mice has accuracy comparable to that of the manual counting technique (cross-method correlation and inter-trial accuracy).
Cross-Method Correlation
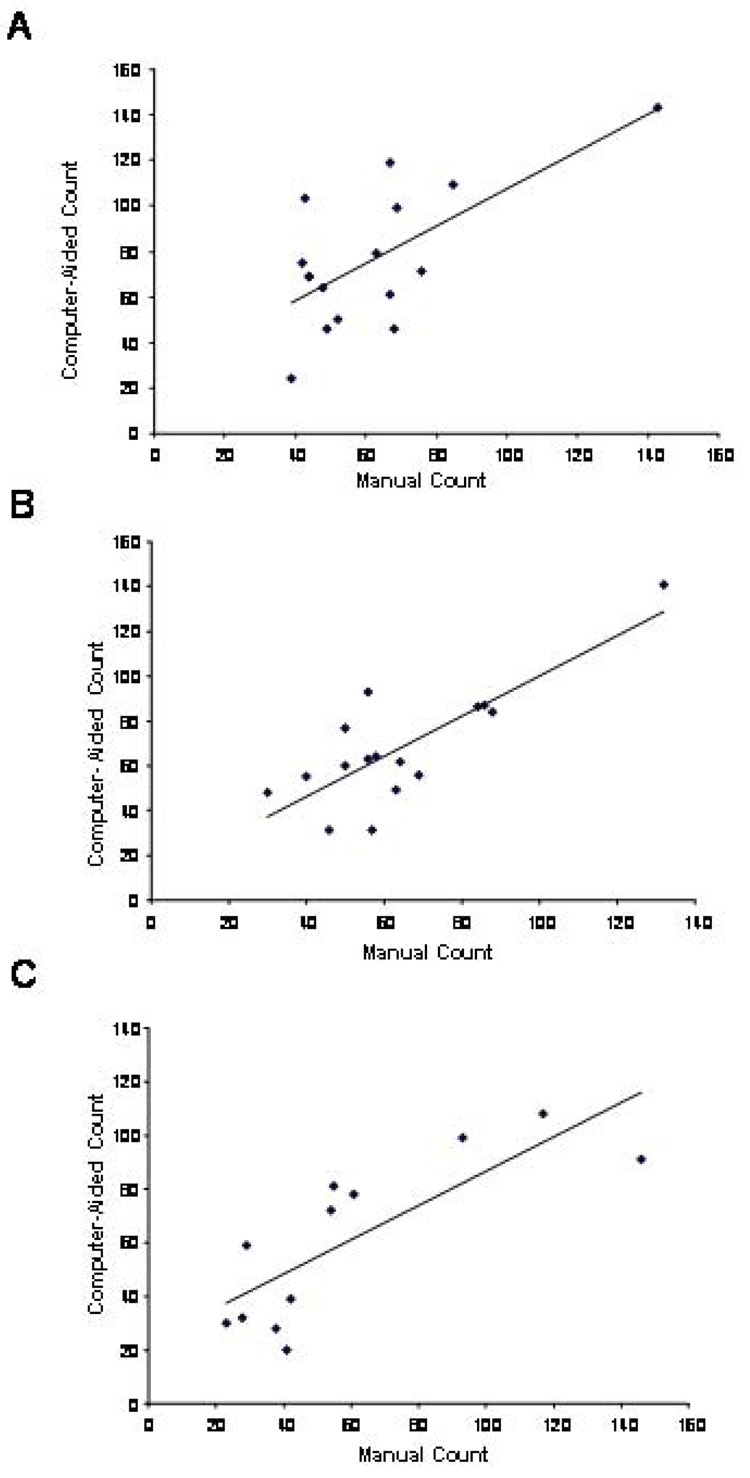
Forty four dentate gyrus sections from P7 mice (Figure 1), previously counted manually, were randomly assigned to three groups of sixteen, sixteen, and twelve sections, each (see Materials and Methods). The smaller group size was chosen to test the computer-assisted method with a group size more realistic in experimental settings. Metamorph was used to determine the number of cells in the GCL (ANOVA showed no significant difference between the three groups; F2,41=0.946, P=0.40). Scatter plot analysis of the manual and computer-aided counts showed a significant correlation in all three groups (P=0.0042, 0.00019, and 0.0019 for groups 1–3, respectively, Fig. 2A–C). Furthermore, the standard deviation and error of all measurements (groups 1–3) by the manual and computer-assisted techniques were similar (62.61+4.36 and 68.55+4.41; mean+SD, respectively) indicating that variability in the two techniques is comparable. These data validate the computer-assisted counting as comparable to the manual counting method.
Figure 2.
Comparison of manual counts vs. computer-aided counts in the GCL in three randomly assigned groups of sections of P7 hippocampi: The scatter plots of the three groups are shown in A–C. The coefficients of correlation (r) were 0.674, 0.802, and 0.797 for groups 1, 2 and 3 respectively. The P values were 0.0042, 0.00019 and 0.0019 for groups 1, 2 and 3 respectively. The r and P values for all data (groups 1–3 combined) were 0.729 and <0.000001, respectively).
Inter-trial accuracy of the computer-assisted counting
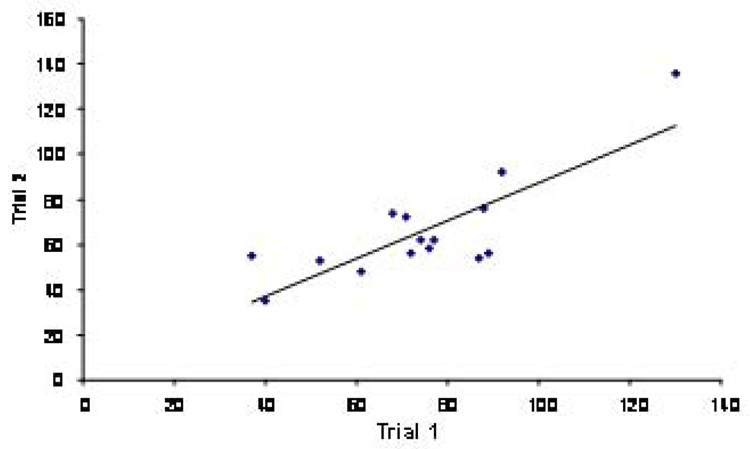
Seventeen images were randomly selected and the number of BrdU positive cells in the GCL was counted in two separate trials by the computer-aided method. Scatter plot analysis showed a high level of correlation between the data collected in two different days (P=0.00022; Fig. 3).
Figure 3.
High inter-trial accuracy in the computer-assisted counting method (r=0.8134; P=0.00022).
Detection of genotype-dependent differences in cell number by the computer-assisted counting method
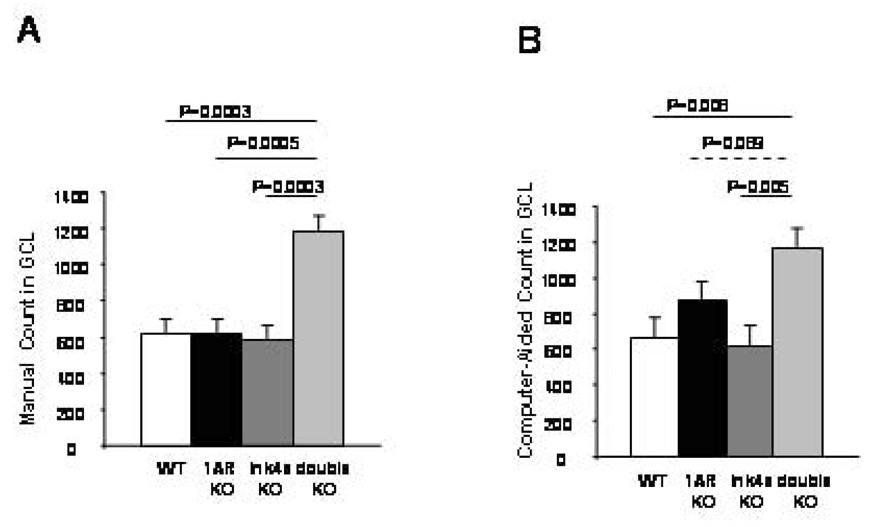
The computer-assisted method was further tested by using genetically manipulated mouse lines. Since genotype differences were studied in these experiments, the total number of BrdU positive cells per animal (rather than the number of cells per section) was compared in the GCL (see Materials and Methods). ANOVA of the manual counts of the four groups showed a genotype effect (ANOVA: F3,12=11.76, P=0.0007, N=4 per group). LSD posthoc analysis showed that 5-HT1AR/Ink4a double KO mice had more BrdU positive cells than WT, 5-HT1AR KO and Ink4a KO mice (Fig. 4A). Then, the same sections were counted with the computer-assisted techniques which yielded a similar result (ANOVA F3,12=4. 92, P=0.018, N=4 per group; N=4 per group) with significant differences between the 5-HT1AR/Ink4a double KO mice and WT and Ink4a KO mice (Fig. 4B). The difference between the double KO and 5-HT1AR KO mice was only a trend indicating that the computer assisted method may not have the sensitivity of the manual counting technique to detect genotype-dependent differences. Nevertheless, the computer assisted method correctly indicated the overall difference in the sample and the differences between groups.
Figure 4.
Similar genotype-dependent differences in BrdU positive cell number in the GCL as counted manually (A) and by the computer-aided method (B).
Discussion
Traditionally, BrdU pulse-labeled neuronal precursors are counted manually. Since this procedure is time consuming, it is important to develop and validate techniques which maintain a similar accuracy as manual quantification while significantly reducing the amount of time involved. Here we show that MetaMorph can be used to count BrdU positive cells in a time-efficient way. Indeed, at least six 4–5h sessions are necessary to complete a stereological analysis that involves two groups, each consisting of 4–6 animals, each sampled by 3 sections through the hippocampus (approximately 45 min are required for a single section). The same series can be analyzed in one 4–5h session as image acquisition takes only a few minutes each and highlighting of the area of interest and threshold setting, once the images are uploaded to the MetaMorph software, take another few minutes. The difference in time between the two methods can be even bigger because normally 4–6 sections are analyzed per animal and because in some experiments more than 4–6 animals/group are used.
The computer assisted method is particularly useful when a large number of cells are present such as during development because the computer-aided technique allows obtaining total cell counts directly circumventing the need to extrapolate from sample areas commonly used in manual counting (i.e. with the optical fractionator function of StereoInvestigator). The computer-aided quantification method is less prone to subjectivity because it selects and highlights cells automatically based on red, green, and blue color intensities and size. Our data showed a good correlation between the manual and computer-assisted counting methods and was able to detect genotype dependent differences between groups of animals in BrdU positive cell number.
Although the computer assisted method is significantly faster than the manual technique, it has limitations. First, although typical sterology utilizes a top and bottom guard zone of the section to avoid double counting of cells present on two adjacent sections (West and Gundersen, 1990), this is difficult to implement for automated counting. Instead, we limited the size of objects to be counted to at least 20 pixels while a typical nucleus is 50 pixels. This resulted in registering cells with nuclei of at least 20 pixels but excluded cells with less than 20 pixels on both surfaces resulting in a combined effect of an overestimation of cell numbers. Considering the thickness of the slides and the diameter of cell nuclei and assuming an even distribution of cells through the rostro-caudal axis within individual sections, the overcounting was estimated to be 7.6% by the computer assisted method. However this bias does not invalidate our results because the main question in our experiments, like in most experimental designs, was the relative difference in cell number between the experimental and control groups rather than the absolute number of cells in individual groups. If absolute count is required, the computer assisted count could be normalized (in our experiments by multiplying the automated count by a factor of 0.93).
Second, the cell cluster size has to be adjusted according to the experimental conditions when using the automated method. Since a single pulse of BrdU labeling was used in our experiments, we did not encounter the problem of cell clusters bigger than seven cells (Figure 1). In fact the size of the biggest clusters was usually 3–4 cells in our experiments because multiple cell divisions of a single labeled progenitor will dilute the BrdU label in daughter cells below the detection limit. However, if multiple BrdU injections are used, especially if these injections extend over several cell divisions, larger than seven cell clusters may be formed. In this case either the labeling should be limited to a shorter period or the upper limit of cluster size should be increased. Despite of these limitations, we demonstrate here that the computer-aided technique, if conditions are selected correctly, can significantly expedite quantification of BrdU positive cells in neuronal tissue.
Acknowledgements
We thank Dr. Ji-eun Oh and Georgia Gleason for their help. This research was supported by 5R01MH058669 to MT.
Footnotes
Publisher's Disclaimer: This is a PDF file of an unedited manuscript that has been accepted for publication. As a service to our customers we are providing this early version of the manuscript. The manuscript will undergo copyediting, typesetting, and review of the resulting proof before it is published in its final citable form. Please note that during the production process errors may be discovered which could affect the content, and all legal disclaimers that apply to the journal pertain.
References
- Altman J, Das GD. Autoradiographic and histological evidence of postnatal hippocampal neurogenesis in rats. J Comp Neurol. 1965;124:319–335. doi: 10.1002/cne.901240303. [DOI] [PubMed] [Google Scholar]
- Bannerman DM, Rawlins JN, McHugh SB, Deacon RM, Yee BK, Bast T, Zhang WN, Pothuizen HH, Feldon J. Regional dissociations within the hippocampus--memory and anxiety. Neurosci Biobehav Rev. 2004;28:273–283. doi: 10.1016/j.neubiorev.2004.03.004. [DOI] [PubMed] [Google Scholar]
- Cotman CW, Berchtold NC. Exercise: a behavioral intervention to enhance brain health and plasticity. Trends Neurosci. 2002;25:295–301. doi: 10.1016/s0166-2236(02)02143-4. [DOI] [PubMed] [Google Scholar]
- Cunnane G, Bjork L, Ulfgren AK, Lindblad S, FitzGerald O, Bresnihan B, Andersson U. Quantitative analysis of synovial membrane inflammation: a comparison between automated and conventional microscopic measurements. Ann Rheum Dis. 1999;58:493–499. doi: 10.1136/ard.58.8.493. [DOI] [PMC free article] [PubMed] [Google Scholar]
- Dulawa SC, Holick KA, Gundersen B, Hen R. Effects of chronic fluoxetine in animal models of anxiety and depression. Neuropsychopharmacology. 2004;29:1321–1330. doi: 10.1038/sj.npp.1300433. [DOI] [PubMed] [Google Scholar]
- Duman RS. Depression: a case of neuronal life and death? Biol Psychiatry. 2004;56:140–145. doi: 10.1016/j.biopsych.2004.02.033. [DOI] [PubMed] [Google Scholar]
- el-Salhy M, Sandstrom O, Nasstrom E, Mustajbasic M, Zachrisson S. Application of computer image analysis in endocrine cell quantification. Histochem J. 1997;29:249–256. doi: 10.1023/a:1026458027425. [DOI] [PubMed] [Google Scholar]
- Goedkoop AY, de Rie MA, Teunissen MB, Picavet DI, van der Hall PO, Bos JD, Tak PP, Kraan MC. Digital image analysis for the evaluation of the inflammatory infiltrate in psoriasis. Arch Dermatol Res. 2005;297:51–59. doi: 10.1007/s00403-005-0578-4. [DOI] [PubMed] [Google Scholar]
- Kempermann G, Jessberger S, Steiner B, Kronenberg G. Milestones of neuronal development in the adult hippocampus. Trends Neurosci. 2004;27:447–452. doi: 10.1016/j.tins.2004.05.013. [DOI] [PubMed] [Google Scholar]
- Kempermann G, Kuhn HG, Gage FH. More hippocampal neurons in adult mice living in an enriched environment. Nature. 1997;386:493–495. doi: 10.1038/386493a0. [DOI] [PubMed] [Google Scholar]
- Kim WY, Sharpless NE. The regulation of INK4/ARF in cancer and aging. Cell. 2006;127:265–275. doi: 10.1016/j.cell.2006.10.003. [DOI] [PubMed] [Google Scholar]
- Malberg JE, Duman RS. Cell proliferation in adult hippocampus is decreased by inescapable stress: reversal by fluoxetine treatment. Neuropsychopharmacology. 2003;28:1562–1571. doi: 10.1038/sj.npp.1300234. [DOI] [PubMed] [Google Scholar]
- Malberg JE, Eisch AJ, Nestler EJ, Duman RS. Chronic antidepressant treatment increases neurogenesis in adult rat hippocampus. J Neurosci. 2000;20:9104–9110. doi: 10.1523/JNEUROSCI.20-24-09104.2000. [DOI] [PMC free article] [PubMed] [Google Scholar]
- Markey GM, Kettle P, Morris TC, Connolly N, Foster H. Quantitation of monoclonal plasma cells in bone marrow biopsies in plasma cell dyscrasia. Anal Cell Pathol. 2003;25:167–171. doi: 10.1155/2003/821978. [DOI] [PMC free article] [PubMed] [Google Scholar]
- Parks CL, Robinson PS, Sibille E, Shenk T, Toth M. Increased anxiety of mice lacking the serotonin1A receptor. Proc Natl Acad Sci U S A. 1998;95:10734–10739. doi: 10.1073/pnas.95.18.10734. [DOI] [PMC free article] [PubMed] [Google Scholar]
- Pham K, McEwen BS, Ledoux JE, Nader K. Fear learning transiently impairs hippocampal cell proliferation. Neuroscience. 2005;130:17–24. doi: 10.1016/j.neuroscience.2004.09.015. [DOI] [PubMed] [Google Scholar]
- Schacker TW, Nguyen PL, Beilman GJ, Wolinsky S, Larson M, Reilly C, Haase AT. Collagen deposition in HIV-1 infected lymphatic tissues and T cell homeostasis. J Clin Invest. 2002;110:1133–1139. doi: 10.1172/JCI16413. [DOI] [PMC free article] [PubMed] [Google Scholar]
- Squire LR, Stark CE, Clark RE. The medial temporal lobe. Annu Rev Neurosci. 2004;27:279–306. doi: 10.1146/annurev.neuro.27.070203.144130. [DOI] [PubMed] [Google Scholar]
- Taylor CR, Levenson RM. Quantification of immunohistochemistry--issues concerning methods, utility and semiquantitative assessment II. Histopathology. 2006;49:411–424. doi: 10.1111/j.1365-2559.2006.02513.x. [DOI] [PubMed] [Google Scholar]
- Went P, Mayer S, Oberholzer M, Dirnhofer S. Plasma cell quantification in bone marrow by computer-assisted image analysis. Histol Histopathol. 2006;21:951–956. doi: 10.14670/HH-21.951. [DOI] [PubMed] [Google Scholar]
- West MJ, Gundersen HJ. Unbiased stereological estimation of the number of neurons in the human hippocampus. J Comp Neurol. 1990;296:1–22. doi: 10.1002/cne.902960102. [DOI] [PubMed] [Google Scholar]
- Zhang ZQ, Notermans DW, Sedgewick G, Cavert W, Wietgrefe S, Zupancic M, Gebhard K, Henry K, Boies L, Chen Z, Jenkins M, Mills R, McDade H, Goodwin C, Schuwirth CM, Danner SA, Haase AT. Kinetics of CD4+ T cell repopulation of lymphoid tissues after treatment of HIV-1 infection. Proc Natl Acad Sci U S A. 1998;95:1154–1159. doi: 10.1073/pnas.95.3.1154. [DOI] [PMC free article] [PubMed] [Google Scholar]


