Abstract
Neurons in the inferior colliculus (IC), one of the major integrative centers of the auditory system, process acoustic information converging from almost all nuclei of the auditory brain stem. During this integration, excitatory and inhibitory inputs arrive to auditory neurons at different time delays. Result of this integration determines timing of IC neuron firing. In the mammalian IC, the range of the first spike latencies is very large (5 – 50 ms). At present, a contribution of excitatory and inhibitory inputs in controlling neurons’ firing in the IC is still under debate. In the present study we assess the role of excitation and inhibition in determining first spike response latency in the IC. Postsynaptic responses were recorded to pure tones presented at neuron’s characteristic frequency or to downward FM sweeps in awake bats. There are three main results emerging from the present study: (1) the most common response pattern in the IC is hyperpolarization followed by depolarization followed by hyperpolarization (2) latencies of depolarizing or hyperpolarizing responses to tonal stimuli are short (3 to 7 ms) whereas the first spike latencies may vary to a great extent (4 to 26 ms) from one neuron to another (3) high threshold hyperpolarization preceded long latency spikes in IC neurons exhibiting paradoxical latency shift (PLS). Our data also show that the onset hyperpolarizing potentials in the IC have very small jitter (<100 μs) across repeated stimulus presentations. The results of this study suggest that inhibition, arriving earlier than excitation, may play a role as a mechanism for delaying the first spike latency in IC neurons.
Keywords: intracellular recording, midbrain, inhibition, excitation, paradoxical latency shift
INTRODUCTION
Many auditory functions depend critically on a precise timing of excitatory and inhibitory neural inputs (reviewed by Covey and Casseday, 1999; Oertel, 1999). Temporal integration of these inputs is critical for creating response selectivity of auditory neurons to different features of sound stimuli (Klug et al., 2002; Pollak et al., 2003; Xie et al., 2005; Voytenko and Galazyuk, 2007). During this integration excitatory and inhibitory inputs arrive to auditory neurons at different time delays. In the mammalian inferior colliculus (IC), one of the major integrative centers of the auditory system, the range of first spike latencies of neurons is very large (5 – 50 ms) (Kitzes et al., 1978; Harrison and Palmer, 1984; Park and Pollak, 1993a; Klug et al., 2000; Fuzessery et al., 2003). This range is broader than observed in lower auditory brainstem nuclei (Halpea et al., 1994; Klug et al., 2000). It is likely that some mechanisms internal to the IC are involved, because very long latencies can not be predicted from a simple systematic lengthening of latency via synaptic delays at successive ascending auditory nuclei (Haplea et al., 1994, review Covey and Casseday, 1999).
Several mechanisms may contribute to long response latencies in the IC. One mechanism utilizes NMDA receptors (NMDARs). They have been shown to play a role in temporal integration and alter timing of neural discharges (Binns, 1999; Kelly and Zhang, 2002; Blitz and Regehr, 2003). They mediate later discharges in auditory neurons following initial responses mediated by AMPA receptors. Furthermore, recently NMDARs have been shown to contribute to both fast onset as well as later responses in IC neurons acting independently of AMPA receptors (Sanchez et al., 2007). Another mechanism that may delay the first spike latency in the IC is inhibition. A few studies have suggested that longer latencies are created in part by fast inhibitory inputs that precede excitation (Park and Pollak, 1993a; Casseday and Covey, 1995; Covey et al., 1996). In the mustached bat IC, blocking inhibition can reduce response latencies up to 20 ms (Park and Pollak, 1993a). It has been suggested that these large changes in part are due to conversion of response pattern in IC neurons from “off” to “on” discharges. In contrast, much more modest changes in response latencies (<4 ms) have been reported in similar studies (Johnson 1993; Casseday and Covey, 1995; Lu et al., 1997; Fuzessery et al., 2003). Potential involvement of inhibition in controlling first spike latency in the IC is still under debate.
Inhibition has been also suggested to play a role in another response latency-related phenomenon, the paradoxical latency shift (PLS). The latency of auditory neurons typically shortens with increasing sound level (Aitkin et al., 1970; Brugge et al., 1969; Goldberg and Brownell, 1973; Hind et al., 1963; Kitzes et al., 1978). A small percentage of neurons, however, show a level-dependent increase in response latency, or PLS. This phenomenon has been described for many species including echolocating bats (Sullivan, 1982; Berkowitz and Suga, 1989: Klug et al., 2000; Galazyuk and Feng, 2001; Galazyuk et al., 2005; Wang et al., 2007), frogs (Galazyuk et al., 2005), and gerbils (Klug et al., 2000). It has been suggested that inhibition may play a role in this phenomenon (Berkowitz and Suga., 1989). Later studies utilizing extracellular recording coupled with iontophoretic drug injection confirmed that GABAergic inhibition contributes to PLS in the IC (Klug et al., 2000; Galazyuk and Feng, 2001). However, whether membrane hyperpolarization is always preceded the delayed spikes in PLS neurons has not been directly validated.
A goal of the present study was to examine the relationship between membrane postsynaptic potentials and spike timing. In awake bats, we recorded intracellular responses of IC neurons to pure tones presented at neuron’s characteristic frequency or to downward FM sweeps. We present evidence that majority of IC neurons respond to sound stimuli with hyperpolarization-depolarization(spike)- hyperpolarization response pattern. Latencies of onset depolarizations or hyperpolarizations in IC neurons in response to pure tones are short, whereas their first spike latencies may vary considerably from one neuron to another. Neurons exhibiting long latency discharges always show an onset hyperpolarization in their responses.
METHODS
Experimental preparation
Experimental subjects comprised 36 big brown bats, Eptesicus fuscus. For surgery, the animal was anesthetized via isoflurane inhalation (1.5 - 2.0%, isoflurane administered by a precision vaporizer). After incision of the skin and clearing of the tissues above the skull, a small metal rod was glued to the skull using glass ionomer cement (3M ESPE, Germany). Following the surgery, animals were allowed to recover for 2-3 days in individual holding cages. Procedures used in this study were approved by the Institutional Animal Care and Use Committee at the Northeastern Ohio Universities College of Medicine.
Recordings were obtained from awake bats. Two days after surgery the animal was trained to stay inside a small plastic tube. For this purpose we held the bat by hand and directed its head into the tube opening. As a rule, the animal crawled inside the tube by themselves and stayed there. Usually, after one training session the animal would stay in the tube for hours without movement. During the recording session the animal was placed inside the tube and moved into a single walled sound attenuating chamber (Industrial Acoustics Company, Inc). The metal rod on the bat’s head was then secured to a small holder for restraining the animal’s head atraumatically, leaving the ears unobstructed for free-field acoustic stimulation. A small hole (~ 50 μm) was made in the skull overlying the IC, through which a recording electrode was inserted to reach the IC. Throughout the recording session, the animal was offered drinking water periodically and monitored for signs of discomfort. After a recording session of 6- 8 hours, the exposed skull was covered with sterile bone wax, and the animal was returned to its holding cage. Such experiments proceeded every 2-3 days for a maximum of 2 weeks. No sedative drugs were used during recording sessions. If the animal showed any sighs of discomfort the recording session was terminated and the bat was returned to its cage.
Acoustic Stimulation
Acoustic stimuli, comprising linear downward FM sweeps and pure tones were delivered to the bat via a free field ultrasonic loudspeaker (Ultra Sound Advice US-LS) located 30 cm in front of the bat. The majority of IC neurons were studied in response to FM sweep. FM stimuli were swept from 80 kHz to 20 kHz in 4 ms (including 0.25 ms rise/fall time). Pure tones presented at neuron’s characteristic frequency (CF) were used for a limited number of IC neurons (25 cells). Pure tones of 4 ms duration (including 0.25 ms rise/fall time) were presented at neuron’s CF. CF tones and FM sweeps were presented at a wide range of sound levels, from 0 to 80 dB SPL. The outputs of the loudspeaker were measured with a 1/4-inch microphone (Brüel and Kjaer 4135) and found to be flat ±6 dB between 20 and 80 kHz, the frequency range used in the experiments. The parameters of the acoustic stimuli were controlled by D/A hardware and software from Tucker-Davis Technologies (System III) with a sampling rate of 200 kHz. Stimuli were delivered at a rate of 4 pulses per second. The entire protocol was repeated as many times as possible while the neuron showed a stable membrane resting potential (fluctuations of the baseline do not exceeded range of 4 mV). Only neurons that were tested at least three times with the entire protocol were included in our data analysis.
Recording procedure
Microelectrodes were made from 1.2 mm diameter quartz pipettes (Sutter Instruments, Novato, CA) filled with 3 M potassium acetate. Micropipettes, with impedance between 50-120 MΩ were pulled on a micropipette puller (P2000, Sutter Instruments). The electrode was positioned above the IC by a digital micromanipulator (MP-285, Sutter Instruments) and lowered to the dorsal brain surface. The relative position of each electrode was monitored from the readouts of digital micrometers using a common reference on the skull. Vertical advancement of the electrode was made by a precision microdrive (KOPF, Model 660) in 2 – 3 μm steps from outside the sound attenuating chamber. After placement of the electrode on the surface of the IC using a surgical microscope (Leica MZ9.5), the exposure was filled with 4% agar.
Intracellular responses of IC neurons were amplified through a single channel amplifier (CYGNUS Technology Inc., model IR183A) and monitored on a digital oscilloscope (DL1640, YOKOGAWA). Intracellular waveforms from IR183A and sound stimuli from Tucker Davis system were digitized and then stored on a computer hard drive using EPC-10 digital interface and PULSE software from HEKA at a bandwidth of 100 kHz. During cell search small (5-100 nA) current pulses of 100 ms duration were delivered through the microelectrode. Amplitude of these pulses allowed us to monitor impedance changes in the recording electrode. Such changes were used to determine whether the recording electrode was approaching an IC neuron. A sudden, negative DC shift and the presence of synaptic potentials indicated an intracellular impalement, which was often verified by passing positive current to evoke action potentials. Stable intracellular impalements were signaled by a prolonged (> 3 min), stable drop (>40 mV) in the DC level. Intracellular recordings typically lasted 3 – 4 min (maximum 50 min). During intracellular recording cell membrane resting potential usually fluctuated not more than 4 mV. Successful intracellular recording was always accompanied by the presence of postsynaptic potentials and by large action potentials (> 30 mV). A sudden decrease in membrane resting potential was typical just before a recorded neuron was lost. Intracellular recordings were performed for IC cells located at depths of 200 μm to 1500 μm, predominantly from cells in the central nucleus of the IC. Different angles of electrode penetrations were used in different experiments for the same animal to avoid local damage of the IC. Therefore, recording depth indicated for neurons presented in this manuscript does not give an exact location of a recorded neuron in the IC along the dorsoventral axis.
Data analysis
During intracellular recording, we often observed response variability from one stimulus presentation to another for a neuron. Therefore responses were analyzed on the basis of an algebraic average of 3 to 4 traces recorded for a given stimulus. A baseline value was first calculated by determining the mean value for all samples of each waveform for a time window of at least 200 ms (sampling rate = 10 microseconds). Since spikes and/or large de-/hyperpolarizations could alter the mean value we eliminated all values that exceeded one standard deviation and a new baseline mean value was calculated. The depolarizations or hyperpolarizations were defined as fluctuations of membrane potentials if they exceeded the baseline by two standard deviations (95% confidence limits) and occurred within a 50 ms time window after stimulus on-set. Latencies of depolarizing or hyperpolarizing potentials in responses of IC neurons to sound stimuli were measured from stimulus onset to the point when depolarizations or hyperpolarizations cross the lines defining the confidence limit.
Off-line data analysis and statistical analysis were made using custom software written by Olga Galazyuk.
RESULTS
General postsynaptic response properties of IC neurons
Intracellular potentials of 96 IC neurons were studied in response to downward FM sweeps (80-20 kHz, 4 ms duration). Stimuli were presented at a wide range of sound levels (0 to 80 dB SPL with 4 dB increment). Unfortunately, recordings from the majority of IC neurons lasted not more than a few minutes. Therefore, this limitation did not permit us to manipulate the neuron’s membrane potential during recording via intracellular current injections. Such technique would be useful in evaluating basic parameters of excitatory and inhibitory components of neuronal responses independently.
Responses of the majority of recorded IC neurons (77%, 74/96) to the FM sweep began with a hyperpolarization. The other IC neurons (15% 14/96) showed a depolarization in the initial component of their responses. Later response components of these neurons could be either a depolarization(spike) (12 cells) or hyperpolarization (2 cells). The response patterns of the remaining (8% 8/96) neurons could not be classified according to either of the two categories described above. Onset depolarizations or hyperpolarizations of these neurons could change substantially with sound level and even when the same sound stimulus was presented multiple times.
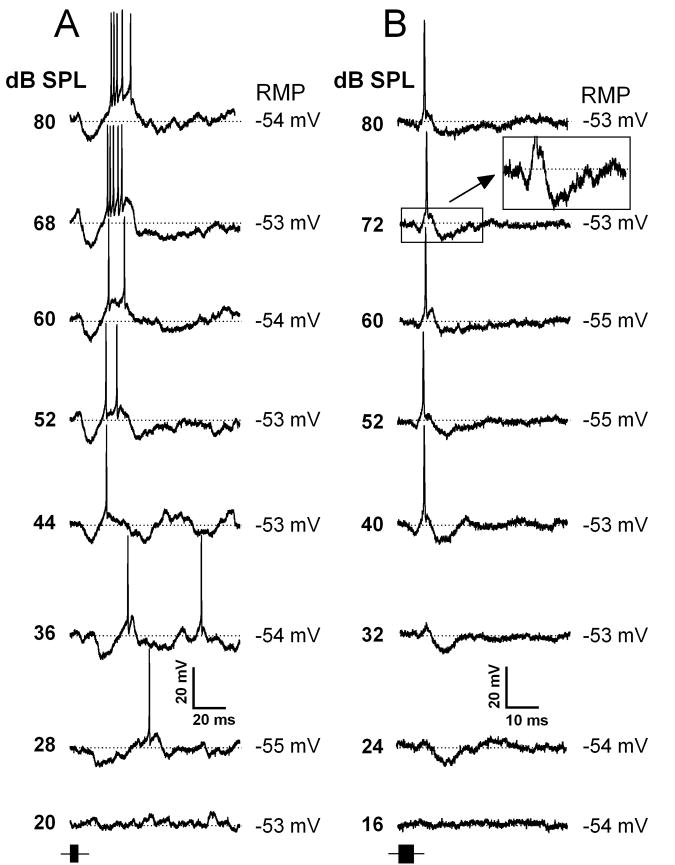
A large population of IC neurons exhibiting onset hyperpolarization (84%, 62/74) showed a typical response pattern where an onset hyperpolarization followed subsequently by depolarization and hyperpolarization (Fig.1). This response pattern was evident at suprathreshold sound levels. At sound levels that were subthreshold for spikes, however, some of these neurons (35%, 22/62) responded with hyperpolarization only. Thus, their threshold for inhibition was lower than the threshold for spike discharge. At higher sound levels these neurons showed first signs of depolarization in the middle of a long hyperpolarization or sometimes closer to the beginning of the hyperpolarization (Fig. 1 A and B, respectively). Further increase in sound level led to higher-amplitude depolarization which subsequently became supratheshold for spikes.
Figure 1.
Representative intracellular recordings from two IC neurons with the most common response pattern (hyperpolarization-depolarization(spike)-hyperpolarization) elicited by a 80 kHz to 20 kHz FM sweep. A, Intracellular responses of an IC neuron exhibiting a depolarization in between hyperpolarizations to FM sweeps presented at different sound levels as indicated. B, Intracellular responses of an IC neuron with a similar response pattern to the neuron shown in A, but exhibiting a depolarization close to the onset of the hyperpolarization. Inset shows an expanded part of 72 dB trace (indicated by a rectangular). The time course of the FM sweep stimulus is shown by a black horizontal bar at the lower left of each column (same time scale as intracellular traces). Time and amplitude scales are shown at the bottom of each column. Horizontal dotted lines indicate the resting membrane potential (shown on the right of each trace). The cells shown in A and B were recorded at depth of 390 μm and 1100 μm, respectively.
Intracellular recordings of two representative neurons that displayed the typical response pattern are shown in Figure 1. The neuron shown in Figure 1A exhibited a small hyperpolarization in response to a FM sweep presented at 28 dB SPL. At 36 dB SPL depolarization reached the threshold level for action potentials, and this neuron showed the hyperpolarization-depolarization-spike-hyperpolarization response function. Further increase in sound level produced little change in the neuron’s response pattern, which remained hyperpolarization-depolarization-spike-hyperpolarization over the 40 dB range. Similarly, the neuron shown in Figure 1B also exhibited a hyperpolarization to a low sound level (24 dB SPL). At higher sound levels (32 to 80 dB SPL), this neuron showed depolarization during the rising phase of hyperpolarization. At 40 dB SPL, this depolarization reached spike threshold. Further increase in sound level from 40 to 80 dB SPL did not change the neuron’s response pattern.
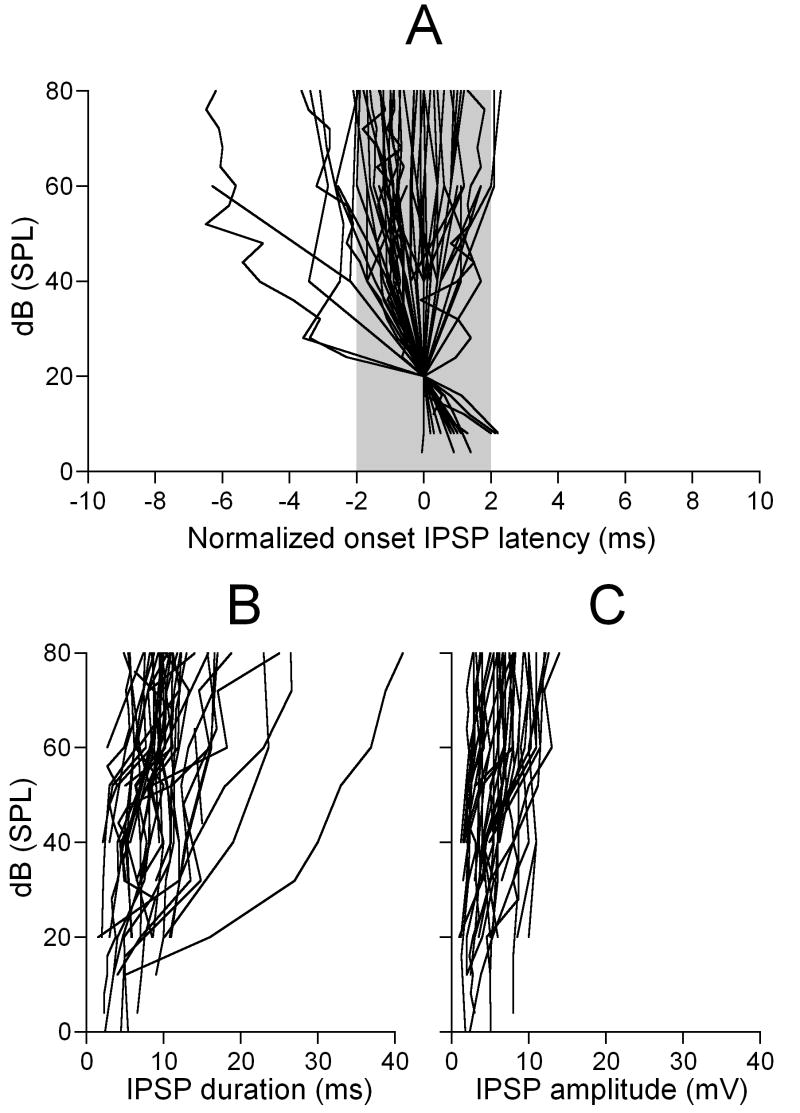
Neurons exhibiting onset hyperpolarization showed changes in their response latency, duration and amplitude with sound level. Figure 2 shows these level-dependent changes for 52 neurons for which we could measure the response hyperpolarization latency, duration and amplitude over a wide range of sound levels. In the majority of these neurons (44 out of 52), changes in the latency (increase or decrease) did not exceed 2 ms (Fig.2A). The remaining 8 neurons showed either a dramatic decrease (6 neurons) or a slight increase (2 neurons) in the latency. The duration of the response hyperpolarization increased with sound level in 38 out of 52 neurons (Fig.2B). The remaining 14 neurons showed little (less than 1 ms) changes in the duration with sound level. In the vast majority of IC neurons (92%), at the highest sound level used in this study (80 dB SPL), the duration of the response hyperpolarization did not exceed the value of 20 ms. Amplitude of response hyperpolarization did not change much with sound level (Fig.2C). Relatively larger changes occurred at sound levels close to neuron’s response threshold (10 to 30 dB SPL). At higher sound levels, however, amplitude of the hyperpolarization reached its maximum of a neuron specific value (4 to 12 mV) and changed very little with further increase in sound level.
Figure 2.
Sound level-dependent changes in response latency, duration, and amplitude of onset hyperpolarization in responses of 52 IC neurons. A, latency-level functions normalized to the values measured at 20 dB SPL (0 value on the X axis). A shaded area shows a population of neurons exhibiting changes less than ±1 ms. B, Level-dependent changes in amplitude of the response hyperpolarization. C, Level-dependent changes in duration of the response hyperpolarization.
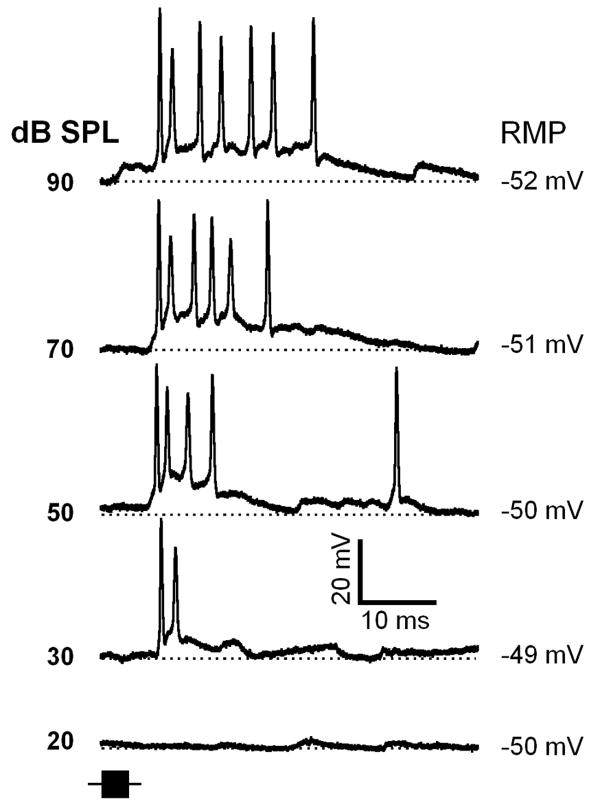
As we mentioned above, 12 out of 96 IC neurons exhibited only depolarization in their responses to FM sweeps. Across a wide range of sound levels these neurons showed no sign of hyperpolarization. A representative neuron is shown in Figure 3. As sound level was increased from threshold (30 dB SPL) to 90 dB SPL this neuron exhibited an increase in amplitude and duration of the depolarization as well as an increase in the number of spikes.
Figure 3.
Depolarization-spike response patterns from a neuron representative of a small population of IC neurons. This less typical response pattern shows the absence of hyperpolarizations in response to an FM sweep across a range of sound levels. The time course of the FM sweep stimulus is represented by a black horizontal bar at the lower left. Time and amplitude scale is shown at the bottom. Depth of recording = 720 μm. For protocols, see Fig.1.
Responses of neurons from the hyperpolarization-depolarization(spike)-hyperpolarization population had another striking response feature. Their onset hyperpolarizing responses were characterized by a very small jitter (about 100 μs) across repeated stimulus presentations. For example, in response to 4 FM sweeps (at 20 dB above spike threshold) a representative neuron shown in Figure 4A exhibited very little jitter in response latencies. The standard deviation of onset hyperpolarization latency was 0.078 ms (Fig.4B), whereas the first spike latency jitter was almost 10 times larger (0.56 ms) (Fig.4C). Figure 4D,E shows the population data from 62 IC neurons. Figure 4D exhibits the distribution of standard deviation values for onset hyperpolarization latency in response to FM sweeps presented multiple times (3 - 4) at sound levels 10 dB to 20 dB above neuron’s threshold for spikes. The jitter for onset hyperpolarization latency was very similar among neurons and ranged from 0.03 to 1.9 ms (mean 0.117 +/-0.149). The vast majority of these neurons (69%) had the jitter less than 0.1 ms. The latency jitters for spikes following hyperpolarizations were distributed within a wide range from 0.03 to 4 ms (mean 1.344 +/- 1.151) (Fig. 4E). This jitter was not correlated with the first spike latency (r = 0.21, p<0.001).
Figure 4.
Response latency jitter of IC neurons showing the typical hyperpolarization-depolarization(spike)-hyperpolarization response pattern. A, Superposition of intracellular response traces from a representative IC neuron to the same FM sweep presented 4 times. B, magnified view of 4 superimposed hyperpolarizations. Measurements of hyperpolarization jitter were made at a point where an hyperpolarization crosses the lines defining the 95% confidence limits, shown by solid horizontal lines (see method section for further details). C, magnified view of 4 superimposed spikes. Spike jitter was determined by using the first spike latency measured at the peak of each spike. D,E distribution of latency jitter for 62 IC neurons measured for their onset hyperpolarizations (D) and the first spike latencies (E). Bin size equals 1 ms. Vrest = - 48 mV, depth of recording = 1090 μm.
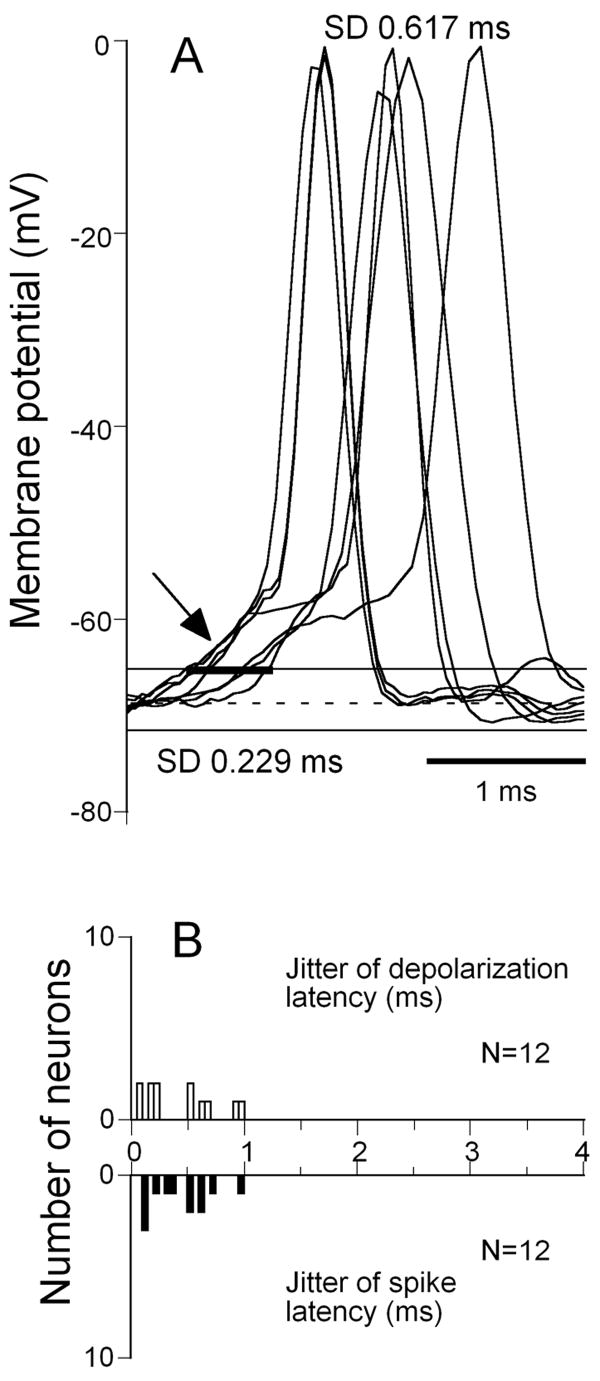
Neurons displaying an onset depolarization showed much larger jitter than neurons with onset hyperpolarization. A representative neuron shown in Figure 5A exhibited onset depolarization latency jitter more than 0.2 ms. The jitter for the first spike latency for this neuron was 0.617 ms. Figure 5B shows the population data from 12 IC neurons exhibited onset depolarization in response to FM sweeps. These neurons exhibited a wide range of latency jitters for the onset depolarization (mean 0.438 +/- 0.314) as well as for the first spike latency (mean 0.44 +/- 0.276) (Fig.5B).
Figure 5.
Response latency jitter of IC neurons showing onset depolarization(spike) response pattern. Recordings from a neuron with a depolarization(spike) response pattern showing similar jitter in latency of the initial depolarization and the first spike latency. A, Superposition of intracellular response traces of a representative IC neuron to the same FM sweep presented 6 times. B, distribution of latency jitter for 12 IC neurons measured for their onset depolarizations (B) and the first spike latencies (C). Vrest = - 69 mV, depth of recording = 870 μm.
Effect of sound level on latency of sound evoked potentials vs. first spike latencies
Latencies of sound evoked potentials (depolarizing or hyperpolarizing) and first spike discharges were determined for 25 IC neurons in response to pure tones. Tonal stimuli were presented at each neuron’s CF at the level of 10 to 20 dB above spike threshold. In this analysis, we did not include data for response to FM sweeps, because it is not clear to which part of an FM sweep a given IC neuron is responding. Majority of these neurons (15/25) responded to tones with onset hyperpolarization, whereas remaining 10 neurons showed an onset depolarization. We have a small sample size in this subset of experiments because it is unusual to record intracellular responses from awake animal longer that a few minutes. This protocol, however, required a recording time of at least 10 minutes.
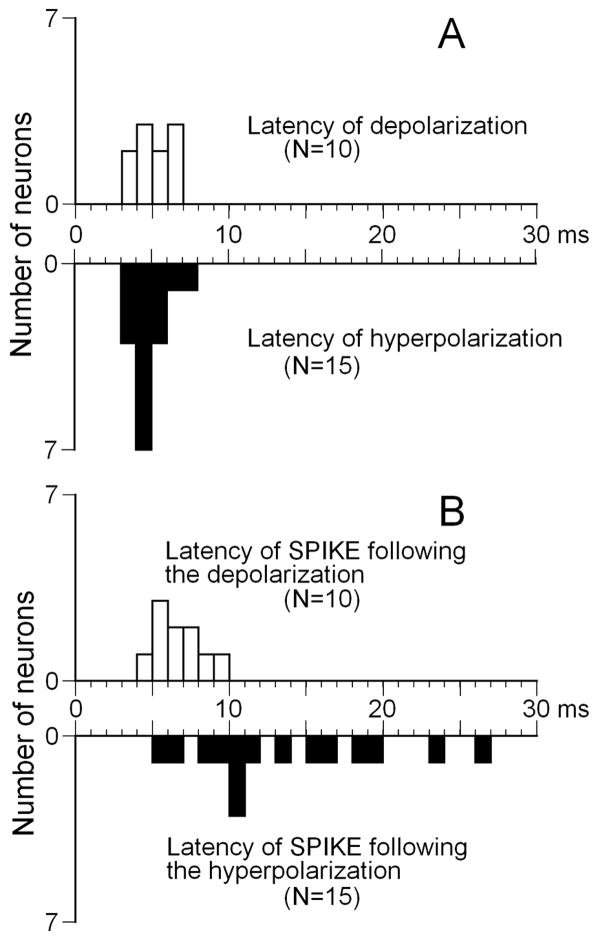
In this subset of experiments, we found that latencies of initial depolarizations or hyperpolarizations in IC neurons were short while their first spike latencies varied considerably from one neuron to another. Figure 6A shows the distribution of latencies for sound evoked potentials in response to tones presented at neuron’s CF at sound levels 10 dB above neuron’s threshold for spikes. Latencies for depolarizing and hyperpolarizing potentials were very similar among neurons and ranged from 3 to 7 ms (mean 5.42 +/-1.12) for depolarizations and from 3 to 8 ms (mean 4.9 +/- 1.01) for hyperpolarizations. Response latencies for depolarizing potentials were distributed evenly within the range whereas the majority of latencies for hyperpolarizing potentials were between 4 and 5 ms (Fig. 6A). The range of the first spike latencies of IC neurons, however were much broader than latencies of sound evoked potentials. Latencies of spikes that followed depolarizing potentials were shorter than latencies of spikes followed hyperpolarizing potentials (compare top and bottom histograms in Fig. 6B). The range of latencies for spikes that followed depolarizations was from 4 to 10 ms (mean 6.97 +/-1.6) whereas this range for spikes that followed hyperpolarizations was from 5 to 26 ms (mean 16.3 +/-6.4) (Fig. 6B).
Figure 6.
Distribution of response latencies for 25 IC neurons in response to pure tones (onset at 0 ms) at each neuron’s CF. Latency refers to sound evoked potentials (shown in A) and the first spike latency (shown in B). Bin size equals 1 ms.
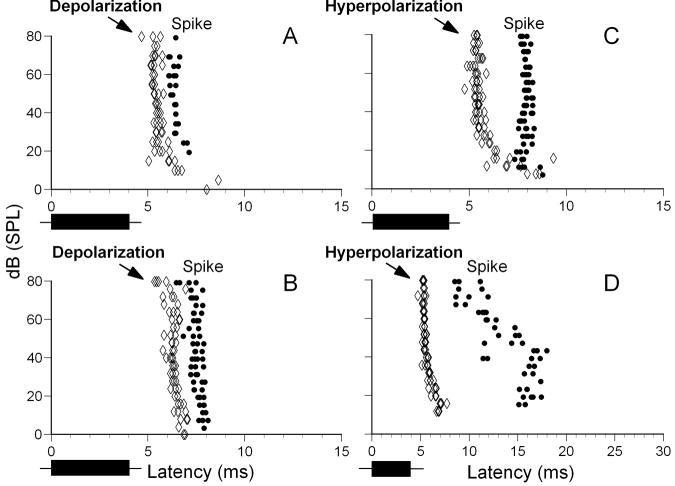
The majority of neurons with relatively long first spike latencies exhibited an onset hyperpolarization. One of possible explanations for this phenomenon is that these neurons may receive both an early, long-lasting inhibitory input followed by an independent long-latency excitatory input. If inhibitory and excitatory inputs are independent of each other, changes in parameters of one would not always lead to changes in the other. In order to test this hypothesis we recorded intracellular responses of 7 IC neurons to pure tones at neuron’s CF over an 80 dB range with 2 dB increment. Each sound level was presented four times. Latencies of sound evoked potentials and first spike latencies for these neurons were measured and compared. Five out of 7 neurons showed hyperpolarization-depolarization(spike)-hyperpolarization response pattern while the remaining 2 neurons exhibited depolarization(spike) response pattern. Neurons with depolarization(spike) response pattern showed similar shortening of both the onset depolarization and the first spike latencies with increasing sound level (Fig.7A,B). In contrast, for 5 neurons exhibiting hyperpolarization-depolarization(spike)-hyperpolarization response function, the first spike latency and onset hyperpolarization latency changed differently with increasing sound level (Fig. 7C,D). In these neurons depolarization could occur at the beginning, middle, or at the end of the hyperpolarization. When sound level was increased this depolarization often moved from the end of the hyperpolarization to its beginning or from the beginning to the end. Latency, duration and amplitude of the hyperpolarization, however, usually did not change much with sound level. The neuron shown in Fig. 7C exhibited a gradual decrease in latency of the hyperpolarization from 8 to about 5 ms when sound level was increased from 5 to about 30 dB SPL. At higher sound levels (> 30 dB to 80 dB SPL) this neuron showed nearly constant latency of the onset hyperpolarization. In contrast, the first spike latency changed very little with sound level and ranged from 7.3 to 8.3 ms. The neuron shown in Fig. 7D exhibited similar level-dependent changes in latencies of the onset hyperpolarization as the neuron shown in Fig. 7C. The first spike latency of this neuron showed a broad range of values and demonstrated a complex relationship with sound level. From 10 to about 40 dB SPL the first spike latency increased from 15 ms to 17 ms whereas at higher sound levels it dramatically decreased from 17 ms to 9 ms (Fig. 7D).
Figure 7.
Distribution of response latencies for 4 IC neurons (A - D) in response to pure tones at neuron’s CF presented at different sound levels. Latency refers to sound evoked depolarizing potentials (A, B) or hyperpolarizing potentials (C, D) (both shown by open diamonds) and the first spike latency (shown by black dots). For protocols, see Fig.1.
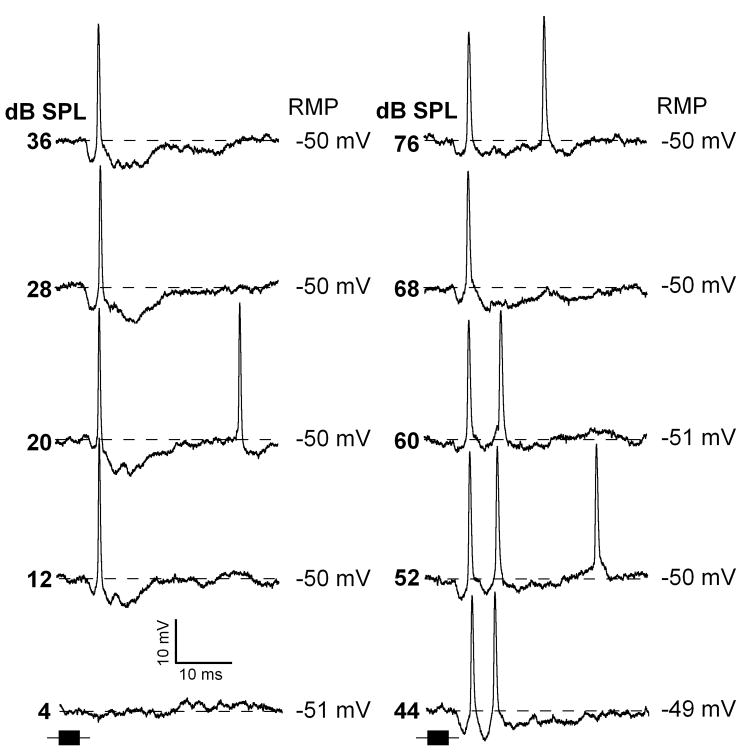
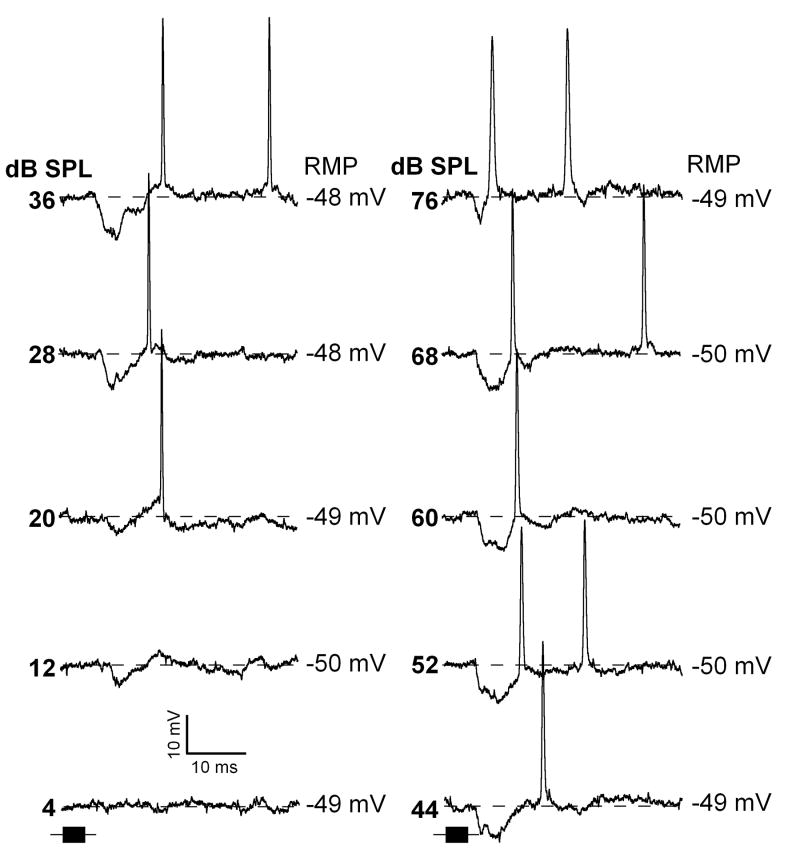
Individual intracellular traces for neurons shown in figure 7C,D are plotted in figures 8 and 9, respectively. For the neuron shown in figure 8, the response to pure tones at the CF (52 kHz) was a hyperpolarization of about 20 ms duration when sounds were presented at the levels from 20 to 80 dB SPL. At the level of 12 and 20 dB SPL this neuron exhibited an action potential during the rising phase of the hyperpolarization. Within the range of 44 dB to 60 dB SPL, in addition to the fist spike, it fired a second action potential. A little change in the first spike latency occurred with sound level. The neuron in figure 9 also showed short latency hyperpolarization in response to pure tone. This hyperpolarization had duration about 10 ms. At 20 dB SPL this neuron fired an action potential at the end of the hyperpolarization. However, at the level of 68 dB SPL the spike response shifted closer to the beginning of the hyperpolarization.
Figure 8.
Representative response traces of an IC neuron exhibiting sound evoked onset hyperpolarization with an action potential response at rising phase of the hyperpolarization (same neuron as in Fig.7C). Time course of the pure tones (52 kHz) are shown by black horizontal bars at the bottom of each column. Depth of recording = 1300 μm. For protocols, see Fig.1.
Figure 9.
Representative response traces of an IC neuron exhibiting sound evoked onset hyperpolarization with action potential response at end of the hyperpolarization (same neuron as in Fig.7D). Time course of the pure tones (32 kHz) are shown by black horizontal bars at the bottom of each column (same time scale as intracellular traces). Depth of recording = 1090 μm. For protocols, see Fig.1.
It is possible that in response to an FM sweep IC neurons could produce postsynaptic potentials to one frequency within the sweep range whereas spike responses could be driven by another frequency. If so, the difference between postsynaptic and spike response to an FM sweep and to a pure tone from the same neuron would be different. To address this issue we determined latencies for PSPs and spikes in response to FM sweeps and pure tones at neuron’s CF for the same IC neurons. Unfortunately, we could collect this information from only a limited number of neurons (total 7 cells). Determining neuron’s CF is a time-consuming procedure, whereas it is very rare to record intracellularly from IC neurons longer than a few minutes. The difference between the PSP and the fist spike latencies in response to pure tones was very similar to the difference in response latencies to FM sweeps (r = 0.89, p<0.001). These data suggest that the fist spike latency does not depend on separate neural input, but is defined by the preceding PSP.
Paradoxical latency shift (PLS)
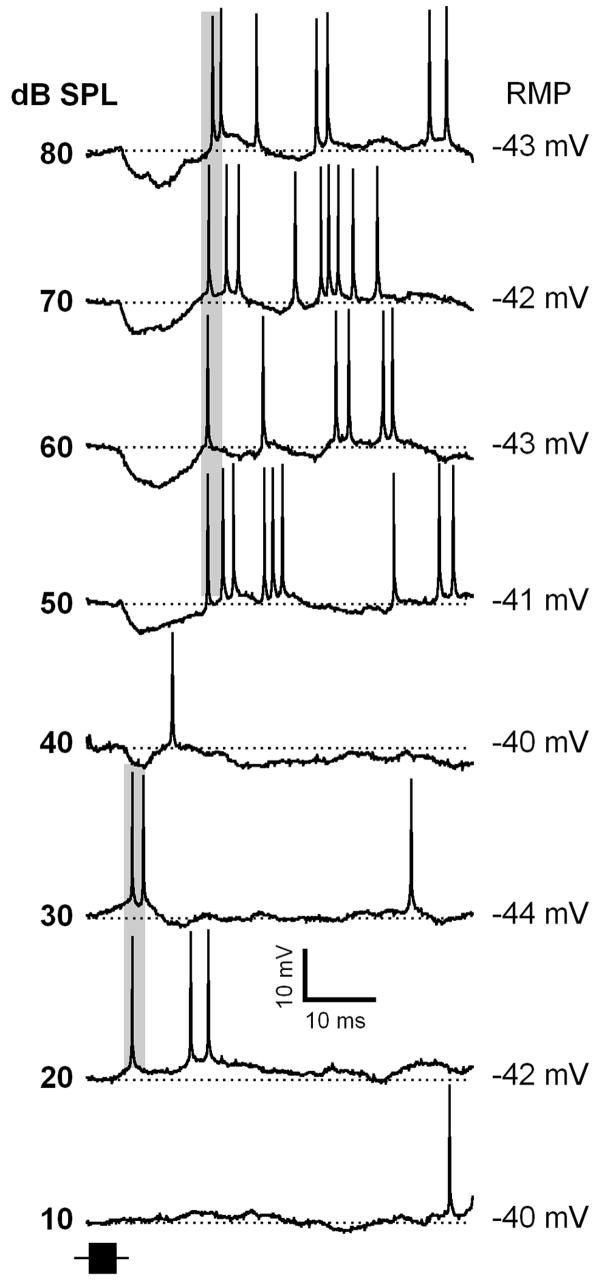
Typically, the latency of neuronal responses in the auditory system shows a small decrease in the first spike latency with increasing sound level (Aitkin et al. 1970; Brugge et al. 1969; Goldberg and Brownell 1973; Hind et al. 1963; Kitzes et al. 1978). In our experiments a small population of IC neurons (12 out of the 74 neurons showing onset hyperpolarizations) exhibited PLS. Their first spike response latencies were longer when sound level was increased. In response to FM sweep stimuli presented at higher sound levels, neurons exhibited a pronounced onset hyperpolarization and subsequent action potentials that fired with longer latency. The action potentials were generated at the end of the hyperpolarizations. The duration and amplitude of these hyperpolarizations, as well as the first spike latency, showed little change with further increases in sound level. These results are consistent with the results of our earlier studies utilizing extracellular recordings (Galazyuk and Feng, 2001; Galazyuk et al., 2005; Wang et al., 2007). An example of PLS neuron is shown in Figure 10. This neuron started to fire action potentials with latency about 8 ms when sound level was increased to 20 dB SPL. At 30 dB SPL this neuron also fired at the same latency. At 40 dB SPL a small hyperpolarization occurred. This neuron fired an action potential by the end of this hyperpolarization. When the sound level was increased to 50 dB SPL, the hyperpolarization became larger in amplitude (about 9 mV) and longer in duration (about 12 ms). Spikes occurred at the end of the hyperpolarization, at a latency of 17 ms. The shift in latency, as well as the neuron’s postsynaptic response pattern, did not change when sound level was further increased from 50 to 80 dB SPL.
Figure 10.
Representative response traces of an IC neuron exhibiting a paradoxical latency shift (PLS). The transition in the PLS occurs at 40 dB SPL. Shaded areas indicate spike responses determined based on multiple presentations of the same stimulus. Depth of recording = 472 μm. For protocols, see Fig.1.
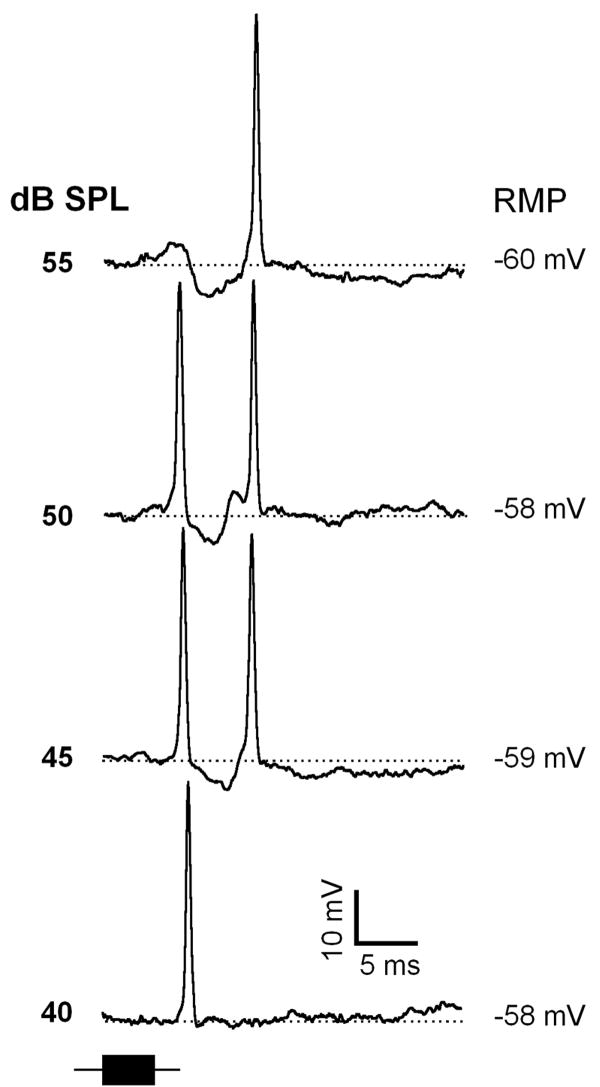
In PLS neurons the transition from short to long spike latency normally occurred within a narrow range of sound levels (less than 10 dB). Within this transition PLS neurons often showed spikes at short and long latencies to alternate stimulus presentations. Further increases in sound level dramatically increased the probability for long latency spikes whereas that for short latency spikes decreased. A representative neuron in Figure 11 in response to FM sweep fired with one action potential with a latency shifted about 5 ms. At 45 and 50 dB SPL, this neuron fired with two action potentials, one at 7 ms latency while another at 12 ms. At higher sound levels (55 dB SPL) this neuron showed spikes only at 12 ms.
Figure 11.
Representative response traces of a paradoxical latency shift IC neuron exhibiting spike responses at short and long latencies at the transition (45 - 50 dB SPL). Depth of recording = 715 μm. For protocols, see Fig.1.
Discussion
There are three main results emerging from the present report: (1) latencies of onset depolarizations or hyperpolarizations in IC neurons are short, whereas their first spike latencies may vary to a great extent, in particular for onset hyperpolarization (2) the most common pattern of response to FM sweeps is followed subsequently by depolarization and hyperpolarization (3) high threshold hyperpolarization precedes long latency spikes in IC neurons exhibiting PLS.
Short latency spike responses: possible mechanisms
A number of studies demonstrated that inhibition has little effect on the first spike latencies in auditory neurons (Johnson 1993; Casseday and Covey 1995; Lu et al. 1997; Fuzessery et al. 2003). The blockade of inhibition showed small (< 4 ms) shortening of the first spike latency. For short latency neurons, the amount of the shortening was typically under 1 ms. For long latencies, blockade decreases the first spike latency by more, but it does not explain the broad latency range in the IC. The results strongly suggest that inhibition should occur in these neurons slightly before excitation or at least simultaneously with excitation. In this condition, blocking of inhibition would slightly shorten the first spike latency in these neurons. Our data support this scenario. The majority of IC neurons showed onset hyperpolarization.
Long latency spike responses: possible mechanisms
We found a population of IC neurons showing responses with relatively long first spike latencies (up to 30 milliseconds). The long latency responses in the IC have been reported for different mammalian species including echolocating bats (Kitzes et al., 1978; Harrison and Palmer, 1984; Park and Pollak, 1993a; Le Beau et al., 1996; Klug et al., 2000; Fuzessery et al., 2003).
Several mechanisms may contribute to long latency responses in the IC. One of them may utilize fast inhibition, which substantially delays spiking. Indeed, the neurons with a long first spike latency always exhibited onset hyperpolarization in their responses. It is possible that excitatory inputs in these neurons are long lasting (a few tens of milliseconds) and arrive to these neurons simultaneously with inhibitory inputs or slightly later. If so, a long lasting inhibition would suppress the beginning and a subsequent part of the sustained excitation. This inhibitory-based mechanism may substantially delay the first spike latency, which will be determined by the duration of this inhibition. Our findings do not support this scenario. First of all, many IC neurons exhibited changes in their first spike latency with sound level independently of changes in the onset hyperpolarization. Second, duration of both FM sweeps and pure tones (4 ms) was too short to evoke long lasting sustained depolarizations in IC neurons.
It has been suggested that inhibition may contribute to the long latency responses via suppression of onset responses in the neurons exhibiting onset/offset response functions (Park and Pollak 1993a). We can not rule out this possibility, because in our study we did not change sound duration. However, since sound duration, during our experiments, was kept at 4 ms, this mechanism should play a small role in the creation of very long response latencies.
There is another inhibition-based mechanism, which may account for long response latencies in IC neurons. This mechanism utilizes postinhibitory rebound excitation (Casseday et al. 1994, Covey et al. 1996; Sivaramakrishnan and Oliver 2001). In our study a small population of IC neurons showed long latency spikes at the end of the hyperpolarization. This population included neurons showing PLS as well as neurons that did not exhibited PLS. It is possible that all of these neurons utilize a mechanism of postinhibitory rebound excitation to delay their first spike latency. Our prediction is that blocking inhibition in these neurons would eliminate their long latency spikes and possibly uncover short latency spikes (see discussion of a mechanism underlying PLS below for further details).
Besides inhibition there is another mechanism that may delay the first spike latency in collicular neurons. It has been demonstrated that NMDA receptors affect timing of neural discharges (Binns 1999; Kelly and Zhang 2002; Blitz and Regehr 2003). They mediate later discharges in auditory neurons following initial responses mediated by AMPA receptors or they can even contribute to later responses in IC neurons acting independently of AMPA receptors (Sanchez et al. 2007).
One more factor which may contribute to the first spike latency is binaural response properties. Multiple studies showed that there is a large population of binaural neurons in the IC that are excited by stimulation of one ear, and inhibited by stimulation of the other ear (Park and Pollak 1993b; Oswald et al. 1999; Koch and Grothe 2000; Lu and Jen 2003; Park et al. 2004). The response pattern and response latency of these cells would depend on the strengths of excitation and inhibition, which in turn depend on sound level.
Long inhibition interrupted by excitation vs. independent pre- and post-excitatory inhibition
Our data suggest that the vast majority of IC neurons show a prominent hyperpolarizing component in response to the entire FM sweep as demonstrated by their hyperpolarization-depolarization(spike)-hyperpolarization response functions. This data is consistent with results of our previous study conducted with a different FM bat, Myotis lucifugus (Voytenko and Galazyuk 2007). Early hyperpolarization that precedes depolarization in responses of auditory neurons to sounds has also been documented in other intracellular and whole-cell patch-clamp studies (Nelson and Erulkar 1963; Smith 1992; Carney and Yin 1989; Covey et al. 1996; Kuwada et al. 1997; Li et al. 1999). Furthermore, similar to our findings, during in-vivo patch-clamp recording from IC neurons in big brown bats hyperpolarization-depolarization(spike)-hyperpolarization responses were observed (Covey et al. 1996). However, it is still not clear if early and late hyperpolarization is evoked by two independent inhibitory inputs or if they are two parts of a long lasting hyperpolarization interrupted by an excitatory input.
We can not provide a definitive answer to this question for all neurons that have been recorded for this study. However, for a subset of IC neurons we found some evidence that support the conclusion that these apparent hyperpolarizing components are two parts of a long-lasting hyperpolarization. First of all, some of these neurons, at low sound levels, exhibited a single long lasting hyperpolarization without a depolarization in the middle (Fig1A,B). Second, when sound level was increased some neurons exhibited a shift in the latency of depolarizing potentials or spikes without a noticeable change in the overall duration or the shape of this hyperpolarization (Fig.9). Third, at higher sound levels the combined shapes of the early and late hyperpolarizations of the hyperpolarization-depolarization(spike)-hyperpolarization response pattern would approximate the classic IPSP shape with a rapid onset and slow exponential decay (Fig.1A). This IPSP profile has been observed often during intracellular recordings from auditory neurons (Erulkar et al. 1968; Volkov and Galazyuk 1991; 1992). However, this shape does not exclude a possibility that this hyperpolarization is a result of multiple inhibitory inputs arriving to a given neuron within a short time period. On the other hand, it is still difficult to rule out the possibility that early and late hyperpolarizations for some IC neurons are independent from each other. Recently, during whole-cell in-vivo recording it has been demonstrated that early and late inhibition in the IC can be simply onset and offset responses to a single sound (Xie et al. 2007).
Functional significance of the onset hyperpolarization
The phenomenon of onset hyperpolarization has been previously observed in the inferior colliculus (Carney and Yin, 1989; Kuwada et al, 1997; Nayagam et al, 2006; Voytenko and Galazyuk, 2007) as well as in other levels of the auditory pathway (Peruzzi et al., 1997; Nayagam et al, 2005). It was proposed to play a role in adjusting the timing of the fist spike latency for neurons of the ventral nucleus of the lateral lemniscus and the inferior colliculus in rats (Nayagam et al, 2005; 2006). The spike threshold has been shown to be affected by the rate of the preceding depolarization in IC neurons (Pena and Konishi 2002) and in visual cortex (Azouz and Grey, 2000). The steeper sound evoked onset depolarization triggers spikes more effectively than spontaneous depolarizations. The onset hyperpolarization may serve as a mechanism to increase steepness for stimulus driven depolarizing potentials, occurring during this hyperpolarization, and therefore to lower spike thresholds to sounds compared to background spikes. Inhibition has been also suggested to reduce latency jitter of the first spike latency in neurons of the medial geniculate body (Peruzzi et al., 1997). Our data, however, does not support this finding. The range of latency jitters for spikes preceded by depolarization or hyperpolarization was very similar.
Our data suggest that sound level alters postsynaptic potentials and can affect the first spike latencies in IC neurons. Unfortunately, our recording technique did not permit studying parameters of excitatory and inhibitory potentials independent of each other. Such data are vital to shed light on postsynaptic mechanisms underlying changes in first spike latency with sound level.
Role of inhibition in paradoxical latency shift
Our data suggest that IC neurons exhibiting PLS receive both the low threshold excitatory and the high threshold inhibitory inputs. At high sound levels, these inputs arrive at an IC neuron at the same time or the inhibitory input slightly before excitatory. Thus, the hyperpolarization caused by an inhibitory input suppresses responses to the excitatory input. At the same time it creates a strong postinhibitory rebound depolarization which may trigger late action potentials. If duration of this hyperpolarization does not depend on sound level such neurons would show delayed spike latencies that are sound level tolerant. Indeed, in our experiments PLS neurons showed high threshold hyperpolarizations in which both the amplitude and the duration were sound independent. Our prediction is that blocking of inhibition for such neurons would eliminate their delayed spikes and restore action potentials with short latencies. We demonstrated that spike latencies of IC neurons can alternate between shorter and longer times at the transitional sound levels (Fig.11). The transitional sound level was very close to the threshold for hyperpolarizations associated with producing PLS. At this sound level the hyperpolarizations were not strong enough to either completely block short latency spikes evoked by short latency depolarizations or to evoke stable postinhibitory rebound spikes.
Possible sources of short latency inhibitory inputs to the IC
Several of the superior olivary and lateral lemniscal nuclei provide inhibitory inputs to the IC. (see Pollak and Park 1995 and Schofield 2005 for review). Therefore, it is likely that hyperpolarization which we observed during our intracellular recording in the majority of IC neurons was the result of convergent inhibitory inputs from these brainstem nuclei. Intrinsic GABAergic IC neurons may also contribute to the hyperpolarization. In spite of this, we hypothesize that the onset part of inhibition is evoked by a single inhibitory input. The onset hyperpolarizations had two common characteristics. First, they have very short latencies. Second, the latency jitter of these hyperpolarizations was usually less than 100 μs. What is the potential source of this inhibitory input?
In the big brown bat, response properties as well as identity of the brainstem nuclei providing inputs to the IC have been studied extensively (Covey and Casseday 1991; Haplea et al. 1994; Vater et al. 1997). Results of these studies suggest that the most likely source of the onset hyperpolarization is the columnar division of the ventral nucleus of the lateral lemniscus (VNLLc). Almost all of neurons from this nucleus are glycinergic (Vater et al. 1997). Unlike other nuclei of the lateral lemniscus or many superior olivary neurons, the majority of neurons in the VNLLc of the big brown bat respond to an exceptionally broad range of frequencies with an almost constant latency regardless of the frequency or level of sound (Covey and Casseday 1991). They also have extremely low latency jitter over a broad range of stimulus conditions (Haplea et al. 1994). Furthermore, VNLLc neurons in the big brown bat receive a fast and robust excitatory synaptic input via large calyx-like perisomatic terminals from the cochlear nucleus (Vater et al. 1997). This provides a fast inhibitory pathway to the IC, and may explain why the majority of IC neurons in our experiments exhibited hyperpolarizations that preceded depolarizations.
Acknowledgments
We thank Jeffrey Wenstrup and David Gooler for their valuable comments on earlier versions of this manuscript. This work was supported by a grant R01DC005377 from the National Institute on Deafness and Other Communication Disorders of the NIH.
Footnotes
Publisher's Disclaimer: This is a PDF file of an unedited manuscript that has been accepted for publication. As a service to our customers we are providing this early version of the manuscript. The manuscript will undergo copyediting, typesetting, and review of the resulting proof before it is published in its final citable form. Please note that during the production process errors may be discovered which could affect the content, and all legal disclaimers that apply to the journal pertain.
References
- Aitkin LM, Anderson DJ, Brugge JF. Tonotopic organization and discharge characteristics of single neurons in nuclei of the lateral lemniscus of the cat. J Neurophysiol. 1970;33:421–440. doi: 10.1152/jn.1970.33.3.421. [DOI] [PubMed] [Google Scholar]
- Azouz R, Gray CM. Dynamic spike threshold reveals a mechanism for synaptic coincidence detection in cortical neurons in vivo. Proc Natl Acad Sci USA. 2000;97:8110–8115. doi: 10.1073/pnas.130200797. [DOI] [PMC free article] [PubMed] [Google Scholar]
- Berkowitz A, Suga N. Neural mechanisms of ranging are different in two species of bats. Hear Res. 1989;41:255–264. doi: 10.1016/0378-5955(89)90017-8. [DOI] [PubMed] [Google Scholar]
- Binns KE. The synaptic pharmacology underlying sensory processing in the superior colliculus. Prog Neurobiol. 1999;59:129–159. doi: 10.1016/s0301-0082(98)00099-9. [DOI] [PubMed] [Google Scholar]
- Blitz DM, Regehr WG. Retinogeniculate synaptic properties controlling spike number and timing in relay neuron. J Neurophysiol. 2003;90:2438–2450. doi: 10.1152/jn.00562.2003. [DOI] [PubMed] [Google Scholar]
- Brugge JF, Dubrovsky NA, Aitkin LM, Anderson DJ. Sensitivity of single neurons in auditory cortex of cat to binaural tonal stimulation; effects of varying interaural time and intensity. J Neurophysiol. 1969;32:1005–1024. doi: 10.1152/jn.1969.32.6.1005. [DOI] [PubMed] [Google Scholar]
- Casseday JH, Covey E. Mechanisms for the analysis of auditory temporal patterns in the brainstem of echolocating bats. In: Covey E, Hawkings HL, Port RF, editors. Neural Representations of Temporal Patterns. New York: Plenum Press; 1995. pp. 25–52. [Google Scholar]
- Casseday JH, Ehrlich D, Covey E. Neural tuning for sound duration: role of inhibitory mechanisms in the inferior colliculus. Science. 1994;264:847–850. doi: 10.1126/science.8171341. [DOI] [PubMed] [Google Scholar]
- Carney LH, Yin TC. Responses of low-frequency cells in the inferior colliculus to interaural time differences of clicks: excitatory and inhibitory components. J Neurophysiol. 1989;62:144–161. doi: 10.1152/jn.1989.62.1.144. [DOI] [PubMed] [Google Scholar]
- Covey E, Casseday JH. The monaural nuclei of the lateral lemniscus in an echolocating bat: parallel pathways for analyzing temporal features of sound. J Neurosci. 1991;11:3456–3470. doi: 10.1523/JNEUROSCI.11-11-03456.1991. [DOI] [PMC free article] [PubMed] [Google Scholar]
- Covey E, Casseday JH. Timing in the auditory system of the bat. Annu Rev Physiol. 1999;61:457–476. doi: 10.1146/annurev.physiol.61.1.457. [DOI] [PubMed] [Google Scholar]
- Covey E, Kauer JA, Casseday JH. Whole-cell patch-clamp recording reveals subthreshold sound-evoked postsynaptic currents in the inferior colliculus of awake bats. J Neurosci. 1996;16:3009–3018. doi: 10.1523/JNEUROSCI.16-09-03009.1996. [DOI] [PMC free article] [PubMed] [Google Scholar]
- Erulkar LD, Butler RA. Excitation and inhibition in cochlear nucleus. II Frequency-modulated tones. In: Gerstein GL, editor. J Neurophysiol. Vol. 31. 1968. pp. 537–548. [DOI] [PubMed] [Google Scholar]
- Fuzessery ZM, Wenstrup JJ, Hall JC, Leroy S. Inhibition has little effect on response latencies in the inferior colliculus. J Assoc Res Otolaryngol. 2003;4:60–73. doi: 10.1007/s10162-002-2054-6. [DOI] [PMC free article] [PubMed] [Google Scholar]
- Galazyuk AV, Feng AS. Oscillation may play a role in time domain central auditory processing. J Neuroscience. 2001;21:RC147. doi: 10.1523/JNEUROSCI.21-11-j0001.2001. [DOI] [PMC free article] [PubMed] [Google Scholar]
- Galazyuk AV, Lin W, Llano D, Feng AS. Leading inhibition to neural oscillation is important for time-domain processing in the auditory midbrain. J Neurophysiol. 2005;94:314–326. doi: 10.1152/jn.00056.2005. [DOI] [PubMed] [Google Scholar]
- Goldberg JM, Brownell WE. Discharge characteristics of neurons in anteroventral and dorsal cochlear nuclei of cat. Brain Res. 1973;64:35–54. doi: 10.1016/0006-8993(73)90169-8. [DOI] [PubMed] [Google Scholar]
- Haplea S, Covey E, Casseday JH. Frequency tuning and response latencies at three levels in the brainstem of the echolocating bat, Eptesicus fuscus. J Comp Physiol [A] 1994;174:671–683. doi: 10.1007/BF00192716. [DOI] [PubMed] [Google Scholar]
- Harrison RV, Palmer AR. Neurone response latency in the inferior colliculus in relation to the auditory brainstem responses (ABR) in the guinea pig. Scand Audiol. 1984;13:275–281. doi: 10.3109/01050398409042136. [DOI] [PubMed] [Google Scholar]
- Hind JE, Goldberg JM, Greenwood DD, Rose JE. Some discharge characteristics of single neurons in the inferior colliculus of the cat. II. Timing of the discharges and observations on binaural stimulation. J Neurophysiol. 1963;26:321–341. doi: 10.1152/jn.1963.26.2.321. [DOI] [PubMed] [Google Scholar]
- Johnson PABR. PhD thesis. Duke University; Durham, NC: 1993. GABAergic and glycinergic inhibition in the central nucleus of the inferior colliculus of the big brown bat. [Google Scholar]
- Kelly JB, Zhang H. Contribution of AMPA and NMDA receptors to excitatory responses in the inferior colliculus. Hear Res. 2002;168:35–42. doi: 10.1016/s0378-5955(02)00372-6. [DOI] [PubMed] [Google Scholar]
- Kitzes LM, Gibson MM, Rose JE, Hind JE. Initial discharge latency and threshold considerations for some neurons in cochlear nuclear complex of the cat. J Neurophysiol. 1978;41:1165–1182. doi: 10.1152/jn.1978.41.5.1165. [DOI] [PubMed] [Google Scholar]
- Klug A, Khan A, Burger RM, Bauer EE, Hurley LM, Yang L, Grothe B, Halvorsen MB, Park TJ. Latency as a function of intensity in auditory neurons: influences of central processing. Hear Res. 2000;148:107–123. doi: 10.1016/s0378-5955(00)00146-5. [DOI] [PubMed] [Google Scholar]
- Klug A, Bauer EE, Hanson JT, Hurley L, Meitzen J, Pollak GD. Response selectivity for species-specific calls in the inferior colliculus of Mexican free-tailed bats is generated by inhibition. J Neurophysiol. 2002;88:1941–1954. doi: 10.1152/jn.2002.88.4.1941. [DOI] [PubMed] [Google Scholar]
- Koch U, Grothe B. Interdependence of spatial and temporal coding in the auditory midbrain. J Neurophysiol. 2000;83:2300–2314. doi: 10.1152/jn.2000.83.4.2300. [DOI] [PubMed] [Google Scholar]
- Kuwada S, Batra R, Yin TC, Oliver DL, Haberly LB, Stanford TR. Intracellular recordings in response to monaural and binaural stimulation of neurons in the inferior colliculus of the cat. J Neurosci. 1997;17:7565–7581. doi: 10.1523/JNEUROSCI.17-19-07565.1997. [DOI] [PMC free article] [PubMed] [Google Scholar]
- Le Beau FE, Rees A, Malmierca MS. Contribution of GABA- and glycine-mediated inhibition to the monaural temporal response properties of neurons in the inferior colliculus. J Neurophysiol. 1996;75:902–919. doi: 10.1152/jn.1996.75.2.902. [DOI] [PubMed] [Google Scholar]
- Li Y, Evans MS, Faingold CL. Synaptic response patterns of neurons in the cortex of rat inferior colliculus. Hear Res. 1999;137:15–28. doi: 10.1016/s0378-5955(99)00129-x. [DOI] [PubMed] [Google Scholar]
- Lu Y, Jen PH-S, Zheng Q-Y. GABAergic disinhibition changes the recovery cycle of bat inferior colliculus neurons. J Comp Physiol. 1997;181:331–341. doi: 10.1007/s003590050119. [DOI] [PMC free article] [PubMed] [Google Scholar]
- Lu Y, Jen PH. Binaural interaction in the inferior colliculus of the big brown bat, Eptesicus fuscus. Hear Res. 2003;177:100–110. doi: 10.1016/s0378-5955(03)00024-8. [DOI] [PubMed] [Google Scholar]
- Nayagam DA, Clarey JC, Paolini AG. Powerful onset inhibition in the ventral nucleus of the lateral lemniscus. J Neurophysiol. 2005;94:1651–1654. doi: 10.1152/jn.00167.2005. [DOI] [PubMed] [Google Scholar]
- Nayagam DA, Clarey JC, Paolini AG. Intracellular responses and morphology of rat ventral complex of the lateral lemniscus neurons in vivo. J Comp Neurol. 2006;498:295–315. doi: 10.1002/cne.21058. [DOI] [PubMed] [Google Scholar]
- Nelson PG, Erulkar SD. Synaptic mechanisms of excitation and inhibition in the central auditory pathway. J Neurophysiol. 1963;26:908–923. doi: 10.1152/jn.1963.26.6.908. [DOI] [PubMed] [Google Scholar]
- Oertel D. The role of timing in the brain stem auditory nuclei of vertebrates. Annu Rev Physiol. 1999;61:497–519. doi: 10.1146/annurev.physiol.61.1.497. [DOI] [PubMed] [Google Scholar]
- Oswald JP, Klug A, Park TJ. Interaural intensity difference processing in auditory midbrain neurons: effects of a transient early inhibitory input. J Neurosci. 1999;19:1149–1163. doi: 10.1523/JNEUROSCI.19-03-01149.1999. [DOI] [PMC free article] [PubMed] [Google Scholar]
- Park TJ, Klug A, Holinstat M, Grothe B. Interaural level difference processing in the lateral superior olive and the inferior colliculus. J Neurophysiol. 2004;92:289–301. doi: 10.1152/jn.00961.2003. [DOI] [PubMed] [Google Scholar]
- Park TJ, Pollak GD. GABA Shapes a topographic organization of response latency in the mustache bat’s inferior colliculus. J Neurosci. 1993a;13:5172–5187. doi: 10.1523/JNEUROSCI.13-12-05172.1993. [DOI] [PMC free article] [PubMed] [Google Scholar]
- Park TJ, Pollak GD. GABA shapes sensitivity to interaural intensity disparities in the mustache bat’s inferior colliculus: Implications for encoding sound location. J Neurosci. 1993b;13:2050–2067. doi: 10.1523/JNEUROSCI.13-05-02050.1993. [DOI] [PMC free article] [PubMed] [Google Scholar]
- Pena JL, Konishi M. From postsynaptic potentials to spikes in the genesis of auditory spatial receptive fields. J Neurosci. 2002;22:5652–5658. doi: 10.1523/JNEUROSCI.22-13-05652.2002. [DOI] [PMC free article] [PubMed] [Google Scholar]
- Peruzzi D, Bartlett E, Smith PH, Oliver DL. A monosynaptic GABAergic input from the inferior colliculus to the medial geniculate body in rat. J Neurosci. 1997;17:3766–3777. doi: 10.1523/JNEUROSCI.17-10-03766.1997. [DOI] [PMC free article] [PubMed] [Google Scholar]
- Pollak GD, Park TJ. The inferior colliculus. In: Popper AN, Fay RR, editors. Springer Handbook of Auditory Research, Hearing by Bats. Springer-Verlag; New York: 1995. pp. 296–367. [Google Scholar]
- Pollak GD, Klug A, Bauer EE. Processing and representation of species-specific communication calls in the auditory system of bats. Int Rev Neurobiol. 2003;56:83–121. doi: 10.1016/s0074-7742(03)56003-2. [DOI] [PubMed] [Google Scholar]
- Sanchez JT, Gans D, Wenstrup JJ. Contribution of NMDA and AMPA receptors to temporal patterning of auditory responses in the inferior colliculus. J Neurosci. 2007;27:1954–1963. doi: 10.1523/JNEUROSCI.2894-06.2007. [DOI] [PMC free article] [PubMed] [Google Scholar]
- Schofield BR. The Superior Olivary Complex and Lateral Lemniscal Connections of the Auditory Midbrain. In: Winer JA, Schreiner CE, editors. The Inferior Colliculus. Springer Verlag; New York: 2005. pp. 132–154. [Google Scholar]
- Sivaramakrishnan S, Oliver DL. Distinct K currents result in physiologically distinct cell types in the inferior colliculus of the rat. J Neurosci. 2001;21:2861–2877. doi: 10.1523/JNEUROSCI.21-08-02861.2001. [DOI] [PMC free article] [PubMed] [Google Scholar]
- Smith PH. Anatomy and physiology of multipolar cells in the rat inferior collicular cortex using the in vitro brain slice technique. J Neurosci. 1992;12:3700–3715. doi: 10.1523/JNEUROSCI.12-09-03700.1992. [DOI] [PMC free article] [PubMed] [Google Scholar]
- Sullivan WE., 3rd Possible neural mechanisms of target distance coding in auditory system of the echolocating bat Myotis lucifugus. J Neurophysiol. 1982;48:1033–1047. doi: 10.1152/jn.1982.48.4.1033. [DOI] [PubMed] [Google Scholar]
- Vater M, Covey E, Casseday JH. The columnar region of the ventral nucleus of the lateral lemniscus in the big brown bat (Eptesicus fuscus): synaptic arrangements and structural correlates of feedforward inhibitory function. Cell Tissue Res. 1997;289:223–233. doi: 10.1007/s004410050869. [DOI] [PubMed] [Google Scholar]
- Volkov IO, Galazjuk AV. Formation of spike response to sound tones in cat auditory cortex neurons: interaction of excitatory and inhibitory effects. Neuroscience. 1991;43:307–321. doi: 10.1016/0306-4522(91)90295-y. [DOI] [PubMed] [Google Scholar]
- Volkov IO, Galazyuk AV. Peculiarities of inhibition in cat auditory cortex neurons evoked by tonal stimuli of various durations. Exp Brain Res. 1992;91:115–120. doi: 10.1007/BF00230019. [DOI] [PubMed] [Google Scholar]
- Voytenko SV, Galazyuk AV. Intracellular recording reveals temporal integration in inferior colliculus neurons of awake bats. J Neurophysiol. 2007;97:1368–1378. doi: 10.1152/jn.00976.2006. [DOI] [PubMed] [Google Scholar]
- Wang X, Galazyuk AV, Feng AS. FM signals produce robust paradoxical latency shifts in the bat’s inferior colliculus. J Comp Physiol A. 2007;193:13–20. doi: 10.1007/s00359-006-0167-9. [DOI] [PubMed] [Google Scholar]
- Xie R, Meitzen J, Pollak GD. Differing roles of inhibition in hierarchical processing of species-specific calls in auditory brainstem nuclei. J Neurophysiol. 2005;94:4019–4037. doi: 10.1152/jn.00688.2005. [DOI] [PubMed] [Google Scholar]
- Xie R, Gittelman JX, Pollak GD. Rethinking tuning: in vivo whole-cell recordings of the inferior colliculus in awake bats. J Neurosci. 2007;27:9469–9481. doi: 10.1523/JNEUROSCI.2865-07.2007. [DOI] [PMC free article] [PubMed] [Google Scholar]


