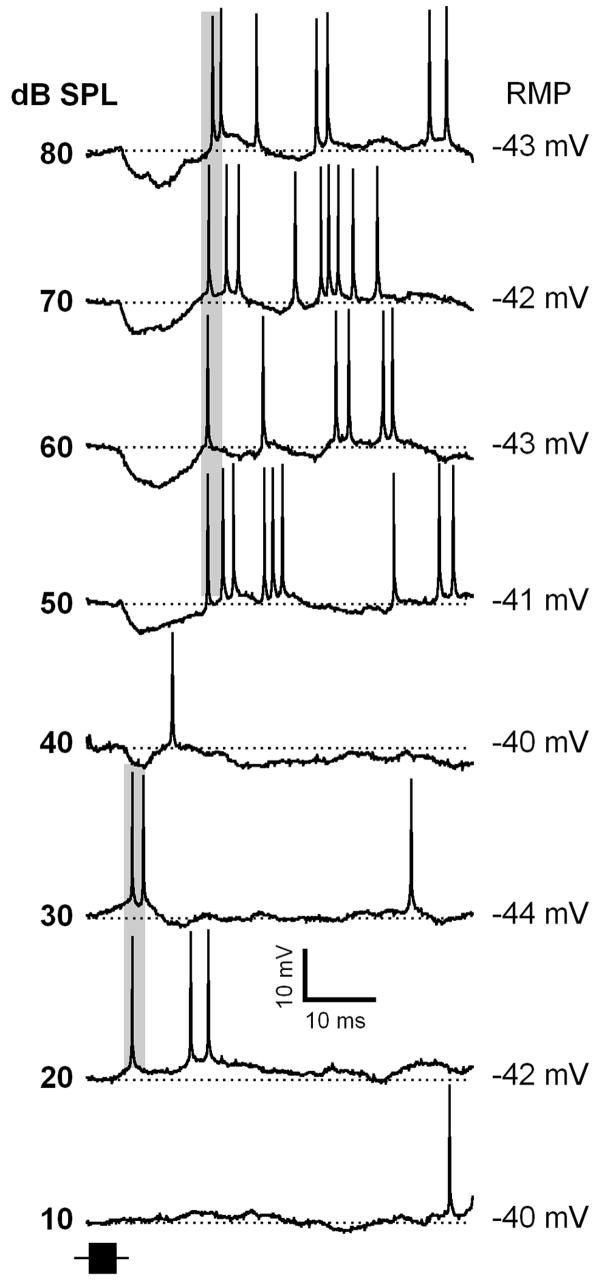
Figure 10.
Representative response traces of an IC neuron exhibiting a paradoxical latency shift (PLS). The transition in the PLS occurs at 40 dB SPL. Shaded areas indicate spike responses determined based on multiple presentations of the same stimulus. Depth of recording = 472 μm. For protocols, see Fig.1.

