

Abstract
The photoluminescence of mercaptoacetic acid (MAA)-capped CdSe/ZnSe/ZnS semiconductor nanocrystal quantum dots (QDs) in SKOV-3 human ovarian cancer cells is pH-dependent, suggesting applications in which QDs serve as intracellular pH sensors. In both fixed and living cells the fluorescence intensity of intracellular MAA-capped QDs (MAA QDs) increases monotonically with increasing pH. The electrophoretic mobility of MAA QDs also increases with pH, indicating an association between surface charging and fluorescence emission. MAA dissociates from the ZnS outer shell at low pH, resulting in aggregation and loss of solubility, and this may also contribute to the MAA QD fluorescence changes observed in the intracellular environment.
Keywords: pH sensor, quantum dots
INTRODUCTION
Engineered nanoparticles, which have unique properties arising from their small size and their large surface-to-volume ratio, are currently a topic of great interest in many areas, particularly as candidates for robust and versatile sensors in medicine and biotechnology. For example, DNA-linked gold nanoparticles can detect lead1, a tin oxide nanocrystalline thick film serves as an NO2 detector2, and CdSe quantum dots functionalized with bovine serum albumin (BSA) can sense silver ions3. In this work we use colloidal luminescent semiconductor nanocrystals, quantum dots (QDs), as an intracellular pH sensor. Because their sensing properties are strongly dependent on the immediately surrounding environment, specially designed and custom-synthesized core/shell/shell QDs capped with small organic molecules are used. Our minimally passivated three-layer QDs are smaller than the QDs with thick polymer coats that are currently used for probes. This property facilitates the access of MAA-capped QD to intracellular compartments while at the same time providing a higher sensitivity to environmental conditions. These QDs are intrinsically pH sensitive, requiring no further functionalization.
Nanocrystals can be made soluble in aqueous solution by capping hydrophilic organic ligands to their surfaces. However, these ligands do not provide complete isolation from the surrounding medium. As a result, the luminescence of the QD material is strongly dependent on chemical and physical environmental conditions and tends to decrease with time as a result of oxidation of the nanocrystal surface4. QD photoluminescence properties can be stabilized by growing a thin shell of a semiconductor material with wide band gap on the outside of the emitting nanocrystal core before solubilizing5.
With a CdSe core, commonly selected for emission in the visible range, several II-VI semiconductors (ZnS 5,6, CdS 4,7–9, ZnSe 10,11) with wide band gaps may be considered for the shell. Among those materials, ZnS has the widest band gap (3.8 eV for the bulk material) and provides the best confinement for radiative excitons12. However, the large lattice mismatch (about 12%) between CdSe and ZnS leads to the formation of misfit dislocations5,13 at the core-shell interface. Although CdS and ZnSe crystal spacings are closer to CdSe, these materials provide only moderate exciton confinement5,12. We exploit both the wide band gap of ZnS and the small ZnSe-CdSe lattice mismatch by growing a “buffer” layer of ZnSe between the CdSe core and a ZnS shell. With this core/shell/shell structure, one can grow a multi-layered shell with fewer defects while maintaining strong exciton confinement. The core/shell/shell structure also offers the possibility of confining electrons and holes in different regions with band offsets inaccessible to the usual QDs with core-only or core-shell structures14,15. One can thus engineer the QDs to emit in spectral regions where photon energies are much smaller than band gaps of common semiconductor materials.
In this work, we report the synthesis of core/shell/shell QDs and the solubilization of these nanoparticles by capping with mercaptoacetic acid (MAA), and we show how these QDs can be used for fluorescence imaging of living cells. Although the core/shell/shell structure makes the QDs robust against photobleaching, previous studies have shown that the luminescence of photostable QDs can still be affected by environmental parameters such as pH16,17, temperature18–20, and electric field21, making them promising candidates for sensor applications. A considerable body of information has been published on the characteristics of semiconductor nanocrystals in solutions, but very few systematic investigations of the photophysical properties of QDs in biological systems have been undertaken. Our characterization of the pH sensitivity of QD photoluminescence in living cells shows how nanometer-sized QDs might be utilized as intracellular sensors in living cells.
MATERIALS AND METHODS
Synthesis of CdSe/ZnSe/ZnS Quantum Dots
To synthesize CdSe/ZnSe/ZnS nanocrystals we use a modified one-pot method22, with a CdO:Se molar ratio of 1:5 for the core reaction. CdO is dissolved in a hot coordinating solvent mixture of tri-n-octylphosphine oxide (TOPO) and hexadecylamine (HDA) to form a CdO-HDA complex, indicated by a color change from red to colorless. (25.6 mg CdO is added to 3.88 g TOPO plus 3.88 g HDA, and the mixture is heated to 320 °C with stirring until the color changes). Se powder dissolved in tributylphosphine (TBP) (79.0 mg Se in 1 mL TBP) is injected rapidly (within 2 s) into the CdO-HDA solution with vigorous stirring. CdSe nanocrystals are grown for 5 min at 280 °C after mixing. To form a ZnSe/ZnS shell on the CdSe core, the solution is cooled to 200 °C and a ZnSe shell solution (0.05 mL diethyl zinc, 15.8 mg Se, 1.0 mL TBP) is injected slowly over a 10 min period. Then the temperature is reduced to 160 °C, and a ZnS shell solution (0.1 mL diethyl zinc, 0.1 mL hexamethyldisilathiane, and 1 mL TBP) is injected slowly over 10 min. The CdSe/ZnSe/ZnS nanocrystal mixture is then annealed for 1–2 hr at 110 °C. After annealing, the solution is cooled to 70 °C and anhydrous methanol is added to precipitate the nanocrystals, which are collected by centrifugation and dispersed in anhydrous toluene or chloroform. The entire process is carried out in a dry nitrogen atmosphere. All reagents are from Sigma-Aldrich (St. Louis, MO, USA) without further purification.
Solubilization of CdSe/ZnSe/ZnS QDs
QDs are made water-soluble by capping them with MAA23. A colloidal suspension of CdSe/ZnSe/ZnS nanocrystals in chloroform is stirred with MAA for 2 hr at room temperature, after which phosphate-buffered saline (PBS) solution (pH 7.4) is added at a 1:1 volume ratio. During vigorous mixing, the chloroform and water phase separate spontaneously. The aqueous phase containing MAA-capped QDs is extracted, and excess MAA is removed by three rounds of centrifugation at 10,000 g for 10 min. The absorption and emission spectra are shown in supporting information, figure S1. The emission peak is at 595 nm with about 32 nm FWHM (full width at half maximum). The MAA-capped QD were incubated in buffers at different pH values for 2 hr, after which photoluminescence (PL) spectra were obtained with a spectrofluorometer-spectrophotometer (SpectraMax M2, Molecular Devices Corp., Sunnyvale, CA, USA) with excitation wavelength 400 nm, scanning step 1 nm.
QD uptake by SKOV-3 human ovarian cancer cells
Human ovarian cancer cells (SKOV-3, ATCC HTB-77) were grown in RPMI 1640 (Irvine Scientific, Santa Ana, CA, USA) containing 10% heat-inactivated fetal bovine serum (Irvine Scientific), 2 mM L-glutamine (Gibco-BRL, Grand Island, NY, USA), 50 units/mL penicillin (Gibco-BRL), and 50 μg/mL streptomycin in a humidified, 5% carbon dioxide atmosphere. Cells were sub-cultured for 24 hours before experiments to produce a concentration just below confluence. QDs (50 μL at 3 mg/mL) were added to RPMI 1640 over cells (200 μL, approximately 1×10⁵ in total). Before fluorescence observations, cells were washed with PBS three times. For cell fixation, SKOV-3 cells (grown in coverglass chambers) were rinsed three times with PBS, then immersed in 4% formaldehyde buffer (37% formaldehyde diluted with PBS) at room temperature for 20 min, and finally washed three times with PBS. Fixed cells were dried gently with compressed air.
Intracellular pH modification with chloroquine
For the experiments on the effect of intracellular pH, 2 mg/mL FITC-dextran (fluorescein isothiocyanate–dextran, Sigma-Aldrich; dextran molecular weight is 10,000 Da) and MAA-capped QD were added to two separate sets of cells. The mixtures were incubated overnight before imaging. Cells were washed gently several times with PBS to remove FITC-dextran and MAA-capped QDs. Fluorescence and bright-field images were taken before and after chloroquine treatment. Chloroquine (Sigma-Aldrich, St. Louis, MO, USA) was first dissolved in DMSO at 100 mM, then diluted to 200 μM in PBS for the 30 min cell treatment. A Zeiss Axiovert 200 M fluorescence microscope (Carl Zeiss MicroImaging, Inc., Thornwood, NY, USA) equipped with AxioCam MRm camera was used for fluorescence imaging. Filter sets for MAA-capped QD and FITC-dextran are 425 nm excitation, 580 nm long pass emission, and 480 nm excitation, 540 nm emission, respectively.
QD charge characterization by gel electrophoresis
Gel electrophoresis (Mini-Sub Cell GT gel electrophoresis system, BioRad, Hercules, CA, USA) was employed to investigate the effect of pH on the electrophoretic mobility of MAA QDs. Lambda DNA/Hind III markers (Promega, Madison, WI, USA) were used as references. 1% agarose gels (EM Science, Gibbstown, NJ, USA) containing 0.5 μg/mL ethidium bromide (Shelton Scientific Inc., Shelton, CT, USA) were cast in buffer at pH 8.1 (50 mM TAE), 6.8 (10 mM MES), and 5.5 (10 mM MES). The pH of the MES buffer was adjusted with NaOH. 20 μL QD solution (10 mg/mL) and 12 μL DNA marker solution were placed in the loading wells near the cathode. Gels were run at 110 V for 40–50 min. Images were recorded with a BioDoc-It Imaging System (Model M-26, UVP Cambridge, UK).
RESULTS AND DISCUSSION
Effects of pH on MAA QD photoluminescence
For the efficient and reliable utilization of semiconductor nanocrystal technology in biology and medicine, it is important to understand the factors that affect the optical properties of QDs. Photoluminescence variation in MAA-capped CdTe nanocrystals in a variety of commonly used biological buffers have been reported24. For quantum dots passivated with an inorganic capping layer, the QD core is often assumed to be isolated from the outside environment5,6,25, leading to the expectation that the QD photoluminescence should not be affected by external factors. As Figure 1A shows, however, MAA-capped core/shell/shell QDs are highly sensitive to pH, with greater fluorescence at higher pH, and a small red shift in the peak emission with increasing pH. This increase of fluorescence intensity with increasing pH has also been reported for CdSe/ZnS QDs16. The integrated spectral intensity, obtained by summing the area below the curve at each pH in figure 1A, is plotted in figure 1B to show the monotonic increase of fluorescence with pH.
Figure 1.

Effect of pH on the photoluminescence of MAA-capped CdSe/ZnSe/ZnS quantum dots in aqueous solution. (A) The fluorescence spectra of QDs in aqueous solutions at different pH values. (B) The integrated fluorescence emission increases monotonically with pH. The spectra are measured in aqueous solutions and the excitation wavelength used is 400 nm.
Effect of pH on the optical properties of QDs in fixed cells
These pH sensitive QDs can be taken up by SKOV-3 ovarian cancer cells through endocytosis (figure S2 in supporting information). We first noticed in our previous study26 that the fluorescence of endocytosed MAA QDs is affected by the intracellular environment and pH seemed to be playing an important role. In order to further explore the effect of pH on the fluorescence of QDs in fixed cells, SKOV-3 ovarian cancer cells containing MAA QDs were fixed with formaldehyde and then mixed with 150 mM phosphate buffer solutions (combinations of monosodium phosphate and disodium phosphate in water) adjusted to specific pH values by adding 0.1 M NaOH and 0.1 N HCl dropwise to obtain the desired pH ± 0.1. Fluorescence images of the dried fixed cells taken before adding buffer are shown in the top row in figure 2A. The corresponding images in the bottom row of figure 2A were captured 30 seconds after adding buffer to change the pH. The images in figure 2A, which are representative of all of the cells that we observed, demonstrate qualitatively the pH sensitivity of MAA QDs in cells. The fluorescence intensity decreases after adding pH 4 buffer and increases after adding pH 10 buffer, consistent with the observations in figure 1. Quantitatively, the fluorescence emission increases approximately linearly over the range pH 4 to pH 8, with a greater enhancement at higher pH values (figure 2B). Previous studies26,27 have shown QDs fluorescence intensity enhanced due to light irradiation, so we control the same exposure time in each image in order to see the emission intensity variation caused only by the pH effect.
Figure 2.

Effect of pH on the photoluminescence of MAA-capped CdSe/ZnSe/ZnS quantum dots in fixed SKOV-3 ovarian cancer cells. (A) Representative fluorescence images of QD in fixed SKOV-3 ovarian cancer cells. The three images in the top row are taken before adding the pH buffer. The bottom row shows the images taken 30 s after adding buffer. I0 and I are the photometrically integrated fluorescence intensity of QD before and after adding the phosphate buffer for pH modification, respectively. All fluorescence images were taken with the same exposure time. White arrows highlight the regions where fluorescence appears to change. (B) Relative fluorescence intensity (I/I0) taken from the images in (A). About 100 regions of interests, each of area around 4 μm2, were selected for the calculation of I/I0. Error bar: ±1 standard deviation of mean.
QD photoluminescence in living cells
Because pH is a fundamental parameter in biological systems — the production of ATP, for example, the energy currency of the cell, is driven by a proton gradient28 — a photostable pH probe with nanometer-scale physical dimensions that is compatible with living cells would be potentially valuable for studies of localized pH variations over time. To evaluate the suitability of MAA QDs as intracellular pH sensors, we incorporated them into living cells and examined the effects of pH. We used chloroquine, a weakly basic amine that tends to concentrate in the lysosomes of living cells, to modify intracellular pH. Chloroquine penetrates acidic intracellular compartments, such as lysosomes and the Golgi complex, and accumulates there in a protonated form, resulting in an increase in the intravesicular pH29–33. Figure 3C shows the increase in intracellular QD fluorescence after 30 minutes of chloroquine treatment. Before the chloroquine is added the low pH of the endosomes in which the QDs are localized reduces their fluorescence. The chloroquine-induced rise in the endosomal pH reduces the quenching of the QD fluorescence, consistent with the data presented in figure 1. Control cells over the same period of time without chloroquine show no significant change in QD fluorescence (figure 3B compared to 3A). The quantative results in figure 3D show that QD fluorescence intensity increases by around two-fold after a chloroquine-induced increase in intracellular pH.
Figure 3.

Representative photomicrographic images of MAA-capped CdSe/ZnSe/ZnS quantum dots in living SKOV-3 ovarian cancer cells. QD fluorescence intensity increases by around two-fold after a chloroquine-induced increase in intracellular pH. (A) MAA-capped QDs in SKOV-3 ovarian cancer cells after 24 h of incubation and washing with PBS. (B) The control cells were imaged 30 min later without chloroquine treatment. (C) Increased QD fluorescence 30 minutes after adding 200 μM chloroquine. The top row are fluorescence images, and the bottom row are overlay fluorescence and bright-filed images. All fluorescence images were captured with the same exposure time. (D) Integrated intensity for (A) to (C). About 100 regions of interests, each of area around 4 μm2, were selected from about 60 cells for the integration. Error bar: ±1 standard deviation of mean.
The pH sensitivity of another fluorochrome, fluorescein isothiocyanate-labeled dextran (FITC-dextran), is well characterized. The increase of fluorescein fluorescence with increasing pH has been utilized to measure intracellular pH34–36, and a quantitative ratiometric method for measuring pH in the lysosomes of living cells (using endocytosed FITC-dextran emission with 495 nm and 450 nm excitation) has been described37. Fluorescein also accumulates in lysosomes after incorporation into cells through endocytosis. We used this traditional pH probe as an independent check on the effect of chloroquine on intracellular pH in our system. Figure 4 shows that chloroquine causes an increase in the fluorescence of intracellular FITC-dextran, just as we observed with MAA QDs, confirming the pH-reporting capability of these nanoparticles. Although the effect of pH on MAA QD fluorescence intensity has been established, further studies, including characterization of this pH effect at the level of individual organelles and clarification of the role of photoactivation, will be required before the utility of QDs as practical intracellular pH sensors can be established.
Figure 4.

Representative photomicrographic images of FITC-dextran in living SKOV-3 ovarian cancer cells. FITC-dextran fluorescence intensity increases by around three to four-fold after a chloroquine-induced increase in intracellular pH. (A) A traditional pH indicator, FITC-dextran was incubated with SKOV-3 ovarian cancer cells for 24 h. Cells were washed with PBS before imaging. (B) The control cells were imaged 30 min later without chloroquine treatment. (C) Increased FITC fluorescence 30 minutes after adding 200 μM chloroquine. The top row are fluorescence images, and the bottom row are overlay fluorescence and bright-filed images. All fluorescence images were captured with the same exposure time. (D) Integrated intensity for (A) to (C). About 100 regions of interests, each of area around 4 μm2, were selected from about 60 cells for the integration. Error bar: ±1 standard deviation of mean.
Effect of surface charges on QD photoluminescence
The sensitivity of the QDs to the environment in this study arises in part from the small capping ligand (in contrast to the QDs capped with polymers38 and cross link with lysine39), MAA, which contributes significantly to the surface chemistry and physical characteristics, including the surface charge, of the semiconductor nanocrystal. We used agarose gel electrophoresis to investigate the effect of pH on the surface charge of MAA QDs. At neutral pH MAA-capped QDs have negative carboxyl groups on the surface (from the MAA) and therefore migrate toward the positive electrode. Since the pore size of agarose gels changes with pH, we used lambda DNA/Hind III markers as migration velocity references. As shown in figure 5, the migration velocities of QDs at pH 8.1, pH 6.8, and pH 5.5 correspond to those of DNA around 600 bp, 2000 bp, and 2400 bp, respectively. QDs in pH 8.1 buffer migrate faster than those in pH 5.5 and 6.8, indicating that QDs have higher charges and/or smaller size at higher pH (electrophoretic mobility is proportional to the charge and inversely proportional to the size). pH-dependent migration velocities have also been reported for mercaptopropionic acid (MPA)-capped CdSe/ZnS QDs and silica-coated CdSe/ZnS QDs40. In addition, we observed that most QDs at pH 5.5 remain at the loading position on the gel and do not migrate. We interpret this to mean that some fraction of the MAA dissociates from the nanoparticle surface at low pH41, resulting in a lower surface charge, and that the uncapped QDs aggregate and become insoluble. Some of the low pH quenching of MAA-capped QD fluorescence that we observe may result from a loss of ligand protection and direct exposure of the semiconductor nanocrystal surface to the solution. Due to the small size of the nanocrystals, the wave functions of the electron and the hole cover the whole volume of the nanoparticles and extend to the surface. Thus the increased contact between the nanocrystal surface and the solution, which is a reservoir to the excited electrons from the nanocrystal, leads to higher nonradiative relaxation rate at the surfaces of MAA QDs and the reduced photoluminescence intensity at lower pH42. Still some, especially at lower pH values, may result from self-quenching and other phenomena associated with aggregation of the nanoparticles.
Figure 5.
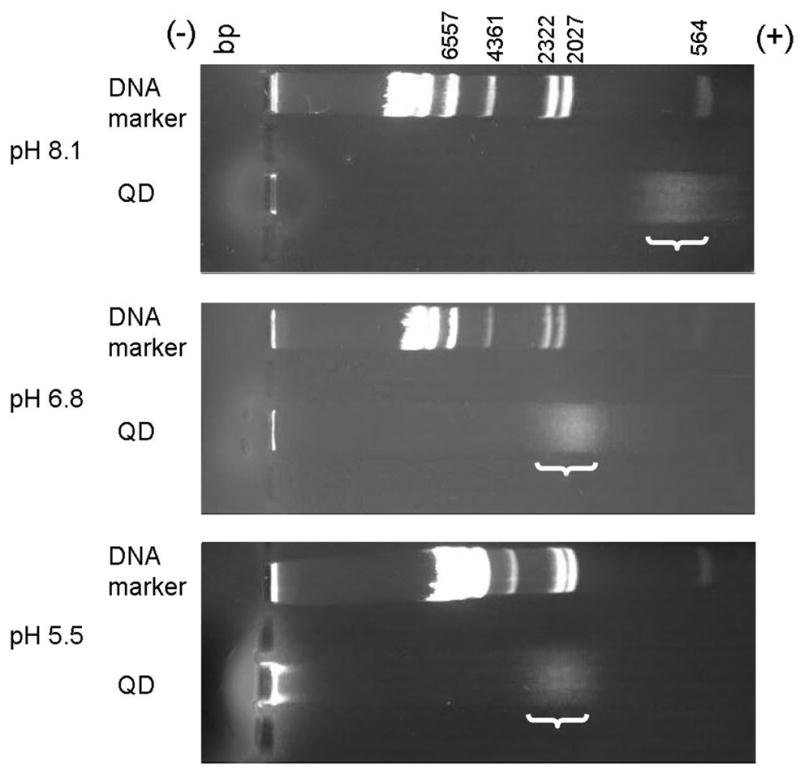
Gel electrophoresis of MAA-capped QDs and lambda DNA/Hind III markers at alkaline, neutral, and acid pH. DNA markers are references for comparing results in different gels. Negatively charged QDs migrate further from the cathode in higher pH. In alkaline conditions (10 mM TAE buffer, pH 8.1), the migration velocity of QDs is similar to that of DNA with ~600 bp (40 min). At neutral pH (10 mM MES buffer, pH 6.8), QDs migrate at approximately the rate of the ~2000 bp marker DNA (50 min). In acidic conditions (10 mM MES buffer, pH 5.5), QDs migrate with ~2400 bp DNA (50 min). The brackets indicate the position of the diffuse QD bands. The contrasts of the images are enhanced for better visibility.
CONCLUSION
The photoluminescence of MAA-capped CdSe/ZnSe/ZnS QDs exhibits a marked pH dependence in buffer suspensions and in living SKOV-3 human ovarian cancer cells. The fluorescence emission of MAA-capped QDs is quenched in acidic environments in vitro and in both fixed and living cells. Increases in intracellular pH lead to enhanced QD fluorescence intensity. The fluorescence of an MAA-capped QD solution increases by around five-fold when the pH changes from 4 to 10. Internalized QDs within fixed cells show a similar pH-dependent fluorescence, with ten-fold enhancement over the same pH range. In living cells, the fluorescence of MAA-capped QDs intensifies when cellular vesicles become more basic, in a manner similar to that observed with the traditional cellular pH probe — FITC-dextran. The resistance of QDs to photobleaching (figure S3 in supporting information), combined with surface modifications that render them sensitive to environmental conditions, enable long-term cell tracking and monitoring of the intracellular environment, pointing to the potential for developing a class of nanoscale, photostable, intracellular sensors for not only protons (pH) but also for other ionic species and for temperature and electric field.
Supplementary Material
Acknowledgments
This work was supported by grants from the Air Force Office of Scientific Research and the National Institutes of Health.
References
- 1.Liu JW, Lu Y. J Am Chem Soc. 2003;125:6642–6643. doi: 10.1021/ja034775u. [DOI] [PubMed] [Google Scholar]
- 2.Diéguez A, Romano-Rodriguez A, Morante JR, Kappler J, Bârsan N, Göpel W. Sensors and Actuators B. 1999;60:125–137. [Google Scholar]
- 3.Liang JG, Ai XP, He ZK, Pang DW. Analyst. 2004;129:619–622. doi: 10.1039/b317044f. [DOI] [PubMed] [Google Scholar]
- 4.Mekis I, Talapin DV, Kornowski A, Haase M, Weller H. J Phys Chem B. 2003;107:7454–7462. [Google Scholar]
- 5.Dabbousi BO, Rodriguez-Viejo J, Mikulec FV, Heine JR, Mattoussi H, Ober R, Jensen KF, Bawendi MG. J Phys Chem B. 1997;101:9463–9475. [Google Scholar]
- 6.Hines MA, Guyot-Sionnest P. J Phys Chem. 1996;100:468–471. [Google Scholar]
- 7.Peng XG, Schlamp MC, Kadavanich AV, Alivisatos AP. J Am Chem Soc. 1997;119:7019–7029. [Google Scholar]
- 8.Li JJ, Wang YA, Guo WZ, Keay JC, Mishima TD, Johnson MB, Peng XG. J Am Chem Soc. 2003;125:12567–12575. doi: 10.1021/ja0363563. [DOI] [PubMed] [Google Scholar]
- 9.Talapin DV, Koeppe R, Gotzinger S, Kornowski A, Lupton JM, Rogach AL, Benson O, Feldmann J, Weller H. Nano Lett. 2003;3:1677–1681. [Google Scholar]
- 10.Reiss P, Bleuse J, Pron A. Nano Lett. 2002;2:781–784. [Google Scholar]
- 11.Reiss P, Carayon S, Bleuse J, Pron A. Synth Met. 2003;139:649–652. [Google Scholar]
- 12.Talapin DV, Mekis I, Gotzinger S, Kornowski A, Benson O, Weller H. J Phys Chem. 2004;108:18826–18831. [Google Scholar]
- 13.Baranov AV, Rakovich YP, Donegan JF, Perova TS, Moore RA, Talapin DV, Rogach AL, Masumoto Y, Nabiev I. Phys Rev B. 2003;68:165306. [Google Scholar]
- 14.Cheng CT, Chen CY, Lai CW, Liu WH, Pu SC, Chou PT, Chou YH, Chiu HT. J Mater Chem. 2005;15:3409–3414. [Google Scholar]
- 15.Chen CY, Cheng CT, Lai CW, Hu YH, Chou PT, Chou YH, Chiu HT. Small. 2005;1:1215–1220. doi: 10.1002/smll.200500227. [DOI] [PubMed] [Google Scholar]
- 16.Gao XH, Chan WCW, Nie SM. Journal of Biomedical Optics. 2002;7:532–537. doi: 10.1117/1.1506706. [DOI] [PubMed] [Google Scholar]
- 17.Tomasulo M, Yildiz I, Raymo FM. J Phys Chem B. 2006;110:3853–3855. doi: 10.1021/jp060185h. [DOI] [PubMed] [Google Scholar]
- 18.Biju V, Makita Y, Sonoda A, Yokoyama H, Baba Y, Ishikawa M. J Phys Chem B. 2005;109:13899–13905. doi: 10.1021/jp050424l. [DOI] [PubMed] [Google Scholar]
- 19.Walker GW, Sundar VC, Rudzinski CM, Wun AW, Bawendi MG, Nocera DG. Appl Phys Lett. 2003;83:3555–3557. [Google Scholar]
- 20.Wuister SF, van Houselt A, Donegá CDM, Vanmaekelbergh D, Meijerink A. Angew Chem Int Ed. 2004;43:3029–3033. doi: 10.1002/anie.200353532. [DOI] [PubMed] [Google Scholar]
- 21.Müller J, Lupton JM, Lagoudakis PG, Schindler F, Koeppe R, Rogach AL, Feldmann J, Talapin DV, Weller H. Nano Lett. 2005;5:2044–2049. doi: 10.1021/nl051596x. [DOI] [PubMed] [Google Scholar]
- 22.Huang GW, Chen CY, Wu KC, Ahmed MO, Chou PT. Journal of Crystal Growth. 2004;265:250–259. [Google Scholar]
- 23.Chan WCW, Nie SM. Science. 1998;281:2016–2018. doi: 10.1126/science.281.5385.2016. [DOI] [PubMed] [Google Scholar]
- 24.Boldt K, Bruns OT, Gaponik N, Eychmuller A. J Phys Chem B. 2006;110:1959–1963. doi: 10.1021/jp056371p. [DOI] [PubMed] [Google Scholar]
- 25.Murray CB, Norris DJ, Bawendi MG. J Am Chem Soc. 1993;115:8706–8715. [Google Scholar]
- 26.Sun YH, Liu YS, Vernier PT, Liang CH, Chong SY, Marcu L, Gundersen MA. Nanotechnology. 2006;17:4469–4476. [Google Scholar]
- 27.Kloepfer JA, Bradforth SE, Nadeau JL. J Phys Chem B. 2005;109:9996–10003. doi: 10.1021/jp044581g. [DOI] [PubMed] [Google Scholar]
- 28.Lodish H, Berk A, Matsudaira P, Kaiser CA, Krieger M, Scott MP, Zipursky L, Darnell J. Molecular cell biology. W. H. Freeman and company; New York, USA: 2003. [Google Scholar]
- 29.Oda K, Koriyama Y, Yamada E, Ikehara Y. Biochem J. 1986;240:739–745. doi: 10.1042/bj2400739. [DOI] [PMC free article] [PubMed] [Google Scholar]
- 30.Oda K, Ikehara Y. Eur J Biochem. 1985;152:605–609. doi: 10.1111/j.1432-1033.1985.tb09238.x. [DOI] [PubMed] [Google Scholar]
- 31.Strous GJ, DuMaine A, Zijderhand-Bleekemolen JE, Slot JW, Schwartz AL. J Cell Biol. 1985;101:531–539. doi: 10.1083/jcb.101.2.531. [DOI] [PMC free article] [PubMed] [Google Scholar]
- 32.Maxfield FR. J Cell Biol. 1982;95:676–681. doi: 10.1083/jcb.95.2.676. [DOI] [PMC free article] [PubMed] [Google Scholar]
- 33.Caplan MJ, Stow JL, Newman AP, Madri J, Anderson HC, Farquhar MG, Palade GE, Jamieson JD. Nature. 1987;329:632–635. doi: 10.1038/329632a0. [DOI] [PubMed] [Google Scholar]
- 34.Thomas JA, Buchsbaum RN, Zimniak A, Racker E. Biochemistry. 1979;18:2210–2218. doi: 10.1021/bi00578a012. [DOI] [PubMed] [Google Scholar]
- 35.Visser JWM, Jongeling AAM, Tanke HJ. J Histochem Cytochem. 1979;27:32–35. doi: 10.1177/27.1.35567. [DOI] [PubMed] [Google Scholar]
- 36.Heiple JM, Taylor DL. J Cell Biol. 1980;86:885–890. doi: 10.1083/jcb.86.3.885. [DOI] [PMC free article] [PubMed] [Google Scholar]
- 37.Ohkuma S, Poole B. Proc Natl Acad Sci USA. 1978;75:3327–3331. doi: 10.1073/pnas.75.7.3327. [DOI] [PMC free article] [PubMed] [Google Scholar]
- 38.Gao XH, Cui YY, Levenson RM, Chung LWK, Nie SM. Nat Biotechnol. 2004;22:969–976. doi: 10.1038/nbt994. [DOI] [PubMed] [Google Scholar]
- 39.Jiang W, Mardyani S, Fischer H, Chan WCW. Chem Mater. 2006;18:872–878. [Google Scholar]
- 40.Gerion D, Pinaud F, Williams SC, Parak WJ, Zanchet D, Weiss S, Alivisatos AP. J Phys Chem B. 2001;105:8861–8871. [Google Scholar]
- 41.Aldana J, Lavelle N, Wang YJ, Peng XG. J Am Chem Soc. 2005;127:2496–2504. doi: 10.1021/ja047000+. [DOI] [PubMed] [Google Scholar]
- 42.Stroyuk AL, Kryukov AI, Kuchmii SY, Pokhodenko VD. Theoretical and Experimental Chemistry. 2005;41:67–91. [Google Scholar]
Associated Data
This section collects any data citations, data availability statements, or supplementary materials included in this article.