

Abstract
The gaze movements accompanying target localization were examined via human observers and a computational model (Target Acquisition Model, TAM). Search contexts ranged from fully realistic scenes, to toys in a crib, to Os and Qs, and manipulations included set size, target eccentricity, and target-distractor similarity. Observers and the model always previewed the same targets and searched the identical displays. Behavioral and simulated eye movements were analyzed for acquisition accuracy, efficiency, and target guidance. TAM's behavior generally fell within the behavioral mean's 95% confidence interval for all measures in each experiment/condition. This agreement suggests that a fixed-parameter model using spatio-chromatic filters and a simulated retina, when driven by the correct visual routines, can be a good general purpose predictor of human target acquisition behavior.
Keywords: Overt visual search, computational models, saccade target selection, population coding, center-of-gravity fixations
1 Introduction
A promissory note is coming due for the visual search community. For decades researchers have relied on manual button press responses and relatively simple displays to build models of search, with the promise that these models would one day generalize to more naturalistic search situations. These efforts have yielded a wealth of basic information, making search one of the best understood behaviors in all of visual cognition. However, these methodological choices have also served to limit the types of tasks explored by the search community. Visual search is much more than the time needed to press a button in response to a red vertical bar. Rather, it is “how we look for things”, a reply that most people would provide when asked about this behavior. A great deal can be learned from this folk psychological definition. It reminds us that search is active, a visual and motor interaction with the world characterized by the convergence of gaze towards a target, with each eye movement changing slightly the visual information used by the search process. It also reminds us that models of search must be general, as the “things” that we search for are not often red vertical bars, but rather cups or people or road signs.
In this article I attempt one payment on this theoretical debt. I do this by characterizing eye movement behavior across a range of search tasks, including the acquisition of targets in realistic scenes, and by developing a model that inputs the identical stimuli shown to human observers, and outputs for each trial a sequence of simulated eye movements that align gaze with the target. Finding good agreement between this simulated and human gaze behavior would suggest a computationally explicit understanding of overt search at the level of relatively stimulus non-specific processes. Of course this goal presumes that it is useful to have a general purpose model of search and to understand this behavior in terms of eye movements. These topics will be considered briefly in the following sections.
1.1 Defining search in terms of eye movements
This article addresses the use of eye movements to acquire specific search targets, with an emphasis on the computational underpinnings of this behavior. Given this focus on overt search, purely attentional contributions to search will not be considered in depth. This includes the excellent recent work showing the involvement of attention mechanisms during search tasks (e.g., Bichot, Rossi, & Desimone, 2005; Chelazzi, Miller, Duncan, & Desimone, 2001; Yeshurun & Carrasco, 1998; see Reynolds & Chelazzi, 2004, for a review). By neglecting this work my intention is not to suggest that attention plays an unimportant role in search, but rather that these processes and mechanisms are outside of the scope of the proposed model (see Section 8.3 for additional discussion of this topic). However, there is one aspect of attention that must be discussed in the current context, and that is the fact that attention can shift without an accompanying movement of gaze (e.g., Klein, 1980; Klein & Farrell, 1989; Murthy, Thompson, & Schall, 2001; Posner, 1980). Given the potential for purely covert shifts of attention, why is it useful to understand where people move their eyes as they search? There are several reasons.
First, eye movements can be used to study how attention is allocated during search. Although the reason for their alignment can be debated (e.g., Deubel & Schneider, 1996; Findlay, 2005; Klein, 1980; Klein & Pontefract, 1994), overt and covert search movements, when they co-occur, are likely in close spatial register. This is supported by studies showing that attention is directed to a location in preparation for a saccade to that location (e.g., Deubel & Schneider, 1996; Henderson, 1993; Henderson, Pollatsek, & Rayner, 1989; Hodgson & Müller, 1995; Hoffman & Subramaniam, 1995; Irwin & Gordon, 1998; Irwin & Zelinsky, 2002; Kowler, Anderson, Dosher, & Blaser, 1995; Kustov & Robinson, 1996; Rayner, McConkie, & Ehrlich, 1978; Sheliga, Riggio, & Rizzolatti, 1994; Shepherd, Findlay, & Hockey, 1986; see Findlay & Gilchrist, 2003, and Hoffman, 1998, for reviews), and that manual search measures correlate highly with the number (and distribution) of gaze fixations occurring during search (Behrmann, Watt, Black, & Barton, 1997; Bertera & Rayner, 2000; Williams, Reingold, Moscovitch, & Behrmann, 1997; Zelinsky & Sheinberg, 1995, 1997). These relationships between overt and covert search suggest that gaze fixations can be used to sample the attentive search process, pinpointing this covert process to specific locations at specific times. If locations x, y, and z were fixated in a search scene, one can be reasonably confident that attention visited these locations as well. And even if one assumes an attention sampling frequency greater than our capacity to shift gaze, as suggested by high-speed serial search models (e.g., Treisman & Gelade, 1980; Horowitz & Wolfe, 2003; Wolfe, 1994; Wolfe, Alvarez, & Horowitz, 2000; but see Findlay, 2004, Motter & Holsapple, 2007, Sperling & Weichselgartner, 1995, and Ward, Duncan, & Shapiro, 1996), the 5 or so gaze-based samples of attention each second might still provide a reasonable estimate of the scanpath traversed by covert search (e.g., Zelinsky, Rao, Hayhoe, & Ballard, 1997).
A second reason for studying eye movements during search is related to the first; eye movements are directly observable, movements of attention are not. Allocations of gaze during search can be monitored and quantified with a fair degree of precision using an eye tracker. The same cannot be said about attention. Unlike eye movements, there is as yet no machine that can track the individual movements of attention during search (although see Brefczynski & DeYoe, 1999, for work that is heading in this direction). Instead, the many covert search movements assumed by high-speed serial models must be inferred from manual reaction times (RTs), making their distribution, and even existence, necessarily more speculative. A manual RT also provides no explicit spatial measure of search, and only a single temporal measure marking the completion of the search process. By failing to capture search as it unfolds, RTs arguably discard the most interesting aspects of search behavior. In contrast, the saccades and fixations accompanying search provide a comparatively rich source of information about the spatio-temporal evolution of the search process. And if oculomotor behavior (fixations and saccades) is measured from the onset of the search display until the button press search response, no information is lost relative to a manual RT measure. The RT is simply redefined in terms of a sequence of fixation durations (Zelinsky & Sheinberg, 1995, 1997), meaning that even if an eye movement does not occur on a particular trial, that trial would still have a single fixation duration equal to the RT. The advantages of supplementing a RT measure of search with oculomotor measures are therefore many, with no meaningful costs.
Third, the rich and directly observable oculomotor record makes for a very challenging test of a search theory. The potential for eye movements to inform search theory has not gone unnoticed, with several predominantly covert theories of search also making implicit (Itti & Koch, 2000; Koch & Ullman, 1985; Olshausen, Anderson, & van Essen, 1993; Wolfe, 1994), and occasionally explicit (Tsotsos et al., 1995; Wolfe & Gancarz, 1996) claims that overt eye movement behavior will follow naturally from hypothesized covert search dynamics. Although few theoretical treatments have systematically compared simulated search behavior to human eye movements (see Rao, Zelinsky, Hayhoe, & Ballard, 1996, 2002, and Navalpakkam & Itti, 2005, for exceptions), there is good reason why this should become common practice. Manual dependent measures do not adequately constrain search theory, as best exemplified by the co-existence of serial search models (Treisman & Sato, 1990; Wolfe, 1994, 1998a) and signal detection approaches (Eckstein, 1998; Palmer, 1994, 1995; Shaw, 1982; Swensson & Judy, 1981; see also Townsend, 1976, 1990) as explanations for the same patterns of RT × set size functions. Such theoretical debates exist, in part, because the RT dependent measure lacks the resolution to tease apart conflicting perspectives. By enriching a data set with eye movement measures, such theoretical debate can be lessened, as it would be very unlikely that two fundamentally different theories can explain a rich data set equally well. In general, the fixation-by-fixation movements of gaze impose considerable constraints on any search theory, and any theory would be strengthened in proportion to its ability to capture these spatio-temporal search dynamics.
Fourth, unless instructed otherwise people overwhelmingly elect to move their eyes as they search, and these behaviors deserve a theoretical explanation. At about 3-5 each second, saccadic eye movements are our most frequently occurring observable behaviors, and many of these behaviors are made in the service of visual search (for early observations, see Engel, 1977; Gould, 1973; and Williams, 1966; for reviews, see Findlay & Gilchrist, 2003; Rayner, 1978, 1998; and Viviani, 1990). Yet despite its prevalence in many of our daily activities, few theories have been devoted specifically to explaining overt search behavior (see Eckstein et al., 2007; Eckstein, Drescher, & Shimozaki, 2006; Geisler and Chou, 1995; Geisler, Perry, & Najemnik, 2006; Najemnik & Geisler, 2005, for recent exceptions). Rather, there is a tradition of treating overt search as a less interesting cousin of covert search, and of subsuming the discussion of this topic under covert search theory. The rationale for this thinking again has its roots in the high-speed serial attention model. Although eye movements and covert search movements are highly correlated, the overt movement, because it has an actual motor component, is slower and therefore lags behind the faster covert movement. According to this perspective, if it were possible to speed up the frequency of eye movements, overt and covert movements would visit the same display locations during search. This premise of the high-speed search model should be treated with skepticism, for two reasons. First, search with eye movements is not the same as search without eye movements. Eye movements can both facilitate search by removing peripheral acuity limitations (Geisler and Chou, 1995), as well as occasionally decrease search efficiency through the introduction of strategic biases (Zelinsky, 1996; Zelinsky & Sheinberg, 1997). Overt and covert search can therefore not be equated; searching with eye movements qualitatively changes the search dynamics. Second, there is growing reason to believe that oculomotor scanning, and not purely covert shifts of attention, may be the more natural search behavior during a free-viewing task (Findlay, 2004; Findlay & Gilchrist, 1998, 2001). Using a probabilistic model and a free viewing task, Motter and Holsapple (2007) recently demonstrated that covert shifts of attention occur too infrequently to dramatically affect search behavior. If true, this means that the role of covert scanning in search has been overestimated. Searches relying on purely covert shifts of attention may be the exceptions rather than the rule, with these exceptions limited to fairly unnatural search tasks when eye movement behavior is highly constrained.
1.2 Describing search in real-world contexts
The past decade has seen rapid growth in the number of studies using complex objects and scenes as stimuli, and this trend is likely to continue. Real-world stimuli have long been used to study memory and object recognition (e.g., Nickerson, 1965, 1968; Palmer, 1975; Shepard, 1967; Standing, 1973), and more recently have also appeared prominently in the visual perception and attention literatures (e.g., Rensink, O'Regan, & Clark, 1997; Simons & Levin, 1997, 1998; Thorpe, Fize, & Marlot, 1996; see also Buswell, 1935). If search is to remain an attractive topic of scientific enquiry, it too must evolve to accommodate complex and naturally occurring stimuli.
For the most part this has happened, with search studies now spanning a wide range of contexts from simple to complex. Simple search contexts are valuable in that they can reveal the visual features that are, and are not, preattentively available to the search process (e.g., Enns & Rensink, 1990, 1991; He & Nakayama, 1992; Julesz, 1981; Treisman & Gormican, 1988; for review, see Wolfe, 1998b), as well as those features that can be used to guide search to a designated target (e.g., Motter & Belky, 1998; Wolfe, Cave, & Franzel, 1989). To a large extent the search literature was conceived and nourished on simple stimuli, and the key role that they continue to play in understanding search behavior should not be underestimated. However, search targets can also be complex, and several studies have now used complex patterns as search stimuli, both in the context of object arrays (e.g., Biederman, Blickle, Teitelbaum, & Klatsky, 1988; Levin, 1996; Levin, Takarae, Miner, & Keil, 2001; Neider & Zelinsky, 2006a; Newell, Brown, & Findlay, 2004; Zelinsky, 1999) as well as targets embedded in simple and complex scenes (e.g., Aks & Enns, 1996; Biederman, Glass, & Stacy, 1973; Brockmole & Henderson, 2006; Henderson, Weeks, and Hollingworth, 1999; McCarley et al., 2004; Neider & Zelinsky, 2006b; Oliva, Wolfe, & Arsenio, 2004; Wolfe, Oliva, Horowitz, Butcher, & Bompas, 2002; Zelinsky, 2001; Zelinsky et al., 1997). This adoption of complex stimuli has fueled a new brand of image-based search theory (e.g., Itti & Koch, 2000; Navalpakkam & Itti, 2005; Oliva, Torralba, Castelhano, & Henderson, 2003; Parkhurst, Law, & Niebur, 2002; Pomplun, 2006; Rao et al., 2002; Torralba, Oliva, Castelhano, & Henderson, 2006; Zelinsky, 2005a; see Itti & Koch, 2001, for a review), but this theoretical development is still in its infancy. Consequently, many basic search questions, such as how search is guided to a complex target, are still not well understood.
Optimistically, one might think that issues of generalization from simple to complex search contexts are nothing more than a minor theoretical nuisance. Given that target guidance may rely on relatively basic features, it might not matter whether these features describe a simple object or a realistic scene. Indeed, this view is central to the “modal model” conception of search; complex patterns are decomposed into a set of feature primitives, then re-integrated or “bound” into objects following the application of covert processing. Simple and complex stimuli might therefore differ in terms of their feature compositions, but acting on these features would be the same underlying search processes. Less optimistically, the generalization from simple to complex search patterns might not be straightforward. Finding an unambiguous representation for a coffee cup target in a real-world context will likely require a feature space larger than what is normally assumed for colored-bar stimuli. Such increases in the dimensionality of a feature space can qualitatively change the way features are used by a system, making a complex pattern potentially more than just the sum of its parts (Kanerva, 1988). This qualitative change might arise due to capacity limits on visual working memory (Alvarez & Cavanagh, 2004; Luck & Vogel, 1997; Zelinsky & Loschky, 2005), or by differences in the coding of similarity relationships. For example, if complex objects were coded using only two dimensions (e.g., color and orientation), this dimensionality constraint would likely force subsets of these objects to have artificially high estimates of similarity, and other subsets to have inflated estimates of dissimilarity. However, if this representational constraint were lessened by coding two hundred dimensions rather than two, these same objects would likely have very different similarity relationships, with far fewer peaks and valleys. In some sense, this distinction between simple and complex search stimuli is analogous to the distinction between artificial (e.g., Bourne, 1970) and natural categories (e.g., Rosch, 1973) in the concept literature. Categories can be learned for a set of colored geometric objects, but different rules seem to apply when the category is squirrels, or vehicles, or chairs. Ultimately, the applicability of a search theory to realistic contexts must be demonstrated—it is not a foregone conclusion.
Complicating the extension of a search theory to realistic contexts is the selection of an appropriate representational space. The problem is that the dimensions of this space are largely unknown. Although most people would agree that a coffee cup consists of more visual features than a colored bar, it is not apparent what these features are. Once the obvious list of candidate features is exhausted, considerable disagreement will likely arise over what new feature dimensions to represent (Treisman & Gormican, 1988; Wolfe, 1998b). Restricting discussion to simple stimuli is one way of avoiding this problem. The features of a colored-oriented bar are readily apparent; if the bar is green and vertical then these features, and only these features, require coding. In other words, it is possible to hand pick the feature representation to match the stimuli. Extending this solution to real-world objects, however, is likely to be arbitrary and unsatisfying. Moreover, a model of search that uses hand picked features is necessarily more limited in the range of stimuli to which it can be applied. Models hard-wired to “see” letters (e.g., Humphreys & Müller, 1993) or oriented color bars (e.g., Wolfe, 1994) might therefore work well for letter or bar stimuli, but may fail utterly if given realistic objects or scenes.
A general search theory, meaning one able to work with arbitrary designations of targets and search contexts, should have at least three properties. First, it should be computationally explicit, and preferably implemented as a working model. When it comes to working with realistic stimuli, the devil is often in the details. One cannot be certain that a theory will generalize across contexts unless this generalization is actually demonstrated. Second, a model's operations should be relatively stimulus independent. If stimulus class A requires one set of parameters and stimulus class B requires another set, and these parameter settings must be supplied by a user, the search model cannot be described as general. Third, the model should be able to flexibly accommodate stimuli ranging in complexity from simple patterns to fully realistic scenes. One method of achieving such breadth is to represent search patterns using a featurally diverse repertoire of spatio-chromatic filters (e.g., Itti & Koch, 2000; Rao et al., 1996, 2002; Zelinsky, 2003). Similar filter-based techniques have been used with great success to describe early visual processing within the computational vision community (e.g., Daugman, 1980, Lades et al., 1993; Leung & Malik, 2001; Malik & Perona, 1990; Olshausen & Field, 1996; Rohaly, Ahumada, & Watson, 1997; see Landy & Movshon, 1991, for a review), and their inclusion in a search model would lend a measure of biological plausibility to the approach. By using a large number of such filters, each tuned to a specific chromatic and spatial property, a high-dimensional representation can be obtained that makes it unnecessary to hand pick features to match stimuli. A green vertical bar would generate responses in those parts of the feature vector coding for “green” and “vertical”, and a coffee cup would generate responses in whatever feature dimensions are specific to the coffee cup.
1.3 Overview
We should ask more of our search theories. Given the many ways that eye movement data can enrich descriptions of search behavior, theories should strive to predict where each eye movement will be directed in a scene, and the temporal order of these eye movements (where do searchers look first, second, etc.). In short, theories of search should also be theories of eye movements during search. Moreover, a theory should be able to make these predictions regardless of stimulus complexity, meaning that it should work with realistic objects and scenes as well as Os and Qs. Such a description of the eye movement behavior accompanying search would constitute an extremely rigorous test of a theory, perhaps unrealistically so. Still, theories should aspire towards meeting this standard, as even partial successes will help us to evaluate what we know, and do not yet know, about search.
The work described in this article will take a small first step towards meeting this rigorous theoretical challenge. The general approach is to have human and simulated searchers perform the same tasks and to “see” the same displays. Model testing will consist of comparing the simulated gaze behavior to the spatially and temporally exact eye position data from the behavioral experiments. For the reasons outlined in Sections 1.1 and 1.2, this effort will focus on how gaze becomes aligned with a designated target across a diverse range of tasks. Given this focus, two important dimensions of search behavior will not be addressed. First, a model describing the convergence of gaze on a target requires that a target be present; target absent behavior will therefore not be considered here. Second, although the model will reflect time in terms of a sequencing of eye movements, no attempt will be made to describe the durations of individual fixations or to estimate the search response time by summing these fixation durations. Correcting these omissions, a topic discussed more fully in Section 9, would require adding decision criteria and stopping rules to the model that do not yet exist. In the interest of keeping this initial version of the model relatively simple and focused on the model's spatial behavior, treatment of these topics will be deferred to a future study. To acknowledge this narrowed focus, I will henceforth refer to the behavior of this model as target acquisition, not search, with the term ‘acquisition’ here referring to the alignment of gaze with a target. Similarly, the task required of the human observers is best described as target localization, not target detection, although the two tasks are obviously related (Bundesen, 1991; Sagi & Julesz, 1985).
The organization of the article is as follows. Section 2 introduces the Target Acquisition Model (TAM), with more detailed information pertaining to TAM's representations and processes provided in individual subsections. The basic flow of processing in this model is shown in Figure 1. Generally, computational vision techniques are used to represent scenes in terms of simple and biologically-plausible visual feature-detector responses (e.g., colors, orientations, scales). Visual routines (e.g., Ullman, 1984; Hayhoe, 2000) then act on these representations to produce a sequence of simulated eye movements. Sections 3-7 describe five experiments comparing human and simulated target acquisition behavior across a range of tasks. Section 3 describes a task requiring the localization of a target in fully realistic scenes, and Section 4 describes a task using simpler scenes to test more specific predictions of the model. In Sections 5-7, experiments are described that use O and Q stimuli to evaluate TAM under more restrictive conditions, as well as to better relate its behavior to the basic search literature. These experiments include a test for set size effects (Section 5), a search asymmetry (Section 6), and an effect of target-distractor similarity (Section 7). A general discussion is provided in Section 8, in which broad implications for search and attention are discussed, and comparisons are made to specific search models. Section 9 discusses TAM's limitations, and the article ends with a brief conclusion in Section 10.
Figure 1.

The flow of processing through TAM. Dashed boxes indicate four key conceptual stages: target map creation, target detection, false target rejection, and eye movement generation. Rectangular symbols indicate computational processes, diamond symbols indicate decision processes, and oval symbols indicate processing input and termination. Note that separate inputs are not shown for the target and search images. Abbreviations: TM (Target Map), HS (Hotspot), DT (Detection Threshold), IM (Inhibition Map), CF (Current Fixation), FT (Fixation Threshold), PFP (Proposed Fixation Point), EMT (Eye Movement Threshold).
2 The Target Acquisition Model
This section introduces TAM and describes its representations and processes.1 As an overview, the spatial and temporal dynamics of eye movements during target acquisition are simulated using processes acting on map-based perceptual representations. Techniques borrowed from the image processing community are used to obtain a fixation-by-fixation retina transformation of the search image reflecting the visual acuity limitations at each gaze position. Other image processing techniques then represent these retina-transformed scenes as collections of responses from biologically plausible visual feature detectors. Following this feature decomposition stage, the target and scene representations are compared, with the product of this comparison being a map indicating the visual similarity between the target and each point in the search scene (the target map). A proposed location for an eye movement is then defined in scene space by taking the geometric average of the activity on this map. At any given moment in processing, the model therefore knows where it is currently fixated and where it would move its fixation, based on the averaging computation at that given moment. When the distance between these two coordinates reaches a critical threshold, an eye movement is made to the proposed location in the scene. A temporal dynamic is introduced by iteratively excluding activation values from the target map that offer below-threshold evidence for the target. As the activity on this map changes, so does the geometric average and the proposed fixation point. Eventually, perhaps after several eye movements, this process isolates the most active values on the target map. As this happens, the target's role in the averaging computation increases, resulting in the guidance of gaze towards the location of the suspected target. If the fixated pattern is determined not to be the target, this false target is inhibited and the cycle begins again with the selection of a new target candidate for inspection. Processing stops when the target match exceeds a high detection threshold, which often occurs only after the high-resolution simulated fovea becomes aligned with the actual target (i.e., the target is fixated).
From the above overview it is clear that processing in this model is a highly dynamic interaction between several intertwined representations and visual routines. However, what may have been less clear is that these representations depend, not only on the visual properties of each specific search scene and target, but also on the specific sequence in which the simulated fovea is repositioned within a scene. The retina transformation, by progressively blurring peripheral regions of the search image, will influence how well the target matches the scene. Only those matches arising from the foveally viewed region of the scene will have the potential to yield a good match to the target, other matches will be lessened in proportion to the peripheral degradation of the search image. Because the target map is a representation of these matches, the visual routines responsible for averaging and thresholding the target map will therefore be using retina-transformed information when determining the location of the next gaze shift, and this new gaze shift will result in a new retina-transformed view of the search image and ultimately a new map of activation values. Given these intertwined retina and activation constraints, even a small change in fixation position early in a trial might propagate through this dynamical system and produce a radical change in the final simulated scanpath.
Figure 1 shows more concretely the dynamic flow of processing through this model. This processing can be conceptually divided into four broad stages: (1) the creation of a target map, (2) target detection, (3) the visual routines involved in eye movement generation, and (4) the rejection of fixated false targets. These 4 stages are indicated by the dashed boxes in the figure. The following sub-sections provide a more detailed description of the representations and processes specific to each of these key stages.
2.1 Creating the Target Map
2.1.1 Input Images
For each simulated search trial, the model accepts two images as input; one a high-resolution (1280×960 pixel) image of the search scene, the other a smaller, arbitrarily sized image of the search target. Target images in this study were created by clipping a patch from the search image, with the target pattern centered in this patch. The model therefore has precise information about the target's appearance in the search image, although obviously not its location. Neither the search nor the target images were preprocessed or annotated in any way.
2.1.2 Retina Transform
Any model making claims about eye movement behavior must include a foveated retina, without which eye movements would be unnecessary. Human neuroanatomical constraints are such that the resolution of patterns imaged on the retina is highest for the central region, known as the fovea. Resolution decreases with increasing distance from the fovea, with patterns imaged on the peripheral retina appearing blurred. Although we are often unaware of this peripheral degradation (e.g., McConkie & Rayner, 1976), its implication for search is profound. A foveally viewed target, because it is not degraded, will yield a good match when compared to a target template stored in working memory; the same target viewed peripherally will yield a poorer match. By aligning the fovea with the target, eye movements therefore improve the signal-to-noise ratio and facilitate target detection (Geisler & Chou, 1995).
In order to capture this basic human constraint on information entering the visual system, TAM includes a simplified simulated retina (for retina transformations in the context of reading, see Engbert, Nuthmann, Richter, & Kliegl, 2005, Reichle, Rayner, & Pollatsek, 2003, and Reichle & Laurent, 2006). The method used to implement retina transformations was borrowed from Geisler and Perry (1998, 2002; see also Perry & Geisler, 2002), and the interested reader should consult this earlier work for technical details. Briefly, the approach describes the progressive blurring of an image originating from a point designated as the center of gaze. The method takes an image and a fixation coordinate as input, and outputs a retina-transformed version of the image relative to the fixation coordinate. To accomplish this transformation, a multi-resolution pyramid of the image (Burt & Adelson, 1983) is pre-computed, and a resolution map is obtained indicating the degree of low-pass filtering applied to each image point with respect to its distance from fixation. The retina-transformed image is created by interpolating over different levels of the pyramid, with the specific levels and interpolation coefficients determined by the resolution map. Importantly, none of the parameters needed to implement the retina transformation were free to vary in this study. Computational experiments were conducted based on a 20°×15° simulated field of view and a half-resolution eccentricity (e2) of 2.3°, a value that provides a reasonable estimate of human contrast sensitivity as a function of viewing eccentricity for a range of spatial frequencies (Geisler & Perry, 1998; see also Levi, Klein, & Aitsebaomo, 1985). Figure 2 illustrates the effect of this retina transformation for a representative image used in Experiment 1. Note that retina transformations were performed only on the search images. Target representations are assumed to be visual working memory representations formed through foveal viewing of a target preview, and as such not subject to acuity limitations.
Figure 2.
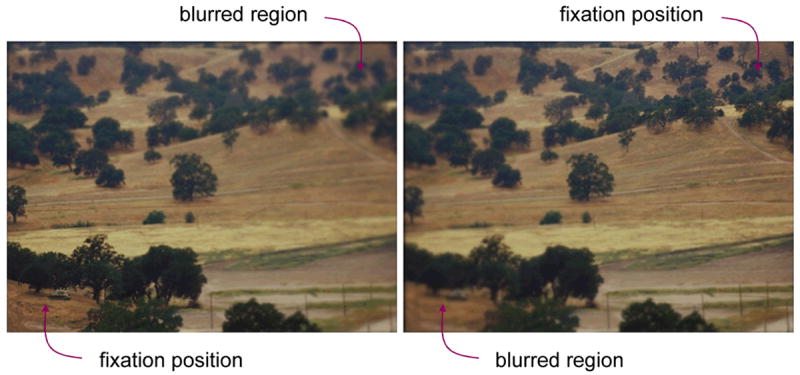
An illustration of how retina transformation affects image quality. Left: When TAM is fixated on the tank (the target used in Experiment 1), the image of the tank and the region surrounding the tank appear sharp, while eccentric regions of the scene are blurred. Right: Shifting TAM's fovea to the upper-right image corner produces the opposite effect; that region of the image is now sharp while the previously fixated tank is blurred.
2.1.3 Collect Filter Responses
Prior to filtering, the target and retina-transformed search images were separated into one luminance and two opponent-process color channels, similar to the representation of color in the primate visual system (Hurvich, 1981). The luminance channel was created by averaging the Red, Green, and Blue components of the RGB images. Color was coded by R-G and B-Y channels, where Yellow was the average of Red and Green. For a given image, visual information was extracted from each color-luminance channel using a bank of 24 Gaussian derivative filters (GDFs). These 24 filters consisted of 2 filter types (1st and 2nd order Gaussian derivatives), each appearing at 3 spatial scales (7, 15, and 31 pixels) and 4 orientations (0°, 45°, 90°, and 135°). Convolving these filters with the color-luminance separated images yielded 24 filter responses per channel, or 72 filter responses relative to a given location in the composite image.2 Figure 3 shows the responses from these 72 filters aligned in space over the midpoint of the teddy bear image. Such a 72-dimensional feature vector provides a sort of feature signature that can be used to uniquely identify the location of a complex visual pattern in an image. See Zelinsky (2003) for a similar representation applied to a change detection task, as well as for additional discussion of how GDFs can be used to extract visual features from images of objects.
Figure 3.
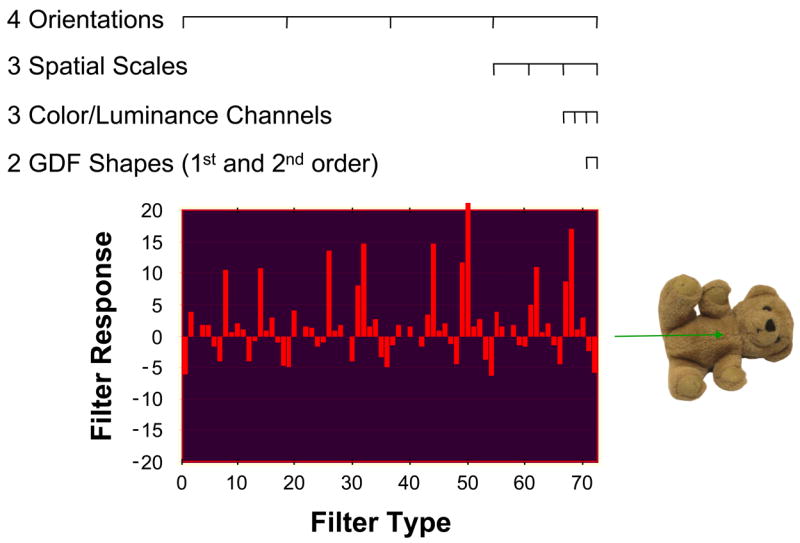
A feature signature created from the 72 GDF responses used by TAM to represent visual information; in this case for a teddy bear object (different objects would have different feature signatures). Note that although these responses were obtained from the midpoint of the teddy bear, the visual information represented by this feature vector encompasses a region of the image surrounding this point, the size of which is determined by the scale of the largest filter.
Feature vectors were obtained from every pixel location in the retina-transformed search image, and from one pixel location in the target image, with the coordinate of this target image pixel referred to here as the Target Vector (TV) point.3 Note that although only a single feature vector was used to represent the target, this one vector represents information over a patch of the target image (961 pixels, in the current implementation), with the size of this patch determined by the scale of the largest filter. In the context of a search task, the filter responses collected from the image region surrounding the TV point is intended to correspond to a working memory representation of the target's visual features, similar to the property list of visual features that is believed to underlie an object file representation (Irwin, 1996; Irwin & Andrews, 1996). As for the comparatively dense array of feature vectors computed for the search image, this representation bears a conceptual similarity to the visual feature analysis performed by hypercolumns in striate cortex (Hubel & Wiesel, 1962). Like an individual hypercolumn, each feature vector in this array is dedicated to the spatially localized analysis of a visual pattern appearing at a circumscribed region of visual space.
2.1.4 Create Target Map
A typical search task requires the following three steps: (1) a target must be represented and held in memory, (2) a search display must be presented and represented, and (3) the target representation must be compared in some manner to the search display representation. Steps 1 and 2 are accomplished by TAM through the collection of filter responses, after which the retina-transformed search image and the target are represented in the same 72-dimensional feature space. Step 3 is accomplished by correlating the target feature vector with the array of feature vectors derived for the retina-transformed search image (Figure 4, top). Obtaining these correlations for each point in the search image produces what will be referred to here as a target map, TM. More formally, if Ft is the target feature vector and Fp is the feature vector obtained at point p in the retina-transformed search image, then the corresponding point p in the target map is defined as:
Figure 4.
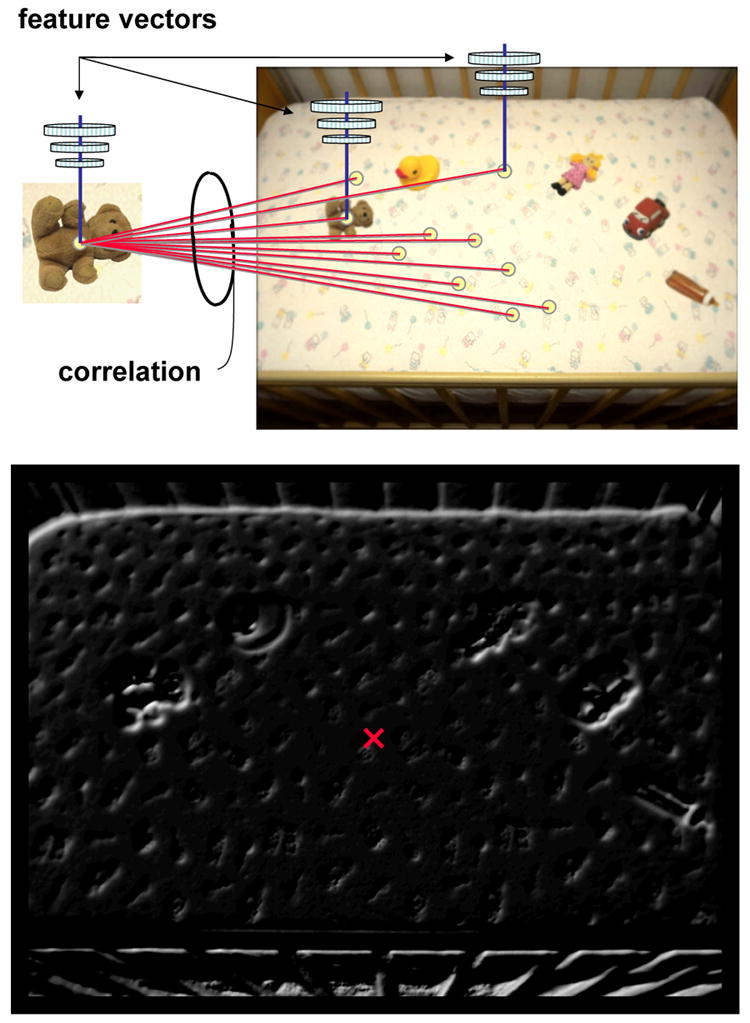
The generation of a target map from representative stimuli used in Experiment 2. Top: The feature vector representing the target is correlated with feature vectors obtained for every point in the retina-transformed search image (note that each object is slightly blurred). Bottom: These normalized correlations are plotted as the target map, with brighter points indicating higher correlations (i.e., greater visual similarity between the target and the corresponding region of the search scene). The red × indicates the averaged spatial location of this target map activity (proposed fixation point, PFP), weighted by correlation strength.
| (1) |
Unlike a saliency map, which computes a measure of feature contrast between points in an image (Itti & Koch, 2000; Koch & Ullman, 1985), each point in the target map represents a measure of visual similarity between the corresponding point in the retina-transformed search scene and the search target. A typical target map is shown in Figure 4 (bottom). Intensity represents correlation strength, with brighter points indicating greater target-scene similarity. The brightest points in the Figure 4 target map correspond to the location of the teddy bear target in the retina-transformed search image, which is to be expected given that the object in the search scene most similar to the target is usually the target itself. Note however that TAM does not guarantee that the brightest points on the target map will correspond to the location of the target. If the target appears at a more eccentric display location relative to a target-similar distractor, the target pattern would undergo greater retinal blurring and, consequently, might have a lower correlation on the target map.
2.1.5 Add Noise to Target Map
A small amount of noise was added to each value in the target map in order to correct the infrequent occurrence of a computational artifact. I observed during pilot testing that when a configuration of identical search distractors was perfectly symmetric around the simulated fixation point, their identical correlations on the target map would create a stable activation state that would cause TAM's gaze to freeze at an intermediate display position (see Sections 2.3.2 – 2.3.4 for additional details). The introduction of noise (normally distributed between .0000001 and .0001 in the current implementation) served to break these deadlocks and allow gaze to converge on an individual object. This minute level of noise is consistent with noise inherent in the visual system.4
2.1.6 Update Target Map with Inhibition Map
The final stage in the creation of the target map consists of updating this map with information about previously rejected distractors. After a distractor is fixated and determined not to be the target, the TAM tags this location on the target map with a burst of Gaussian distributed inhibition (see Section 2.4.1 for details) so as to prevent gaze from returning to the attractive lure. This amounts to a form of inhibition of return (IOR; e.g., Maylor & Hockey, 1985; Posner & Cohen, 1984). The Inhibition Map (IM) maintains an enduring spatial record of these inhibitory bursts (see Dickinson & Zelinsky, 2005, for a behaviorally explicit use of an inhibition map). Because the target map is derived anew after each change of gaze (so as to reflect the information present in the new retina-transformed search image), TAM must have some mechanism in place for inserting into each new target map the inhibition associated with previously rejected distractors. The current processing stage accomplishes this updating operation. With each new fixation, values on the inhibition map (in the range of [-.5, 0] in the current implementation), are added to the new target map (Figure 5). After a target is detected, the inhibition map is reset to zeros in preparation for the next run. Like IOR, these inhibitory bursts are assumed to accumulate in a scene-based reference frame (e.g., Müller & von Mühlenen, 1996; Tipper, Weaver, Jerreat, & Burak, 1994), with the inhibition map becoming more populated after each new burst of inhibition. Unlike IOR, the current version of the model does not assume that this inhibition decays over time (e.g., Samuel & Weiner, 2001), although adding these decay dynamics would be a straightforward matter for future work (see Yamada & Cottrell, 1995, for a previous implementation).
Figure 5.
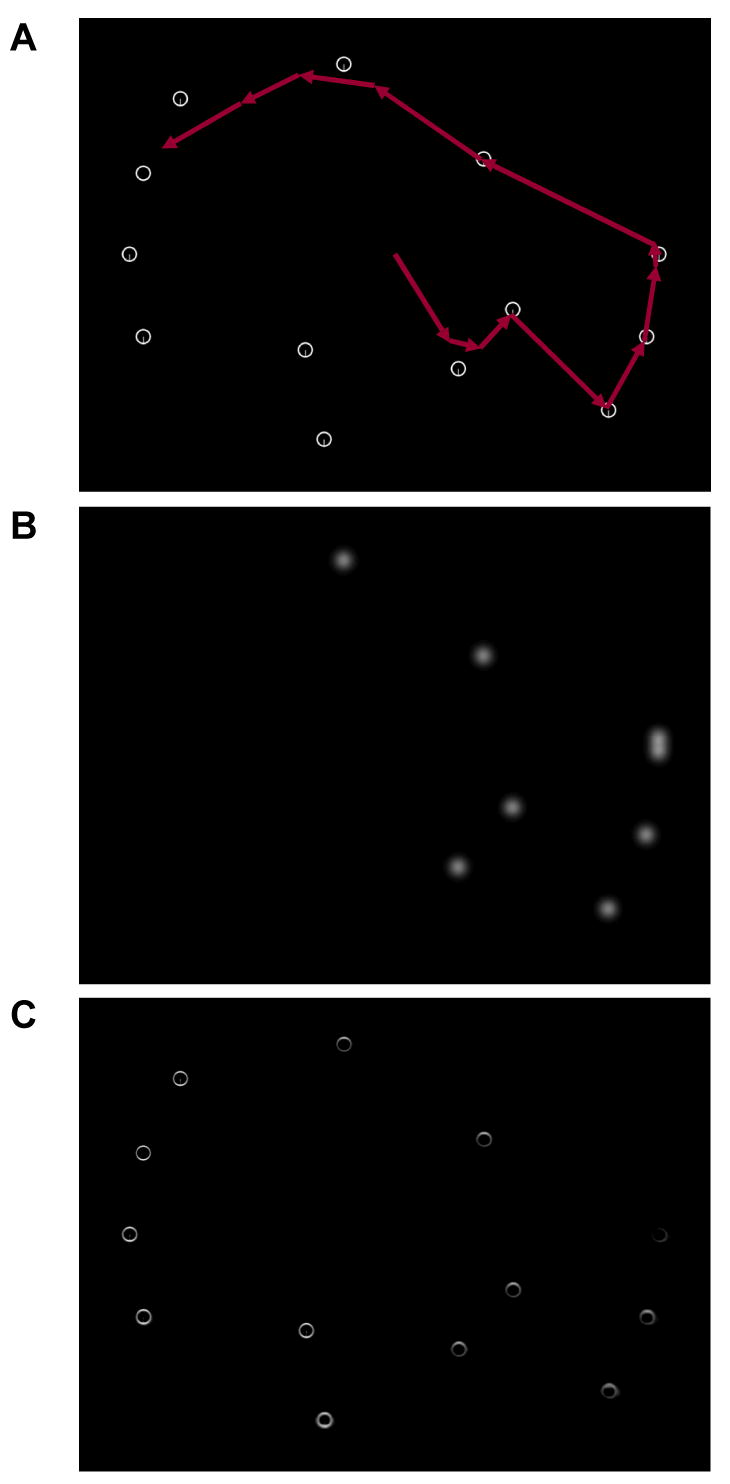
The inhibition of return (IOR) process used by TAM. (A) A sample display from the O-in-Qs search task described in Experiment 3a, shown with a simulated scanpath superimposed over the item configuration. (B) An inhibition map illustrating several regions of Gaussian distributed negativity. (C) The resulting target map following the application of this inhibition.
2.2 Target Detection
2.2.1 Is the Hotspot Correlation > the Detection Threshold?
TAM detects targets by imposing an activation threshold on the target map. More specifically, the model terminates with a Target Detected judgment if the maximum correlation on the target map, referred to here as the Hotspot and abbreviated HS, exceeds a correlation-based detection threshold (.995 in the current implementation). A high target-present threshold was used so as to minimize the potential for false positives, which are typically uncommon in search tasks. Note that target detection was not contingent on the simulated fovea being positioned at or near the target in the search image. Although targets were usually detected only after being acquired by gaze, TAM did not require this behavior. Target detection could occur after any fixation during search, and in the case of minimal retinal blurring of the target, even in the complete absence of eye movement (see the Results sections for details). If the hotspot is less than the detection threshold, the termination criterion is not satisfied and processing passes to either the Eye Movement Generation stage or the False Target Rejection stage (Figure 1).
2.3 Eye Movement Generation
2.3.1 Is the Current Fixation < the Fixation Threshold from the Hotspot?
Following the target detection stage, and assuming the target has not yet been detected, further processing depends on whether the model is fixating the hotspot pattern. If the hotspot is fixated, negativity should be injected at the hotspot's location on the target and inhibition maps. However, if the hotspot pattern is not fixated, the model should make an eye movement bringing the simulated fovea closer to the most likely target candidate, as defined by the hotspot. To inform this decision, it is assumed that the model has knowledge about where it is currently looking in the scene, and whether it is looking at the object suspected of being the target (i.e., the hotspot pattern). The first assumption is reflected in Figure 1 by the Current Fixation variable. Current Fixation, abbreviated CF, is an x,y coordinate indicating the center of TAM's simulated fovea in a scene-based reference frame. The second assumption requires a Fixation Threshold (FT) parameter. Intuitively, the fixation threshold describes a distance surrounding current fixation within which an object is said to be fixated (33 pixels, or ∼ 0.52° in the current implementation, a distance corresponding to the radius of the simulated fovea described in Section 2.1.2). With the addition of these terms, the conditional operation underlying this decision stage can be re-expressed as a relationship between the hotspot and the fixation threshold (i.e., Is the hotspot contained within the fixation threshold?) and quantified by the Euclidean distance between HS and FT.
Search objects appearing within the fixation threshold are assumed to be foveated by the model, and as such are not blurred by the retina transformation. Patterns appearing within the fixation threshold of a retina-transformed image therefore appear exactly as in the unaltered input search image. Obtaining this non-degraded view of an object has important implications for the model. Although the match between a target feature vector and a peripherally viewed target might be poor, a fixated target will produce a correlation of 1.0 on the target map.5 Consequently, if the hotspot falls within the fixation threshold distance, and assuming that processing has reached this decision stage (i.e., TAM's termination criterion was not satisfied), the object at fixation cannot be the target. The creation of such a false target is fairly commonplace in TAM, occurring each time a distractor becomes the hotspot on the target map rather than the actual target. TAM's only means of distinguishing a false target from an actual target is to foveate the item (i.e., bring the item within its fixation threshold) and observe how this behavior affects the item's correlation on the target map. In the eventuality that the hotspot correlation remains below the detection threshold after foveation (i.e., HS is within FT), processing will pass to the upper-middle section of the Figure 1 flowchart and the false target will be inhibited. However, if the current decision stage reveals that the hotspot is not yet within TAM's fixation threshold, the possibility still exists that the object corresponding to the hotspot value might be the target, and that the hotspot correlation might rise above the detection threshold if the object is fixated. In this eventuality, TAM proceeds with the acquisition of the hotspot object by making another eye movement. I will turn next to the processing involved in generating these eye movements, as described by the lower-right leg of the Figure 1 flowchart.
2.3.2 Compute the Proposed Fixation Point
The Proposed Fixation Point (PFP) is the coordinate in the search image where TAM, if left unconstrained, would next fixate with its simulated fovea. This value is defined at a given moment in time by the weighted spatial average (centroid) of signals on the thresholded target map. Returning to Figure 4 will help to clarify the PFP computation. Although the brightest points on the target map do indeed belong to the teddy bear target, note that many non-target regions also correlate highly with the target and therefore appear as points of activation on this map. For example, points corresponding to the toy car are also quite bright, as are points corresponding to each of the other distractors, to a lesser degree. Importantly, the search scene background also correlates with the target, creating a ghostly backdrop of target map activation corresponding to the crib. These points of background activation, although not as highly correlated as the actual target points, literally number in the thousands, and through their weight of numbers profoundly influence the behavior of the model. To compute the PFP, each non-zero value on the target map (i.e., each non-black point in Figure 4, bottom) is weighted by its level of activation, then spatially averaged. Performing this operation for the Figure 4 target map yields a point nearer to the center of the image than the target, similar to where human observers in the Zelinsky et al. (1997) study initially directed their gaze (also see Figure 12, Experiment 2). Although the target is, in a sense, casting a strong vote (i.e., the hotspot) for gaze to move towards its location, the many correlated non-targets are also casting votes, and these votes, when averaged, serve to pull gaze to the image's center. In general, when the number of target map points is large, the PFP will tend to be near the center of the image; when the number of target map points is small, the PFP will tend to be nearer the hotspot.
TAM's averaging behavior is broadly consistent with the neurocomputational principle of distributed or population coding (e.g., Anderson, Silverstein, Ritz, & Jones, 1977; Rumelhart & McClelland, 1986; Sejnowski, 1988). Population codes, although ubiquitous throughout the brain, have been demonstrated most elegantly in the visuo-motor system. Neurophysiological investigations of the superior colliculus have revealed that this brain structure contains a map of eye movement vectors, and that the final movement of gaze to a point in space is determined by averaging over the population of individual movement signals (Lee, Rohrer, & Sparks, 1988; McIlwain, 1982; for reviews, see McIlwain, 1991; Sparks, Kristan, & Shaw, 1997). Behavioral evidence for population averaging in humans is equally compelling. When observers attempt to shift their gaze to one of two modestly separated objects, quite often their eyes land at an intermediate location between the two. This oculomotor peculiarity was first reported by Kaufman and Richards (1969a; 1969b), and has since become known as the global effect or a center-of-gravity averaging response (Findlay, 1982, 1997; He & Kowler, 1989). It has been attributed to a weighted spatial averaging of pattern-related activity, likely in the superior colliculus (Findlay, 1987; Findlay & Brown, 2006b; Findlay & Walker, 1999). Population averaging is also a core construct in TAM, as embodied by the weighted centroid computation of the proposed fixation point. Similar to the vector averaging scheme used in the superior colliculus, eye movements in TAM are represented by the activity of “cells” comprising the target map. Every cell votes for a particular saccadic vector, with each vote weighted by target similarity. These votes are then tallied, and gaze is sent to the averaged spatial location. TAM therefore describes a computationally explicit middle ground between the behavioral direction of gaze and the underlying neuronal coding of this behavior.
2.3.3 Is the Proposed Fixation Point > the Eye Movement Threshold from Current Fixation?
Eye movement generation is constrained by an Eye Movement Threshold (EMT), which imposes a minimum amplitude on the size of the simulated saccade (see the following section for further motivation). If the Euclidean distance between the CF and the PFP exceeds this threshold, an eye movement is made to the proposed location, as indicated by the Move Eye operation in Figure 1. Note that an eye movement in TAM involves simply updating the CF index to reflect the new eye position in the scene, which in turn is used to retina transform the search image as if the eye had actually moved. An analogous updating operation in humans might reflect the shift in visual attention that is believed to immediately precede an actual eye movement to a location in space (e.g., Irwin & Zelinsky, 2002; Deubel & Schneider, 1996; Kowler et al., 1995; Shepherd et al., 1986). See Sections 8.2 and 8.3 for further discussion of how TAM's behavior might be mapped to other aspects of attention during visual search.
Setting the EMT reflects a compromise between two opposing problems. On the one hand, having a fixed threshold is undesirable, as a threshold setting that works well for one search task might not work well for another (i.e., it may generate too many or too few eye movements). On the other hand, treating this threshold as a fit parameter and allowing the user to specify different settings from trial to trial would inject an unacceptable degree of arbitrariness into the model, and consequently reduce its explanatory power. TAM avoids both of these problems by dynamically setting the EMT based on the signal and noise properties of the current retina-transformed search image. Embedded within the target map is information about both of these properties. A signal is defined as the summed correlations within a fixed distance of the TM hotspot. Because the hotspot might not correspond to the actual target, note that this definition means that the signal term represents TAM's best guess as to the target's location. Note also that this distance parameter, which is set to the fixation threshold (FT) in the current study, reflects the fact that signals arising from real-world targets will likely be a region of distributed activity and not a single point in space.6 The noise term is defined as the summed correlations from all non-target related activity on the target map. More formally, the eye movement threshold is defined as:
| (2) |
where d is the distance between the current fixation (CF) and the hotspot (HS), and C is a constant, set at 10 in the current implementation. The Signal and Noise terms are defined as:
| (3) |
and
| (4) |
where D(p) is the distance between point p and the hotspot, and θ is a threshold imposed on the target map. Note that only TM values exceeding θ are counted in this measure of signal and noise (see the following section for more details regarding this Target Map Threshold, TMT). The log Signal/Noise Ratio (SNR) is clamped to the range of [-1/C, 0], making EMT restricted to the range of [FT, d].
An EMT sensitive to changing signal and noise properties will likely produce more human-like target acquisition behavior compared to a static threshold. A difficult task will give rise to a small SNR, which will in turn result in a small threshold setting. Behaviorally, this might be interpreted as a ‘cautious’ search consisting of many small-amplitude saccades so as not to miss the target (Boynton, 1960; Scinto, Pillalamarri, & Karsh, 1986). These saccades are constrained by FT to be at least 0.52°, the lower bound for EMT in the current implementation. When the task is easy, the larger SNR will result in a larger threshold setting and, ultimately, larger-amplitude saccades that will bring gaze more expeditiously to the suspected target. This pattern might be interpreted as a ‘confident’ search. In its extreme, EMT could grow to the upper bound, d, causing gaze to shift directly to the hotspot pattern, a behavior consistent with the oculomotor capture of a pop-out target (e.g., Theeuwes, Kramer, Hahn, Irwin, & Zelinsky, 1999).7
2.3.4 Raise the Target Map Threshold (+TMT)
TAM's behavior as of the previous stage in processing is still relatively minimal. A proposed fixation point is computed, and if this point exceeds a threshold distance from the current fixation, an eye movement is made to that scene position corresponding to the centroid of the target map. At its most involved, the model, at this point, is therefore capable of making only a single saccade, after which it would become trapped at the fixated scene position. No processes have yet been introduced to allow for the multiple shifts in gaze that normally accompany target acquisition behavior.
To break this oculomotor impasse, a moving threshold is used to iteratively exclude those values from the target map signaling poor target-scene correlations. The behavioral consequence of this moving Target Map Threshold (TMT), indicated by θ in Equations 3-4 (and is the same θ from the preceding section), is the production of a series of eye movements that will eventually align the simulated fovea with the target. Intuitively, the function of this thresholding operation can be understood as a dynamically changing relationship between the extent of activity on the TM and the computation of the proposed fixation point. When the number of points on the TM is large, the geometric center of this map, and therefore PFP, is unlikely to correspond to the hotspot location. However, as the population of TM decreases, so too will the distance between PFP and HS, as the hotspot becomes more weighted in the centroid computation. In the extreme, with only the hotspot appearing on the TM, PFP and HS will coincide in space. It is the function of the +TMT operation (Figure 1) to accomplish this progressive depopulation of the target map. When this threshold is low, even very poor correlations to the target will appear as points of activation on the TM, and therefore contribute to the centroid computation of PFP. However, as this threshold increases, target-scene correlations below the threshold setting will be excluded from the TM until only the most highly correlated signals remain. This looping thresholding circuit therefore prunes from the TM those signals offering the least evidence for the target, a process that ultimately isolates the most likely target location.
The final step remaining in the saccade generation process is to relate the above described dynamic to the eye movement threshold. This relationship is illustrated in Figure 6. Immediately following each shift of gaze, the new fixation position will describe the above-threshold centroid of the TM relative to the current setting of TMT. This condition corresponds to the aforementioned stable fixation state in which CF and PFP are aligned (Figure 6B). As processing passes down the lower-right leg of the Figure 1 flowchart and enters the looping threshold circuit, TAM begins to iteratively raise TMT. After each of these upward threshold movements, the TM centroid is recomputed so as to reflect those TM values that have been excluded based on the higher threshold setting. As a consequence of this iterative pruning and recomputation of PFP, the alignment between CF and PFP gradually breaks, as PFP begins its slow, and often circuitous march to the hotspot (Figure 6C-D). This relationship between the centroid computation of PFP and the target map threshold can be formally expressed as:
Figure 6.
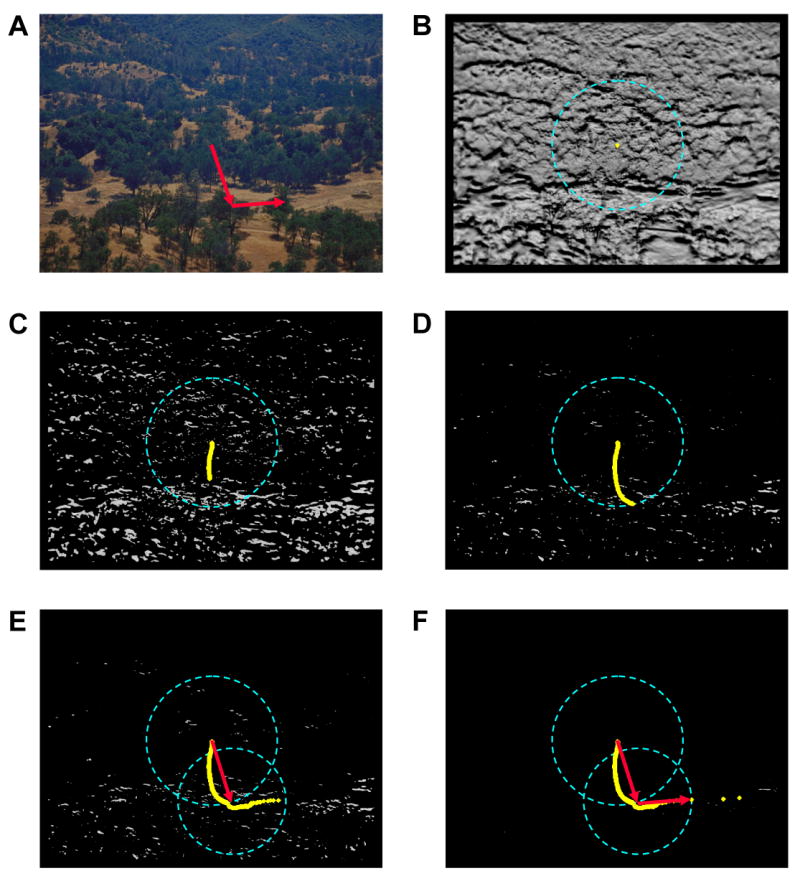
An illustration of how TAM's eye movement threshold (EMT), the incremental threshold adjustment (+TMT), and the proposed fixation point (PFP) contribute to the generation of eye movements. (A) A partial scanpath showing two eye movements made during a representative tank (far right) acquisition trial from Experiment 1. (B) To generate these eye movements an EMT (blue dashed ring superimposed over the target map) is computed relative to the current fixation (CF) location, which in this case is also the starting gaze position, and the target map activation is averaged to obtain the PFP (yellow dot). Note that for visually complex scenes the initial PFP is often approximated by the center of the image. (C) As the TMT is elevated activity is pruned from the target map, which causes the PFP to slowly move from its starting position. Illustrated are 142 PFPs, resulting from 702 increments of the TMT. (D) After extensive pruning of the target map, the PFP eventually crosses the EMT. Illustrated are 232 PFPs, resulting from 793 TMT increments. (E) An eye movement (red arrow) is directed to the location of the first post-EMT PFP. Following this movement, a new EMT is computed around the new CF. Also illustrated are additional PFPs resulting from further pruning of the target map. (F) Once again, an eye movement is directed to the PFP exceeding the EMT. Not shown are the two final eye movements that eventually align gaze with the target.
| (5) |
where the TMT is again indicated by θ. In the current implementation, TMT was initially set to zero at the start of each trial, meaning that every signal on the TM contributed to the initial computation of PFP, and was incremented by .001 with each iteration through the +TMT circuit. Note that such an iterative threshold circuit is a biologically plausible neural computation that can easily be implemented by a recurrent network (e.g., Elman, 1990).
Given that PFP dictates where TAM should fixate in a scene, the above described dynamic, if left unconstrained, would produce an inordinately large number of eye movements. Each increment of TMT, by changing slightly the centroid of the TM, would result in a miniscule change in gaze position. This unrealistic behavior is thwarted by the eye movement threshold (EMT; see Section 2.3.3 for details), which imposes a SNR-dependent minimum amplitude constraint on the next eye movement. Raising the target map threshold prunes the least correlated signals from the TM, which in turn drives the PFP steadily towards the hotspot, eventually causing it to cross the eye movement threshold. At this critical value of θ, the conditional statement framed in Section 2.3.3 (i.e., PFP > EMT from CF) will be positively satisfied, and an eye movement of amplitude EMT (or greater) will be executed to the scene coordinate specified by PFP (Figure 6E). Following this eye movement, processing will return to the retina-transformation stage in Figure 1, and the cycle will begin anew. If conditions are such that processing again passes to the Eye Movement Generation stage, then a new EMT will be set around the new CF, and the +TMT circuit will eventually produce another eye movement bringing gaze one step closer to the hotspot (Figure 6E-F). Note that, barring the termination of this process via target detection, the upper and lower bounds imposed on EMT, when combined with the above-described dynamics, guarantee that the simulated fovea will ultimately be directed to within FT of the hotspot, at which point the suspected target would be fixated and no further eye movement would be necessary. In terms of TM activation, this condition would typically be met when the TMT has excluded all or most of the non-hotspot signals from the TM (Figure 6F).
2.4 Rejecting False Targets
2.4.1 Inhibit Hotspot Area on the Target Map
If TAM fixated within FT of the hotspot location and the target is still not detected (i.e., the Section 2.3.1 conditional is positively satisfied; CF < FT from HS), then simulated gaze was mistakenly directed to a false target. When this happens, a fairly common occurrence throughout the course of some searches, it is desirable to inhibit the location of this false target so as to allow the model to select a new target candidate for inspection. This inhibition is accomplished by the processes described in the middle of the Figure 1 flowchart. The first stage of this process involves inhibiting the hotspot by applying a negative Gaussian filter centered at the hotspot location on the target map. An identical burst of inhibition is also applied to the corresponding location on the inhibition map (Update IM), thereby enabling the inhibitory burst to survive the recreation of TM following the next eye movement. The inhibitory filter (I) is defined as:
| (6) |
where K is a negative number in the [-1,0) range, set to -0.5 in this study. The σ parameter of the exponent is determined by the width of the filter, W:
| (7) |
which was fixed at 63 pixels (∼ 1°) in all of the computational experiments. The net effect of this inhibition is to reduce the hotspot correlation by 0.5 on the target map, with lesser Gaussian-distributed inhibition radiating out from the hotspot over a 63 pixel window.
This inhibitory mechanism is conceptually similar to the IOR mechanism proposed in the search literature (e.g., Klein, 1988, 2000) in that gaze is discouraged from revisiting a false target following the application of inhibition. However, TAM is agnostic as to the functional role of IOR. Specifically, although the proposed inhibitory processes are consistent with the suggestion that IOR serves as a foraging facilitator (Klein & MacInnes, 1999; but see Hooge, Over, van Wezel, & Frens, 2005), TAM does not require this assumption; inhibition may simply be an artifact of a system requiring the serial selection of hotspot signals.
2.4.2 Is the Target Map Empty?
Because previous elevations of TMT would likely leave the target map fairly sparse (perhaps consisting of only the hotspot value) by the time processing reaches the Target Rejection stage, it may be the case that inhibiting the hotspot location as described in Section 2.4.1 will leave the TM completely empty. A conditional is therefore introduced to determine this state and direct further processing accordingly. If hotspot inhibition does remove the last remaining activity from the target map, processing enters into a second TM threshold adjustment circuit (upper-right leg of the Figure 1 flowchart). This circuit differs from the one described in Section 2.3.4 in that the TMT, θ, is now incrementally lowered, not raised. The consequence of this downward threshold adjustment, indicated by − TM Threshold in Figure 1, is opposite that of the + TMT operation; rather than incrementally removing points of activation from the TM, lowering θ serves to reintroduce activation values into the TM that were previously excluded. After each downward threshold adjustment (set at .0000001 in the current implementation), the conditional is reevaluated. Once any emerging activity is detected on the TM, the looping circuit is broken and processing again passes to the Eye Movement Generation stage.
2.4.3 Eye Movement Generation
The operations involved in making an eye movement following distractor rejection are nearly identical to those described in Sections 2.3.2 and 2.3.3. A proposed fixation point is computed by spatially averaging the activity that has emerged on the target map, and the Euclidean distance between this PFP and the current fixation is compared to a new eye movement threshold (EMT). If the distance between PFP and CF exceeds this threshold value, gaze shifts to the PFP coordinate and the cycle begins again with the creation of a new retina-transformation of the search image. However, if the EMT criterion is not satisfied, processing enters the same − TMT circuit described in the previous section, so that additional activity can be reintroduced to the target map. Eventually, this slow repopulation of the target map will cause the CF-PFP distance to exceed the EMT, resulting in an eye movement.
2.5 Summary and Assumptions
The processing illustrated in Figure 1 describes a dynamical system for generating a sequence of simulated gaze fixations, which ultimately result in TAM's “eye” acquiring the designated target. Immediately following each eye movement, and at the start of a trial, the search scene is transformed to reflect the human visual system's retinal acuity limitations. Filter responses are then collected from this retina-transformed image and compared to a target-feature vector to create the target map, a representation indicating evidence for the target at each point in space. Using Ullman's (1984) terminology, the filter responses would comprise a form of base representation, and the target map would be an incremental representation produced by a goal-directed visual routine, which correlates the base representation with the target vector. If the hotspot on the target map fails to indicate sufficient evidence for the target, a centroid-based proposed fixation point is computed and compared to an eye movement distance threshold, which is derived from analysis of the signal and noise characteristics of the target map. If the proposed fixation point exceeds this distance threshold, the simulated fovea is sent to the specified coordinate; otherwise, a variable activation threshold is applied to the target map. Incrementing this threshold prunes poor matches from the target map, thereby causing the centroid to eventually exceed the eye movement threshold. The ensuing eye movement brings gaze closer to the hotspot pattern, and this cycle iterates until gaze and the hotspot are aligned. If fixation on the hotspot pattern fails to produce sufficient evidence for the target, TAM inhibits the fixated false target and sets its sights on a new hotspot pattern. The eye movement generation process then begins anew, perhaps after the reintroduction of activity to the target map via an incremental lowering of the activation threshold. If allowed to continue, this dynamical system ultimately brings the simulated fovea to the target pattern in the image, perhaps after many changes in fixation, at which point processing ends with the satisfaction of the target detection threshold.
TAM assumes only that a target is present in the search image, and that the target's appearance in this image matches exactly the description from the target preview. No constraints are imposed on the content of the target pattern; TAM can acquire patterns as simple as letters of the alphabet or as complex as realistic objects embedded in naturalistic scenes. In this sense, TAM is a relatively general purpose model of target acquisition. Of course, a model of this complexity requires many constraints, or parameters, in order to work. The principal parameters set by the user are: the target detection threshold (DT), the size of the target map threshold increment (+ TMT) and decrement (− TMT), and the distribution of inhibition injected into the target and inhibition maps following the rejection of a false target. Although considerable pilot work was needed to find reasonable settings for these parameters, all were fixed throughout the experiments reported in this article. Additionally, a point must be specified on the target pattern from which to collect filter responses, and this target vector (TV) point might also be considered a type of parameter.8 The TV point was manipulated in Experiment 3 (Sections 5-7), but held constant in Experiments 1 and 2 (Sections 3-4). A starting gaze position in the search image must also be specified by the user. This coordinate, whose default value was the center of the image, was manipulated in Experiment 2 (Section 4) in order to conform to the starting gaze position used in the behavioral experiment. Other model parameters, such as the hotspot (HS), the proposed fixation point (PFP), the eye movement threshold (EMT), and the fixation threshold (FT), are internally computed by TAM and not under the user's direct control.
TAM is also constrained by several representational and operational assumptions, but these are part of the model's framework and not actual parameters. For example, constructing the base representation required decisions as to the number and size of spatial scales to use, and how coarsely to code orientation selectivity. Biological constraints were considered when making these decisions, but often these were trumped by pragmatics of the computation. Orientation is therefore represented at 90° increments rather than the roughly 10° increments coded in primary visual cortex (Hubel & Wiesel, 1962; Shapley, 1990).9 The operations used by TAM are also generally considered to be biologically plausible; such as: addition, subtraction, multiplication, and division, and the slightly more complex operations needed to set thresholds, compute distance relationships, and to find a maximum value on an activation map (e.g., Mel, 1990; Poggio & Hulbert, 1995; see also Churchland & Sejnowski, 1992). Perhaps the most questionable of TAM's operational assumptions is the correlation between a target and image vector. However, this operation, essentially a normalized inner product, has been a cornerstone assumption in the neurocomputation literature since the earliest neural network models (see Rumelhart & McClelland, 1986, and Anderson & Rosenfeld, 1988). Although it is difficult to ascribe biological plausibility to any complex computational operation with complete certainty (Hausser & Mel, 2003), what is known of neuronal connectivity suggests that the neurocomputation of an inner product is plausible.
3 Experiment 1: Acquiring a Target in Fully Realistic Scenes
TAM was designed to work with realistic targets and search scenes, as evidenced by its image-based features and operations described in Section 2. It is in this context that TAM has its greatest potential to contribute to overt search theory. This experiment characterizes the eye movement behavior of human observers, and TAM, in a task requiring the localization of a visually complex target in fully realistic scenes. Note that these are the minimally constraining conditions that create a very rigorous test of a general model of target acquisition. TAM must align its simulated fovea with the designated target, overcoming image variability within and between scenes, and do so without any change to model parameters. If it is able to acquire these targets in a manner consistent with observers, particularly with respect to the number of eye movements required by the task and the path by which gaze is guided to the target, then the first hurdle will be passed towards the development of a general purpose model of human target acquisition and visual search.
3.1 Behavioral Methods
Twelve participants were asked to locate a target (a military tank) embedded in 42 landscape scenes, each depicting rolling hills, open fields, and sparse to moderate ground cover. Events comprising a behavioral trial are illustrated in Figure 7 (top sequence). The target preview, which was obtained directly from the search scene, was displayed for 1 second at the center of the screen, followed by the search display. Observers were instructed to locate the target as quickly as possible, and to indicate this judgment by pressing a trigger using the index finger of their preferred hand. The search display remained visible for 700 msec following the trigger press, after which it was replaced by a fixation target in preparation for the next trial. See the Appendix for additional methodological details.
Figure 7.
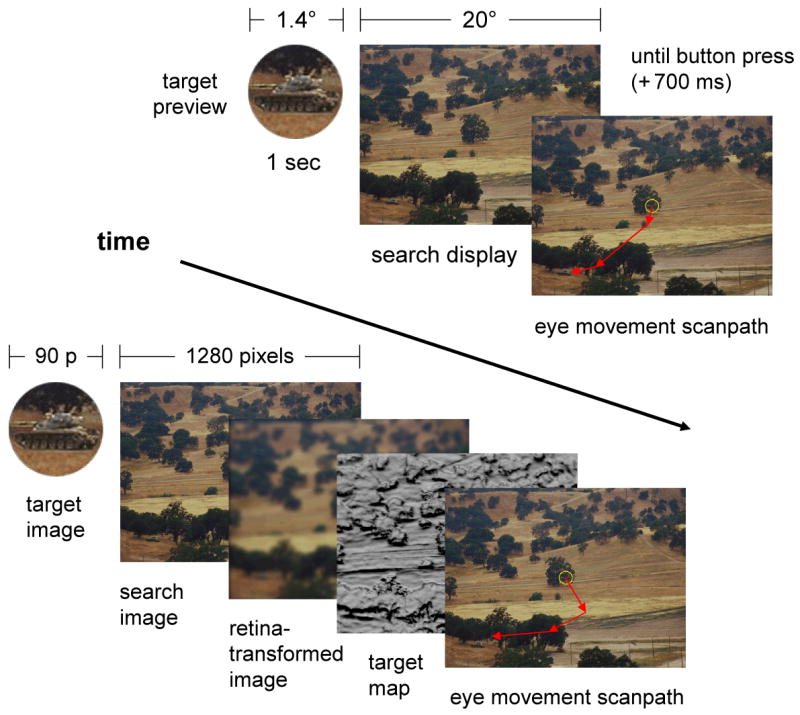
Procedures used in Experiment 1. Top sequence: The behavioral procedure consisted of a 1 second target preview, followed by a search display that remained visible until a manual trigger press response (plus an additional 700 ms, so as to better evaluate localization accuracy). Note that the target preview is shown magnified relative to the search image in order to better illustrate the target pattern; in the actual experiment the preview vignette was identical in scale and appearance to the target in the search display. Bottom sequence: TAM accepted the same target and search images as input, then performed operations on these images to generate a simulated sequence of eye movements (see Section 2 for details). Illustrated are two of the intermediate representations produced throughout the course of these operations, the retina-transformed search image and the target map.
3.2 Computational Methods
The computational methods paralleled the behavioral methods, and are summarized in Figure 7 (bottom sequence). For each trial, TAM was given the identical target preview and search images shown to human observers. Its fovea was also initially set to the center of the image, meaning that the initial retina transformation of the search scene approximated the acuity limitations of an observer fixating at the scene's center. The target feature vector (i.e., the TV point, Section 2.1.3) was obtained from the center of the target preview image.
3.3 Results and Discussion
3.3.1 Target Acquisition Accuracy
All observers acquired the targets without difficulty, typically in under 3 seconds (M = 2228 ms; SEM = 128 ms). The average distance between the observers' gaze and the target's center at the time of a trigger press was 1.10°, with the 95% confidence interval (CI) extending ± 0.45°. Gaze-to-target distances across the twelve observers ranged from a minimum of 0.39° to a maximum of 2.29°. Because the offset of the search display was delayed by 700 msec following a trigger press, it was also possible to analyze gaze-to-target distances following the first post-response eye movement. This average distance was 0.56°, significantly less than the gaze-to-target distance from the last pre-response fixation, t(11) = 2.71, p < .05. These data indicate that observers could extract target identifying information from their parafoveal vision, and that gaze was often still converging on the target at the time of the manual response.
Target acquisition by TAM mimicked the patterns observed in the behavioral data. TAM successfully acquired the target in all 42 of the search scenes, meaning that a correlation on the target map ultimately exceeded the target-present threshold of .995 on every trial. To determine whether this target-present response was triggered by the actual target, I analyzed the location of this above-threshold value in relation to the search target and found that the coordinate of the trial-ending correlation on the target map consistently fell within 3 pixels of the search image location corresponding to the TV point in the target image. As was the case for human observers, TAM was indeed detecting the search target. At the moment of target detection, the average distance between the target's center and TAM's gaze was 1.38° (SD = 0.32°), a value comparable to the average gaze-to-target distance from observers and within the 95% CI of the behavioral mean. TAM's minimum and maximum gaze-to-target distances were 0.56° and 1.96°, respectively. Although an analysis of post-response gaze-to-target distance could not be conducted for TAM, the fact that the above-threshold hotspot on the final target map corresponded to the target's location suggests that the next eye movement, were it to be executed, would have brought simulated gaze even closer to the target. Together, these data indicate a close agreement between TAM and the behavioral data with respect to target acquisition accuracy.
3.3.2 Number of Fixations
Figure 8 illustrates the number of fixations made by the 12 human observers, and TAM. Both initial fixations, corresponding to gaze position at the time of search display onset, and final fixations, corresponding to gaze at the moment of target detection, were included in this measure. Observers required an average of 4.8 (± 0.52°, 95% CI) fixations to detect and localize the target. TAM required an average of 4.6 fixations to perform the same task, a value well within the behavioral mean's 95% CI. Models of overt search vary widely in their estimates of fixation number, with some predicting far fewer fixations than human observers, and others predicting far more (for further discussion of this topic, see Itti & Koch, 2000; Navalpakkam & Itti, 2005; Zelinsky et al., 2006). The high degree of consistency between TAM and the behavioral data with respect to number of fixations suggests that the processes used by this model to generate eye movements offer a reasonable approximation to human behavior in this task.
Figure 8.

Number of fixations made by individual observers (green bars) and TAM (crimson bar) in Experiment 1. The blue-green bar indicates averaged behavioral data. The error bars for individual observers and the model indicate standard deviations; the standard error of the mean (SEM, calculated over observers) is plotted for the averaged data.
3.3.3 Target Guidance
TAM makes a reasonable number of eye movements, but were these eye movements directed to reasonable locations in the scenes? Search is known to be guided towards targets (Wolfe, 1994, Wolfe et al., 1989; Motter & Belky, 1998). Evidence for guidance might therefore be used as one measure of a reasonable direction of gaze. To assess the evidence for guidance in these data, I analyzed the direction of the initial saccades in relation to the target locations. The 42 scenes were divided into three categories: those in which the target appeared in the left half of the scene (21), those in which the target appeared in the right half of the scene (21), and those in which the target appeared in the bottom half of the scene (39). Note that scene constraints forced targets to appear in the bottom half of the image in all but 3 of the scenes. If search is guided towards targets, the behavioral data should show a higher percentage of initial saccades in the target's direction. Moreover, to the extent that TAM's gaze is similarly guided towards targets, this can be taken as evidence for a reasonable selection of saccade targets by the model, and indirect evidence for the processes instrumental in these selections.
The behavioral and simulated guidance data are shown in Figure 9. When the target appeared in the right half of the scene (top 4 bars), observers directed 78% (± 3.60%, 95% CI) of their initial saccades into their right visual field. Only 22% of these initial saccades were misdirected to the left half of the scene. TAM showed a slightly more pronounced preference, with 86% of the initial gaze shifts being in the direction of the target. An opposite pattern of results was obtained when targets appeared in the left visual field (middle 4 bars). Observers and TAM now made leftward initial saccades on 72% (± 3.88%, 95% CI) and 67% of the trials, respectively. Interestingly, the most pronounced directional preference was observed for downward targets (bottom 4 bars). Observers and TAM made downward initial saccades on 85% (± 5.12%, 95% CI) and 97% of the trials, respectively. The fact that guidance was strongest in the downward direction, t(11) ≥ 2.32, p ≤ .05, is interesting in that it suggests that human observers may have learned that targets would typically appear in the lower half of the display, and biased their initial gaze shifts accordingly (Eckstein et al., 2006; Torralba et al., 2006). Of course, this explanation cannot account for TAM's downward bias, as there is no learning component in this version of the model. However, further analyses of the initial target maps revealed that values within 10% of the hotspot correlation were more than 10 times as frequent in the bottom halves of the images compared to the top halves. Apparently, the mountainous regions of the scene were visually less similar to the target, and this general upper-field dissimilarity produced a strong downward bias. Note, however, that this bias to look away from mountains was, in the current context, a fortuitous consequence of scene statistics and does not represent a true scene constraint imposed on the search process, as demonstrated recently by Neider and Zelinsky (2006b). Nevertheless, the existence of such a bias reinforces the need to consider similarity relationships between targets and scenes before concluding that scene context affects search.
Figure 9.

Percentage of initial saccades directed to the target in Experiment 1, grouped by the location of the target in the scene. Top four bars; target was located in the right half of the scene. Middle four bars; target was located in the left half of the scene. Bottom four bars; target was located in the bottom half of the scene. Regardless of the target's location, both human and simulated initial eye movements were biased in the direction of the target. Error bars attached to the behavioral data indicate 1 SEM.
To summarize, both observers and TAM showed strong preferences to initially shift gaze in the direction of the target. These preferences provide clear behavioral evidence for target guidance in realistic search scenes. The fact that similar guidance patterns were produced by the model suggests that the representations and processes used by TAM to guide eye movements in this task might also underlie guidance in human target acquisition behavior.
3.3.4 Scanpath Analysis
An analysis of initial saccades revealed a high degree of consistency between TAM and human behavior, but does this agreement extend to the non-initial eye movements accompanying search? Figure 10A shows scanpaths from 6 of the 12 observers for a representative scene, along with the corresponding scanpath generated by TAM. The other 6 behavioral scanpaths were qualitatively similar, but were omitted for illustrative clarity. Despite considerable variability in the trajectories of these paths, it is clear that human gaze converged steadily, albeit imperfectly, on the target, and that the path described by the model's gaze followed a similar trajectory. Importantly, TAM did not produce patently unrealistic eye movement behavior, such as oscillations between suspected targets or a preoccupation with the borders of the image. Contrast this behavior with that of a strictly bottom-up model adapted from Itti & Koch (2000), with bottom-up referring to the selection of targets entirely by local feature contrast signals in the image. The behavior of this model, illustrated in Figure 10B, has gaze wandering from salient point to salient point, irrespective of the target's location. Indeed, the depicted saliency-based simulation was terminated after 20 eye movements (again in the interest of preserving clarity) without the target ever being acquired. In fairness to the Itti & Koch (2000) approach, a bottom-up model is not intended to describe appearance-based target guidance, so its failure to do so is not surprising. Had TAM been asked to acquire salient visual objects irrespective of the target's appearance, it too would have failed. However, to the extent that target guidance exists, as it did in this task, this case analysis makes clear that it is not limited to the initial saccade; target guidance is reflected in the entire path followed by gaze to the target. Consequently, models that do not include a target guidance component will not be able to reasonably approximate search scanpaths, at least not in the realistic target acquisition task reported here (see Zelinsky et al., 2006, for additional discussion of this topic).
Figure 10.
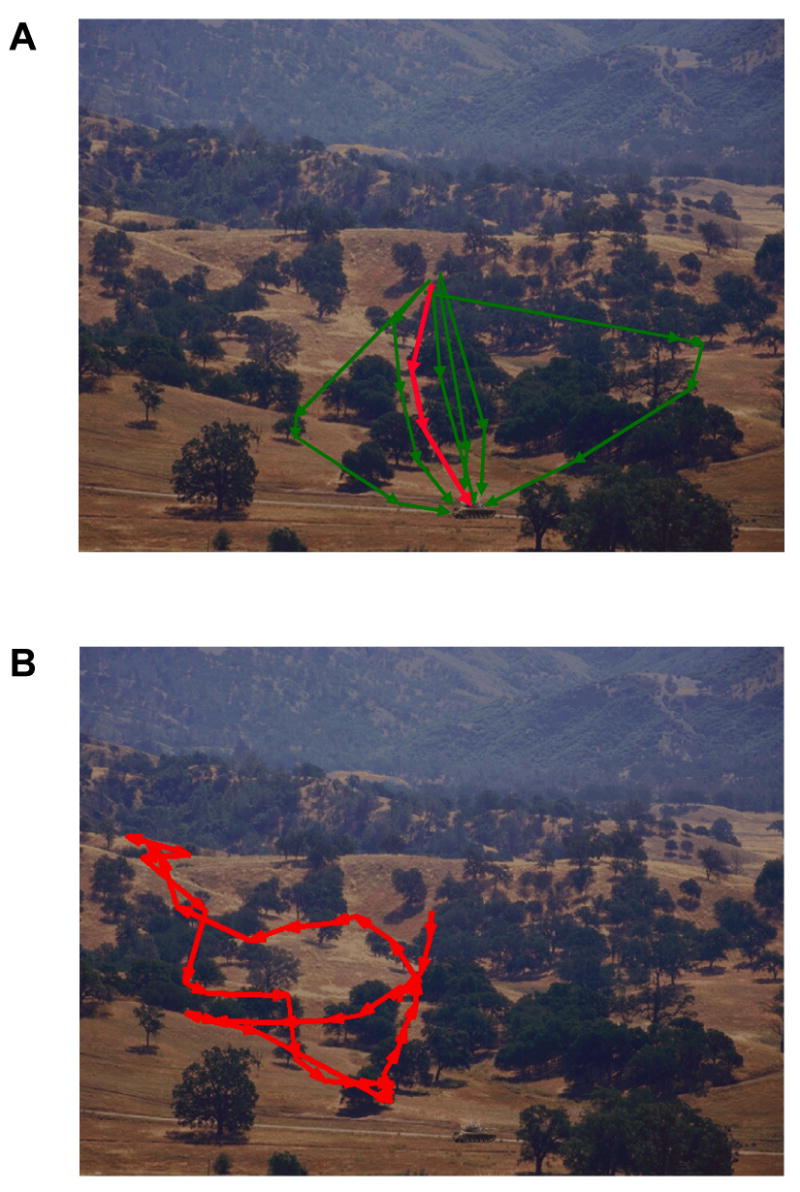
Illustrations of human and model scanpaths for a representative scene from Experiment 1. (A) Scanpaths from 6 observers (thin green arrows) and TAM (thick red arrows) superimposed over the search scene. Note that all converge quickly on the tank target, located near the bottom center of the image. (B) The behavior of a bottom-up model for the same scene. This model used the same GDF filter responses as features, but computed local contrast values between these features to select saccade targets. Note that the target was not acquired in this scene even after 20 eye movements, perhaps due to the dark trees against the light fields and strong cast shadows creating many high contrast regions unrelated to the target.
To better quantify the efficiency of gaze convergence on targets, I computed scanpath ratios (Mannan, Ruddock, & Wooding, 1995) for both observers and TAM. A scanpath ratio was defined as the total scanpath distance, obtained by summing the amplitudes of each saccade made during a trial and dividing by the distance between the target and the center of the image, which in the current experiment corresponds to the minimum distance that the eye would need to travel in order to fixate the target. To the extent that gaze wanders about the display, attracted to non-target regions of the scene, the scanpath ratio would be large. A scanpath ratio of approximately 1 would result from an observer fixating the target directly with their first saccade, and a ratio of 0 would result if there were no saccades on a trial.
Once again, there was reasonable agreement between the behavioral data and TAM using this measure. The average scanpath ratio for observers in this task was 1.26 (± 0.39, 95% CI; SEM = 0.18). The average scanpath ratio for TAM was 0.96, within the 95% CI of the behavioral mean. Note that this value is less than 1 due to TAM's frequent termination of a trial prior to accurate target fixation, thereby making the total saccade distance less than the distance from initial fixation to the target. This is consistent with the fact that final gaze-to-target distances were slightly larger for TAM (m = 1.38°) compared to the observers (m = 1.10°). For comparison, the scanpath ratio obtained for the bottom-up saliency-based model was 34.24, and this value is artificially low as a result of each trial being limited to only 40 fixations. This analysis, when combined with the fixation number and saccade direction analyses, suggests that TAM provides a reasonable characterization of human target acquisition behavior in this realistic search task.
4 Experiment 2: Acquiring Targets in Simple Scenes
The previous experiment had observers search for a single type of target object, a tank. Although the scene within which this object was embedded differed from trial to trial, the appearance of the target in each scene, its size, shape, orientation, color, etc., remained constant. If the filter-based representations used by TAM happened to be particularly well-suited to a target having these specific features, then the high level of agreement between model and human reported in Experiment 1 may not fairly characterize TAM's limitations.
The realistic scenes used in Experiment 1 also make it difficult to evaluate oculomotor evidence for parallel processing and population averaging in search. The oculomotor system has long been known to use a population of neuronal responses, acting in concert, to code the metrics of saccadic eye movements (McIlwain, 1975, 1982, 1991), and population coding has even been included as a core component in several theories of oculomotor control during search (e.g., Godijn & Theeuwes, 2002; Pomplun, Shen, & Reingold, 2003; Rao et al., 2002; Trappenberg, Dorris, Munoz, & Klein, 2001). Behaviorally, evidence for population coding takes the form of eye movements directed to intermediate locations between objects, rather than directly to individual objects (Findlay, 1982, 1997). A problem arises, however, in trying to study center-of-gravity (COG) fixation tendencies in the context of fully realistic scenes. Because realistic scenes are densely populated with objects, any of which might be a valid potential target, it is difficult to know whether an eye movement was directed to an averaged location between two patterns, or to an individual pattern appearing at this averaged location. To address this problem, Zelinsky et al. (1997) monitored the eye movements of observers as they searched for a realistic target (e.g., a ducky) in simple scenes (e.g., toys in a crib). Objects in these scenes could be easily segmented from the background, making it improbable that observers would choose to inspect a pattern appearing on the background surface. Nevertheless, a clear pattern of COG averaging was found, expressed most prominently in the landing positions of the first and second saccades. These COG fixations were successfully modeled by Rao et al. (2002) using an assumption of coarse-to-fine processing and a centroid averaging method, similar to the method described by Equation 5.
The current experiment was designed to accomplish two goals: first, to determine whether TAM's ability to describe human target acquisition behavior generalizes to other real-world objects, ones varying widely in their visual feature composition; second, to test whether TAM can replicate the COG fixation tendencies reported in Zelinsky et al. (1997) and quantitatively described in Rao et al. (2002). Although the Rao et al model is a theoretical precursor of TAM, the two theories are very different, particularly with regard to the mechanisms used to generate eye movements. The Rao et al model used the successive application of coarse-to-fine spatial scale filters to produce differences in averaging behavior; TAM uses a moving threshold imposed on the target map, and blurring introduced by retinal acuity limitations. Given these differences, it is therefore necessary to demonstrate that TAM is capable of producing COG fixation patterns.
4.1 Behavioral Methods
The stimuli were modified versions of the crib scenes used by Zelinsky et al. (1997). As in the earlier study, scenes depicted 1, 3, or 5 scene-consistent objects arranged on the surface of a baby's crib. The identity of the 10 crib objects (Figure 11A), their sizes (each was scaled to fit snugly within a 2.5° bounding box), and their spatial configurations within each crib scene, were also identical to the stimuli used by Zelinsky et al. (1997).
Figure 11.
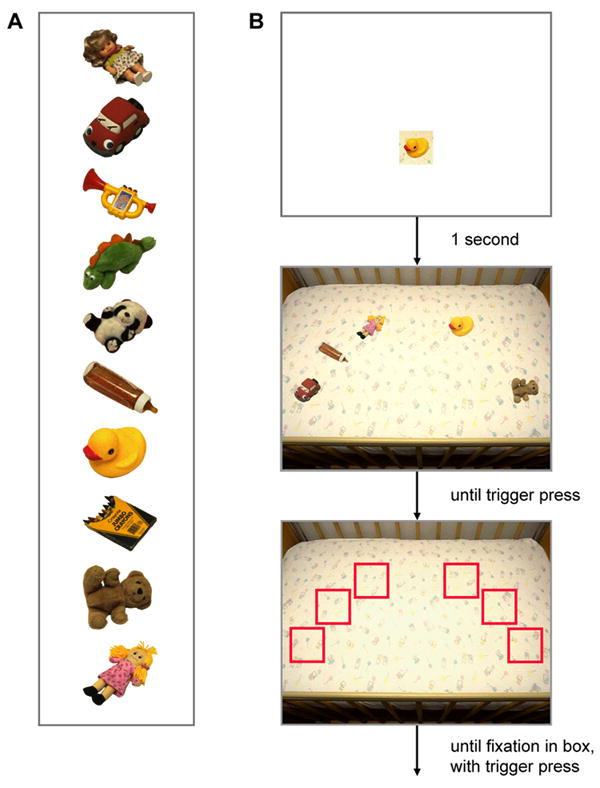
The stimuli and procedure used in Experiment 2. (A) The 10 objects, which were arranged on a crib to form 1, 3, and 5-object scenes. (B) A target preview (top) was followed after 1 second by a search display (middle), which remained visible until the observer determined the location of the target, indicated by a trigger press. This judgment was confirmed by presenting a final localization grid (bottom) and having the observer shift gaze to the box corresponding to the target, while pressing the trigger a second time.
Each trial began with the presentation of a one second target preview, followed by a search display (Figure 11B). The task of the 8 observers was again target localization, meaning that they were instructed to respond, by trigger press, as soon as the target's location was determined. As in Experiment 1 there was no explicit instruction to move gaze to the target, although target acquisition by gaze frequently accompanied the target localization judgment. Unlike Experiment 1 target localization success was explicitly assessed using a response grid. Following the manual target localization judgment, a grid was displayed consisting of red frames at each of the allowable object locations, superimposed over the emptied (i.e., no objects) background crib surface. The observer had to fixate inside the frame corresponding to the target's location, then make a second manual trigger response. See the Appendix for additional methodological details.
4.2 Computational Methods
As in Experiment 1, the preview and search images input to the model were identical to the images viewed by observers in the behavioral experiment. For consistency, coordinate (80, 81), roughly corresponding to the center of the target object, was selected as the TV point (Section 2.1.3) in each target preview image. TAM's simulated fovea was set to coordinate (640, 638) in the search image at the start of each search trial. This coordinate corresponded to the average location in the search display where observers were fixated at the end of the target preview. All other computational methods, including all settings of model parameters, were identical to those used in Experiment 1.
4.3 Results and Discussion
4.3.1 Target Acquisition Accuracy
Targets were localized with 100% accuracy by all 8 observers, as measured by gaze being within the target frame of the response grid at the moment of the second trigger press.10 This high accuracy was expected given the ease of the localization task, however the task's ease also resulted in more variable acquisition behavior during the presentation of the search scenes. Specifically, the average gaze-to-target distance at the time of the first trigger press was 2.43° (± 0.74°, 95% CI), larger than in Experiment 1. This was due in part to observers occasionally responding without making an eye movement, which occurred on 11% of the trials. These no-movement trials suggest that observers preferred to shift their gaze on the vast majority of trials, even though this target localization task did not require an eye movement.
As was the case in Experiment 1, TAM's target acquisition mimicked the behavioral patterns. Targets were successfully acquired in all 60 of the search scenes, as measured by the trial ending (i.e., above-threshold) correlation appearing within the target's bounding box on each final target map. TAM's gaze-to-target distance at the moment of trial termination averaged 2.8°. This terminal distance was slightly higher than the behavioral value, although still well within the 95% CI of the behavioral mean. Interestingly, TAM, like the observers, acquired the target without an accompanying gaze shift on 15% of the trials. Closer analysis of these 9 no-movement trials revealed that they were not distributed evenly over the 10 target types. Rather, the target on 6 of these trials was the panda bear; the remaining 3 trials were divided between the box of crayons (2) and the rag doll (1). Performing the same analysis on the behavioral data revealed a strikingly similar pattern. Although no-movement trials were distributed more evenly over the 10 target types, there was one notable exception–the panda bear was the search target on 36% of these trials. It is not clear why observers and TAM found it less necessary to make an eye movement to the panda bear target. Perhaps the high contrast of the panda bear contributed to this behavior by increasing the object's distinctiveness. What is clear is that, once again, human and model behaved similarly in their acquisition of search targets, both in terms of accuracy of localization as well as more fine-grained measures, such as the specific targets that did not elicit an eye movement. With regard to the experiment's motivating question, whether TAM's capacity for target acquisition will generalize over targets, that answer is also clear; TAM is able to acquire a range of visually diverse targets, with some targets acquired more efficiently than others.
4.3.2 Center-of-Gravity Averaging
Can TAM describe the center-of-gravity fixation tendency reported by Zelinsky et al. (1997)? Figure 12 plots the first, second, and final saccade landing positions, collapsed across set size. Each panel shows the behavioral data from 4 of the 8 observers, along with the corresponding data from the model. Initial saccade landing positions (top) showed clear evidence for COG averaging from both the observers and TAM. Initial saccade endpoints tended to cluster near the center of the scenes, despite the fact that no objects ever appeared at this central location. Approximately 86% of the initial saccades from observers landed within 3° of the image center, compared to 90% of the initial saccades from TAM. This averaging response started to break down by the second saccades (middle), and disappeared entirely by the final saccades (bottom) as gaze converged on specific targets. Second saccades landing within 3° of the image center dropped to 55% and 78% for the behavioral and simulated data, respectively. Only 8% of the final saccades made by observers landed within 3° of the image center; TAM made final saccades landing this close to the image center on 11% of the trials. To show that this oculomotor divergence from the image center corresponded to convergence towards the target, I calculated the average distance between the target and each saccade landing position for trials having at least one eye movement. As expected, this measure of endpoint error was largest after the first saccade (5.46° human, 6.0° TAM), smaller after the second saccade (3.85° human, 4.7° TAM), and smaller still after the final saccade (1.44° human, 1.99° TAM).
Figure 12.

The spatial distribution of first (top), second (middle), and final (bottom) saccade landing positions for human observers (green squares) and TAM (red triangles) in Experiment 2. Data points are plotted in degrees of visual angle relative to the center of the display; white squares correspond to where objects appeared in the scenes. Behavioral data are shown for only 4 observers (for clarity), and all eye movements occurred before the initial button press terminating the search display. Note that final fixations are shown only for those trials having more than two eye movements, so as not to duplicate previously plotted data.
The Figure 12 data patterns replicate substantially the behavioral patterns reported in Zelinsky et al. (1997) and the computational patterns reported in Rao et al. (2002).11 Behaviorally, overt search started off broadly distributed over the scene, followed by a steady convergence over time to the target. This pattern of convergence is reminiscent of processing suggested by zoom lens models of attention (e.g., Downing & Pinker, 1985; Eriksen & St. James, 1986). The fact that the first saccade was influenced by global properties of the scene, implied by the existence of COG averaging, suggests an initially parallel distribution of processing that encompasses much of the search display. Likewise, the steady movement towards objects with each successive eye movement, and the eventual fixation of the target, suggests a constriction of search over time to a region surrounding only the target object. Computationally, these COG fixations are likely the behavioral expression of population coding of saccade target positions by the oculomotor system (Findlay, 1987; van Opstal & van Gisbergen, 1989). In the context of TAM, activity on the target map represents a population code, with the spatial averaging of this activity producing the COG fixation behavior. As for TAM's tendency to spatially align its fovea with the target over time, this behavior is a byproduct of the temporal threshold applied to the target map. If an eye movement is programmed early in the search process, the low threshold will allow many points to appear on the target map, which when averaged would suggest an eye movement close to the center of the image (e.g., Figure 4, bottom). As the threshold increases over time, less likely target candidates drop out of this centroid computation, resulting in a narrowing of the search decision and a steady convergence of gaze towards the target.
4.3.3 Number of Fixations
The number of eye movements by observers in this task averaged 2.2 for 1 object displays, 3.4 for 3 object displays, and 4.1 for 5 object displays, (slope = 0.49 fixations/object; ± 0.099, 95% CI), a linear trend that also characterized their manual RTs (802 ms, 1085 ms, and 1352 ms, for 1, 3, and 5 object displays, respectively, F(2,21) = 14.21, p < .001). Observers made slightly more eye movements than objects at the smallest set size, and slightly fewer eye movements than objects at the largest set size. TAM made an average of 2.6, 3.3, and 4.6 eye movements in the 1, 3, and 5 object displays, respectively. These data also produced a slope of 0.49 fixations/object, capturing the linear trend observed in the behavioral data.
To summarize, the same model that acquired targets in fully realistic scenes (Experiment 1) was shown to also describe several additional aspects of human target acquisition behavior in the context of variable targets arranged into simple scenes. Without the need for any parameter adjustments, TAM reproduced the pattern of COG eye movement behavior and oculomotor target convergence originally reported in Zelinsky et al. (1997), as well as the number of fixations by observers to acquire these targets at multiple display set sizes. TAM even captured surprisingly subtle aspects of human target acquisition behavior, such as the detection of a particular target type (the panda bear) in the absence of eye movement.
Although it is unclear how TAM compares to other general purpose image-based models of target acquisition, it is doubtful whether existing approaches would yield a better agreement with human behavior across the range of measures considered here, at least not without substantial parameter fitting. The Rao et al. (2002) model is perhaps the strongest competitor in this regard, which until now has been the only implemented image-based model of eye movements during search able to account for COG fixations. TAM retains this strength of the Rao et al. model while correcting some of its weaknesses, many of which were identified in Navalpakkam & Itti (2005). As already discussed, gaze allocation under the Rao et al model is determined by the sequential application of coarse-to-fine spatial scales; the number of scales used in the representation therefore imposes a fixed upper limit on the number of eye movements that can be generated. This constraint on the saccade generation process has important consequences for that model's ability to capture the considerable trial-to-trial variability in fixation number that exists during search. No such limit on the number of eye movements is imposed under the current approach. Indeed, on one trial simulated gaze was initially attracted to a clump of 3 objects appearing in the left half of the image when the actual target appeared in the lower right, resulting in 15 eye movements. As for comparison to the Itti and Koch (2000) model, because this model has gaze jump from salient point to salient point it would not describe any of the COG averaging behavior or oculomotor convergence towards objects illustrated in Figure 12.
5 Experiment 3a: Acquiring an O Target among Q Distractors
So far, target acquisition has been discussed in the context of visually complex real-world objects, a tank in Experiment 1 and an assortment of toys in Experiment 2. This focus on realistic objects is appropriate given that the modeling component of this investigation can accommodate such patterns, which is not typically the case in the search literature. However, in order to relate the current approach to existing search studies, it is necessary to determine TAM's response to stimuli more familiar to the basic search community. Towards this end, the final series of experiments will explore target acquisition behavior in a standard OQ search task (Treisman & Gormican, 1988; Treisman & Souther, 1985).
Ironically, the most challenging test of a general purpose model of target acquisition may not be real-world objects in visually complex scenes, but rather a task defined by simple geometric patterns. Two factors make this so. First, whereas a real-world target is typically visually very dissimilar to the other patterns in a scene, targets and distractors in many basic search experiments are often highly similar. Only the tail of the Q distinguishes this element type from an O, creating a potentially challenging discrimination task, more so than telling apart a teddy bear from a rubber ducky. If a model is incapable of making fine visual discriminations (which may consist of only a handful of pixels), or discriminations restricted to only a single feature dimension (e.g., orientation), these limitations will be best revealed in the context of simple geometric stimuli. Second, the alignment of gaze with a target is only a single behavioral characterization of target acquisition, albeit a defining one. However, the basic search literature has adopted other criteria for evaluating a search theory. Rather than focusing on how a target is acquired (i.e., the individual gaze movements leading up to acquisition), this literature has focused on the factors affecting target acquisition and detection (Treisman, 1988; Wolfe, 1998a). Several such factors have been identified, ranging from straightforward relationships between search efficiency and the number of distractors in a display (the set size effect) or the distance of a target from initial fixation (the eccentricity effect), to more complex factors, such as the impact of swapping the roles of targets and distractors (the search asymmetry effect) and the similarity relationship between these element types (the target-distractor similarity effect). Theories are therefore evaluated in terms of their ability to describe a constellation of search constraints, with each successfully described relationship providing converging evidence for that particular theory. In the context of a general purpose model, a useful theory of target acquisition should therefore not only be able to describe how a target is acquired, it should also be able to account for many, if not all, of the constraints on this acquisition process identified in the basic search literature. To the extent that TAM is successful in achieving these two goals, yet is still able to work for stimuli ranging in complexity from simple geometric patterns to fully realistic scenes, it might be reasonably described as a relatively general purpose model of target acquisition.
5.1 Behavioral Methods
Six observers searched for an O target among Q-like distractors in 9, 13, or 17-item search displays (Figure 13). Search elements were positioned pseudo-randomly in the 180 displays (see the Appendix for additional methodological details) except for the target, which was always present and constrained to appear equally often at one of two initial visual eccentricities, 4.2° or 8.4° from starting fixation.
Figure 13.
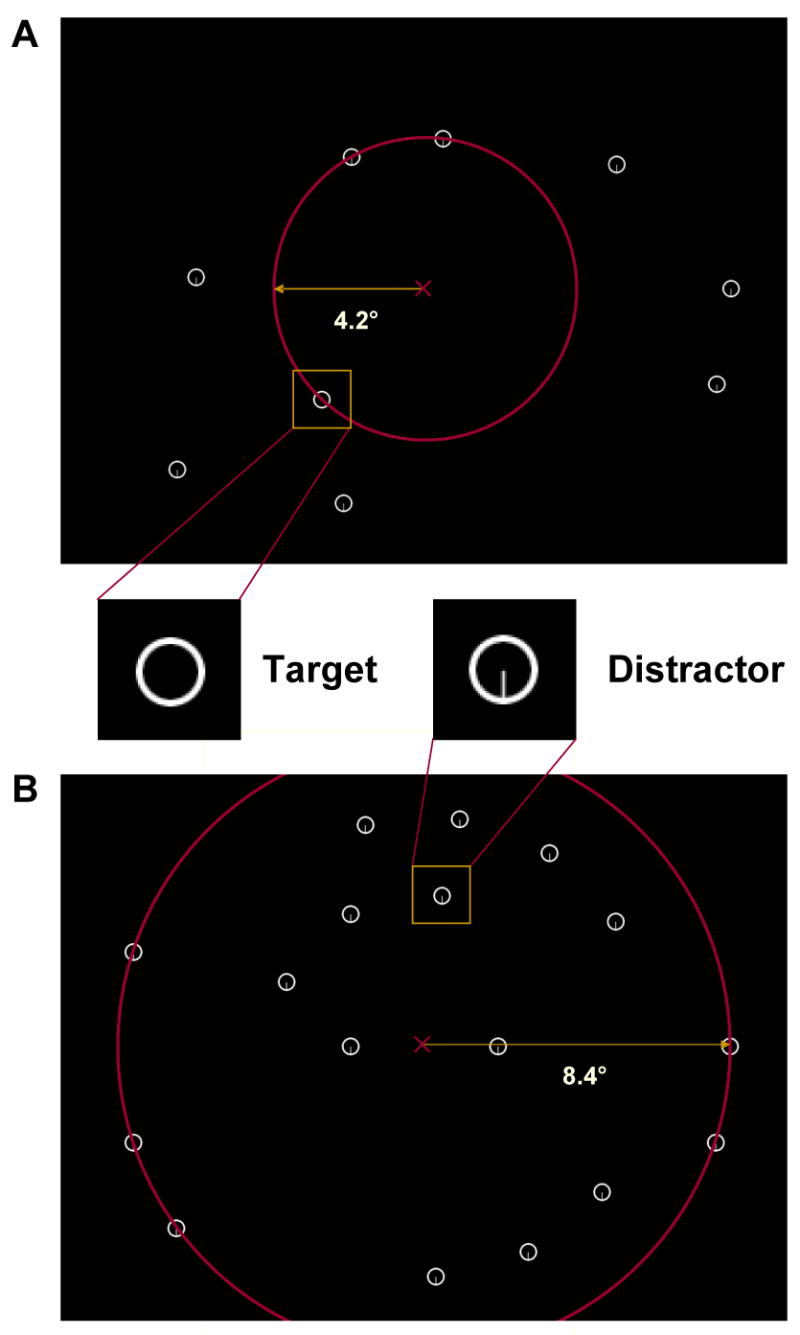
The stimuli used in Experiment 3a, shown to scale. (A) A 9-item display showing a target in the Near eccentricity condition. (B) A 17-item display illustrating the Far eccentricity condition. See Figure 5 (top) for an example of a 13-item display.
Each trial began with the presentation of a central fixation cross, followed by a search display. There was no target preview. Observers were instructed to search for an O target and to respond, by pressing a trigger with the index finger of their preferred hand, once the target was localized. As in Experiment 2, localization accuracy was assessed using a target localization grid. Upon response, the search display was replaced with a grid showing a white square frame (0.97°) at the location of each search item. The observer had to select the frame in this display that corresponded to the search target. They did this by fixating on the desired frame, an event which caused the frame to turn red, then pressing a trigger a second time. This second manual response caused the fixation cross to be re-displayed, after which the next trial could be initiated. No feedback was provided during the experiment.
5.2 Computational Methods
As in Experiments 1 and 2, TAM searched the identical 180 1280×960 pixel images presented to observers. The same parameter settings used previously were also used here, with the following exception. The TV point (Section 2.1.3) in the first two experiments corresponded to the midpoint of the target object. However, the target in this experiment was an O, meaning that the midpoint did not actually fall on the object. To determine a location in the target image to use as a TV point, I conducted a pre-test in which estimates of an optimal target point were collected from human observers. As part of a class lecture, 37 undergraduate students from Stony Brook University were provided with a sheet depicting enlarged views of the O and Q-like elements, arranged side-by-side (O left, Q right; Figure 14A), and asked to indicate: “Which point on the left pattern would allow you to most easily differentiate it from the right pattern?” These responses were then hand-coded and x,y coordinates were obtained in the 31×31 pixel image space defining the target. As can be seen from Figure 14A, these estimates clearly clustered at the bottom-center of the target pattern, indicating that this is the location on an O that enables maximal differentiation from a Q, according to the observers tested. This is not surprising given that the two patterns are identical except for the vertically oriented tail of the Q, and that the bottom-center position on the O is the point nearest to this vertical feature. Calculating the mode of these estimates (m = 12) yielded a target image coordinate of (15, 29), which TAM used as the TV point.
Figure 14.
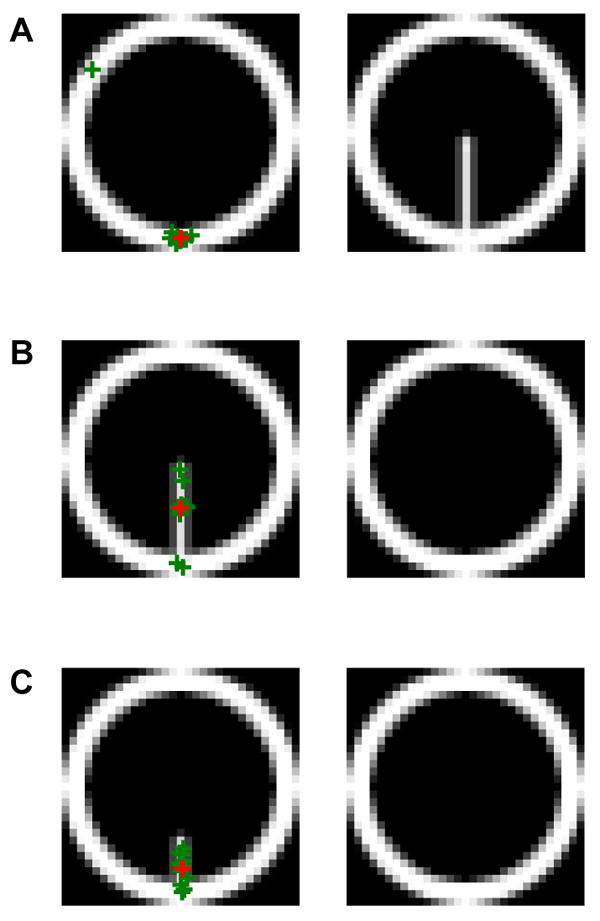
Procedure used to select TV points in Experiment 3. Each panel shows the two stimuli presented to participants, who were instructed to indicate: “Which point on the left pattern would allow you to most easily differentiate it from the right pattern?” Green crosses indicate individual responses; the red crosses indicate the modal positions, which were used as the TV points in the corresponding computational experiments. (A) Experiment 3a. (B) Experiment 3b. (C) Experiment 3c.
5.3 Results and Discussion
5.3.1 Target Acquisition Accuracy
Targets were correctly localized with 99.3% accuracy, as measured by the selection of the target frame in the localization grid. Incorrect localization trials were discarded from further analysis. Unlike Experiment 2, this high level of localization accuracy was not accompanied by a large gaze-to-target distance at the moment of the trigger press terminating the search display. Final gaze-to-target distances in the 9, 13, and 17-item conditions averaged 0.84°, 0.97°, and 0.88°, respectively. TAM's average gaze-to-target distances were 0.45°, 0.50°, and 0.54° in the corresponding set size conditions, values all within the 95% CI of the behavioral means. These relatively small distances suggest that observers in this task, human and model alike, found the O-in-Q discrimination to be challenging, but ultimately achievable. More interesting is that TAM adopted a very human-like solution to this discrimination challenge; fixate the target carefully so as to minimize peripheral blur and the potential for a false positive judgment.
5.3.2 Set Size and Number of Fixations
The set size effect, the decrease in search efficiency that often accompanies an increase in the number of distractors, is characterized in this study primarily in terms of the number of fixations needed to acquire a target as a function of the number of display items. These data are shown in Figure 15A for individual participants (thin green functions) and averaged over observers (thick blue-green function). The set size effect is illustrated by the rising slope of the Fixation × Set Size function; on average observers made 0.43 additional fixations for each item added to the display. However, this relationship between fixations and set size is clearly non-linear. Observers made more fixations to the 13-item displays compared to the 9-item displays, t(5) = 4.58, p < .01, but the number of fixations did not significantly increase between the 13-item and 17-item conditions, t(5) = 1.19, p > .05. Indeed, half of the observers showed either a flat or decreasing slope over this range of the Fixation × Set Size function. A similar decelerating trend was observed in manual target localization times, which averaged 1734 ms, 2224 ms, and 2358 ms, for the 9, 13, and 17-item displays, respectively. As in the case of fixation number, RTs differed significantly between 9-item and 13-item displays t(5) = 18.32, p < .001, but not between 13-item and 17-item displays, t(5) = 2.35, p > .05. This close parallel between the fixation number and manual RT data was expected given the high correlation typically observed between these dependent measures (Zelinsky & Sheinberg, 1995, 1997).
Figure 15.

Number of fixations in Experiment 3a, plotted as a function of set size. The thin green functions show data from individual observers, and the thick blue-green functions indicate averages across participants. The error bars indicate one SEM. Data from TAM are indicated by the thick crimson functions. Note that all averages include the initial and final fixations made on a trial. (A) Data averaged across eccentricity condition. (B) Data from the Near eccentricity condition. (C) Data from the Far eccentricity condition.
TAM's behavior is shown in Figure 15A by the thick, crimson function. TAM required 8.2, 12.8, and 12.5 fixations to locate targets in the 9, 13, and 17-item displays, respectively. Interestingly, it showed the same decelerating trend that characterized the average behavioral data, and described almost perfectly the behavior from three of the observers. As in the case of these observers, there was a steep increase in the number of fixations between 9 items and 13 items, but no additional increase between 13 items and 17 items. The reason for this non-linear set size function will be discussed in the following section.
Representative samples of human and model behavior are shown in Figures 16A and 16B for typical 9-item and 17-item displays. Clearly, TAM did not behave in a patently artificial or unnatural manner, and its scanpaths generally matched a corresponding scanpath from at least one of the observers (as shown). As for the close agreement between TAM and a subset of the observers with respect to the Fixation × Set Size function, this may have resulted from TAM's use of two processes known to be important in the production of human set size effects. First, TAM has retinal acuity limitations (Section 2.1.2). Just as human observers need to look directly at a pattern in order to make a fine discrimination (e.g., Engel, 1971, 1977), so too for TAM. This acuity limitation imposes a serial constraint on gaze behavior in this target acquisition task. TAM's artificial fovea is forced to visit (albeit imperfectly) individual display items, meaning that the number of fixations will tend to increase with the number of items in the display. Second, TAM's gaze is discouraged from returning to previously inspected distractors by an inhibition of return process (Section 2.4.1). Human observers rarely shift their gaze back to previously inspected distractors during search (e.g., Dickinson & Zelinsky, 2005), and when refixations do occur they are typically to the last distractor that was fixated, a behavior that may reflect incomplete item processing rather than a search process (Hooge & Erkelens, 1999). By using IOR, TAM is able to produce a human-like set size effect in that the repeated inspection of items is discouraged, thereby resulting in a more efficient and complete inspection of the entire display.
Figure 16.
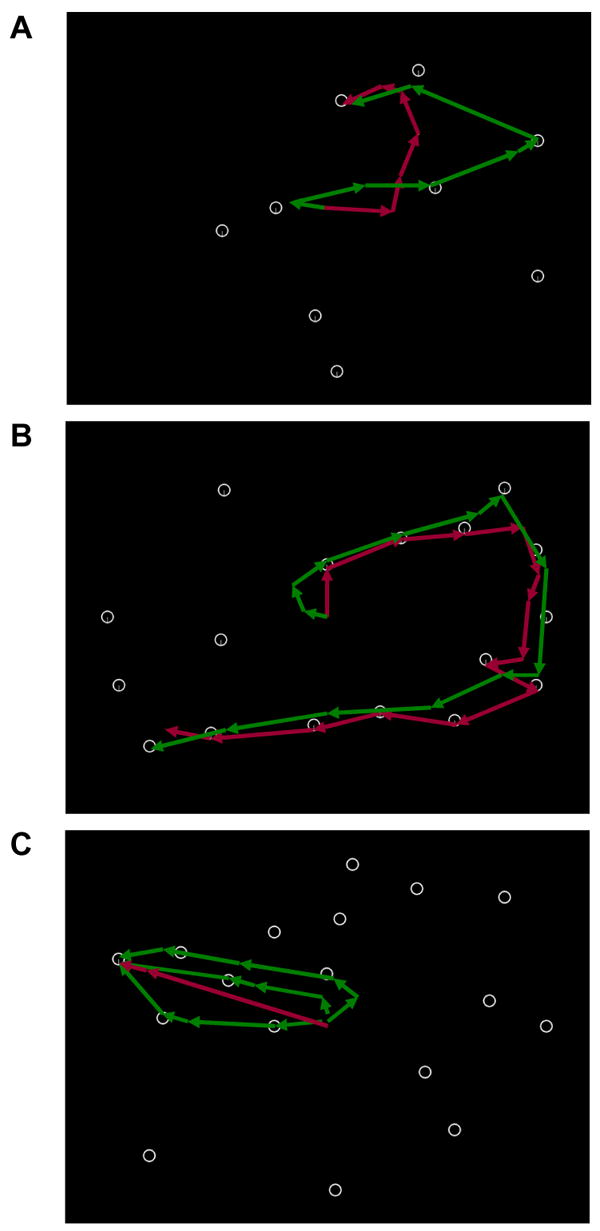
Scanpaths from human observers (green arrows) and TAM (red arrows). (A) A 9-item display from Experiment 3a. (B) A 17-item display from Experiment 3a. (C) A 17-item display from Experiment 3b. Note that individual differences in behavior were generally less in the pop-out task, resulting in more consistent scanpaths.
5.3.3 The Eccentricity Effect
A search eccentricity effect refers to the observation that target detection becomes more difficult the farther targets appear from starting fixation (Carrasco & Frieder, 1997; Carrasco & Yeshurun, 1998; see also Engel, 1977, and Scialfa & Joffe, 1998, for reports of eccentricity effects in overt search tasks). In the current context, targets in the Near condition (4.2°) should be detected more efficiently and acquired sooner than targets in the Far condition (8.4°). The data confirmed this expectation. Figures 15B and 15C re-plot the data from Figure 15A, grouping these data by Near and Far conditions. An eccentricity effect appears in the form of shallower Fixation × Set Size slopes in the Near condition relative to the Far condition, t(5) = 2.82, p < .05. When targets appeared 4.2° from initial fixation, observers averaged 0.29 fixations per display item; the number of fixations per item increased to 0.57 when targets appeared 8.4° from fixation. However, this 0.28 fixations/item effect of eccentricity is misleading, and masks sizeable individual differences in the relationship between target eccentricity and set size. The observers corresponding to the three bottommost individual data functions produced highly linear set size effects with very similar slopes in the Near and Far target conditions, resulting in almost no eccentricity effect (0.07 fixations/item). The three topmost individual observer functions tell a different story. Set size effects in the Far target condition were again relatively linear, but very steep (0.74 fixations/item, ± 0.23, 95% CI). Set size effects in the Near target condition were much shallower (0.25 fixations/item, ± 0.14, 95% CI) and highly non-linear, with the number of fixations actually decreasing from 13 items to 17 items. These Near and Far data patterns yielded for these three observers a very large effect of eccentricity, 0.49 fixations/item.
TAM also produced a large eccentricity effect (0.50 fixations/item), with its behavior again mimicking the behavior from the topmost three observers from Figure 15. The slope of the regression line fit to the Far target data was 0.78 fixations/item; the slope of the Near target Fixation × Set Size function was a shallower 0.28 fixations/item. Both means were well within the 95% CI for the comparable behavioral subgroup. Also similar to this group of observers was the was highly non-linear set size effect in the Near target condition. TAM averaged 6.9 fixations to near targets in 9-item displays and 11.0 fixations to near targets in 13-item displays, resulting in a slope of near unity. A different relationship characterized TAM's response to 17-item displays, as only 9.1 fixations were made to near targets. Increasing set size beyond 13 items resulted in fewer fixations to near targets, not more.
Although one can only speculate as to why half the human observers produced a pattern of rising, then falling, fixations with increasing set size, TAM's behavior is more transparent. When a display is relatively sparse, as was the case in the 13-item set size condition, TAM's initial movement of gaze is likely to be attracted by a clump of distractors appearing in the periphery. In the Near target condition this is suboptimal behavior; the target is already near central fixation but gaze is drawn to a potentially distant peripheral location. However, when a display is more densely populated, as in the 17-item set size condition, there are fewer isolated clumps of distractors that might attract gaze; the configuration of items is overall more balanced and stable. Rather than pulling gaze away from initial fixation, COG averaging now works to hold gaze at the display's center, thereby increasing the probability of detecting near targets. The decrease in number of fixations between 13-item and 17-item displays can therefore be explained as an emergent property of a population averaging model of saccade generation, and the relationship between set size and the spatial statistics of objects in a display. To the extent that human behavior is governed by a similar dynamic, TAM might explain the comparable pattern produced by half of the observers in this task. As yet, no satisfying explanation exists for the appearance of a second, qualitatively different pattern in the behavioral data. One might speculate that these observers were less susceptible to having their gaze drawn to peripheral locations, but addressing such individual differences at this level of detail was beyond the scope of this study.
6 Experiment 3b: Acquiring a Q Target among O Distractors
In Experiment 3a, TAM was shown to produce the hallmark decrease in search efficiency (as measured by number of fixations) that accompanies the addition of items to a display. It was also shown to reproduce, at least for half of the observers tested, a more subtle relationship between set size and the eccentricity of a search target.
Not all search tasks, however, produce a set size effect. Some targets can be detected regardless of how many distractors share the display, resulting in very shallow or flat RT × Set Size functions. These are often described as “pop out” search tasks, in reference to the target seemingly popping out of the distractors and into awareness. Determining the stimuli and conditions under which targets pop out is an old, yet important goal of the visual search community (Treisman & Gelade, 1980; Treisman & Gormican, 1988). Pop out implies a parallel process, one that can be applied simultaneously to multiple items in a search display. By looking for commonalities among pop out tasks, it may be possible to isolate the visual features and operations that are preattentively available to search.
A particularly interesting class of search tasks can produce steep or shallow slopes simply by switching the roles of targets and distractors. These are called search asymmetry tasks, and the O and Q items used in Experiment 3 are one example of asymmetric search stimuli. Searching for an O target among Q distractors is typically inefficient. Indeed, the search slope in Experiment 3a was a steep 78 ms/item. However, the search for a Q among O distractors typically results in a near flat search slope, hence the asymmetry.
The existence of search asymmetries poses a unique challenge to theories of search that appeal to the visual similarity between targets and distractors (Treisman, 1991). This is particularly true of TAM, which uses linear spatial filters and correlation (a symmetrical operation) to compute a measure of similarity. All things being equal, a similarity estimate obtained for an O and a Q should be the same as one obtained for a Q and an O. A theory based solely on such similarity estimates should therefore have difficulty describing the expected changes in search efficiency accompanying the reversal of targets and distractors in this search asymmetry task. If this is indeed the case, a potentially serious weakness of the method might be revealed (see also Medin, Goldstone, & Gentner, 1990, 1993).
6.1 Behavioral Methods
The behavioral methods for this experiment were identical to the descriptions provided for Experiment 3a, with the following exceptions. First, the same 6 observers from Experiment 3a were instructed to search for a Q target among O distractors, rather than the reverse. Second, each item in every Experiment 3a display was replaced with an item from the other element type. Every O target was therefore replaced by a Q, and every Q distractor was replaced by an O. Note that this replacement method preserved the spatial locations of items in each display; any change in TAM's behavior from Experiment 3a to Experiment 3b can therefore not be attributed to different spatial configurations of items.
6.2 Computational Methods
The computational methods described for Experiment 3a were also applied to the current experiment, except for the selection and use of a different TV point (Section 2.1.3). The same 37 student raters who judged the point on an O that best differentiated it from a Q (Figure 14A) were also asked to pick the point on a Q that best differentiated it from an O. This was done by simply reversing the left/right order of the two patterns (Figure 14B) while keeping the identical instructions: “Which point on the left pattern would allow you to most easily differentiate it from the right pattern?” The patterns used for each comparison task were printed on a separate sheet of paper and distributed to students at the same time, meaning the order in which patterns were rated was uncontrolled.
Comparing the individual judgments from Figures 14A and 14B reveals a dramatic effect of reference pattern on ratings. Whereas raters choosing the point on an O that best differentiates it from a Q tended to select a bottom-center location, the same raters choosing the point on a Q that best differentiates it from an O tended to select a location on the Q's tail. Perhaps unsurprisingly, only a handful of raters in the QO comparison task selected the bottom-center location preferred in the OQ comparison task. Most instead selected points on the tail of the Q for which there were no counterparts on the O, a reasonable behavior given that these non-overlapping points could be used to easily tell one pattern from the other. As in Experiment 3a, these ratings were coded and the mode (m = 8) was selected as the TV point, which was coordinate (15, 23) in this experiment.
6.3 Results and Discussion
6.3.1 Target Acquisition Accuracy
The target was correctly localized on 100% of the trials, by both observers and TAM. As in Experiment 3a, target localization accuracy for observers was measured by their selection of the target frame from a localization grid. TAM was counted as having located the target if the trial-ending correlation on the target map corresponded to the target's location, which was invariably the case.
Given the ease of this localization task, it was expected that observers would often make their initial localization judgment (the one terminating the search display) without shifting gaze to the target. This proved not to be the case, as at least one eye movement was made on 98% of the trials. Targets were also accurately acquired in this task. Average gaze-to-target distance at the moment of search display termination was only 0.77°, comparable to the average terminal gaze-to-target distance reported for the more challenging task described in Experiment 3a, t(5) = 0.75, p > .10. Observers overwhelmingly chose to fixate the target regardless of whether they were attempting to localize the O or the Q.
TAM behaved similarly. The average terminal gaze-to-target distance was 0.71°, nearly identical to what was found in the behavioral data. Interestingly, TAM also made at least one eye movement on every trial. Although TAM is capable of terminating a trial without shifting gaze to the target, it did not show this behavior in this task. The reason for this can be traced back to the difficulty of the OQ discrimination. The thinness of the Q's tail, combined with blurring introduced by the artificial retina, caused the target correlation at the start of the trial (i.e., initial fixation) to be just below the target detection threshold (∼ 0.86). TAM therefore had to make an eye movement to the target so as to be certain that it was a Q, presumably the same reason that human observers also chose to fixate the target in this task.
6.3.2 Number of Fixations
The average number of fixations are indicated by the bottom two functions in Figure 17A, for observers (blue-green function) and the model (crimson function). Observers managed to acquire the Q targets with a high degree of efficiency, needing an average of only one additional eye movement in the 17-item displays compared to the 9-item displays. This set size effect, although shallow (0.11 fixations/item), was significantly different from zero, t(5) = 5.62, p = .001. The manual RT expression of this set size effect, 1204 ms, 1318 ms, and 1310 ms in the 9, 13, and 17-item conditions, was also shallow (13 ms/item) but different from zero, t(5) = 3.66, p = .007. Taken together, these data suggest a borderline pop out level of performance; the acquisition of Q targets was relatively immediate and largely independent of the number of distractors in the display.
Figure 17.

Number of fixations in Experiment 3b, plotted as a function of set size. Average behavioral data are indicated by the thick blue-green functions; individual observer data are indicated by the thin green functions; data from TAM are indicated by the thick crimson functions. Error bars indicate one SEM. (A) Evidence for a search asymmetry. Set size functions for the Experiment 3b task (Q target, bottom two functions) shown with data re-plotted from the Experiment 3a task (O target, top two functions). (B) Data from the Experiment 3b Near eccentricity condition. (C) Data from the Experiment 3b Far eccentricity condition.
Perhaps surprising for a pop out task, the number of fixations to the target varied with target eccentricity. The slope of the Fixation (RT) × Set Size function was 0.07 fixations/item (12 ms/item) for Near targets (Figure 17B) but 0.15 fixations/item (16 ms/item) for Far targets (Figure 17C), a small but marginally significant difference, t(5) = 2.33, p = .07. The existence of this eccentricity effect, however, does not mean that targets failed to pop out in the Far target condition, or even that the pop out phenomenon was perceptually diminished. Indeed, the eccentricity effect in RTs failed to reach significance, t(5) = 0.38, p > .10. All that can be concluded from this difference is that, on average, slightly more eye movements were used to acquire far targets than near targets, which might reflect normal hypometria often observed in saccades to distant targets (e.g., Findlay, 1997).
As shown in Figure 16C, TAM again generally agreed with the human behavior. This agreement, however, was not perfect. When averaged over set size, TAM used only 2.67 fixations (1.67 eye movements) to acquire the target; observers used 5.62 (± 0.91) fixations, a difference outside the 95% CI. TAM was apparently able to acquire Q targets more directly than humans. However, the slope of the simulated Fixation × Set Size function was 0.065 fixations/item, similar to the behavioral data (0.11 ± 0.05 fixations/item). This minimal set size effect also interacted with target eccentricity; the model acquired near targets (0.01 fixations/item) more efficiently than far targets (0.11 fixations/item). TAM therefore again captured the behavioral relationship between set size and target eccentricity, in addition to reproducing the overall shallow set size effect characteristic of human behavior in this task.
6.3.3 The Search Asymmetry Effect
Comparing the Q target data from Experiment 3b (Figure 17A, bottom two functions) with the O target data from Experiment 3a (Figure 17A, top two functions) yields clear evidence for a search asymmetry. The behavioral Fixation × Set Size slope in the Q-in-Os localization task was shallower than the comparable slope in the O-in-Qs localization task, t(5) = 6.35, p = .001. Evidence for a search asymmetry in the simulated data is equally clear. TAM acquired Q targets far more efficiently than it did O targets, with the slopes of these Fixation × Set Size functions both being within the 95% CI of the corresponding behavioral means. These search asymmetries can also be visualized by comparing the scanpaths in Figures 16A and 16B to those in Figure 16C.
Of more theoretical importance is the question of why TAM showed a search asymmetry? As already discussed, its underlying computations are symmetrical, so one might expect similar behavior in the O-in-Qs and Q-in-Os localization tasks. The reason why this didn't happen can be traced back to TAM's parameters in the two tasks, which were not quite identical. Although all of the internal modeling parameters were the same, recall that two different TV points were used in the two tasks. In the O-in-Qs task TAM coded the target based on a bottom-center point on the O pattern; in the case of the Q-in-Os task TAM's target representation focused on the Q's tail segment. These two different target codes produced very different target maps. Figure 18A shows a typical target map in the Q-in-Os task, and Figure 18B shows the corresponding target map from the O-in-Qs task. Both target maps reflect a central gaze position, before TAM's first eye movement. Note the clear differences in both signal and noise in these two task representations. The Q target map indicates relatively weak correlations at the distractor locations (low noise), and the correlations corresponding to the vertical segment in the target pattern are quite high (high signal). The correlations indicating the O target are also quite high, but so too are those at all of the distractor locations (high noise). These different target representations, and the resulting differences in the target maps, are ultimately responsible for TAM's expression of a search asymmetry. What this means is that, assuming task-specific target coding, even a computationally symmetric model can produce asymmetric search behavior.
Figure 18.
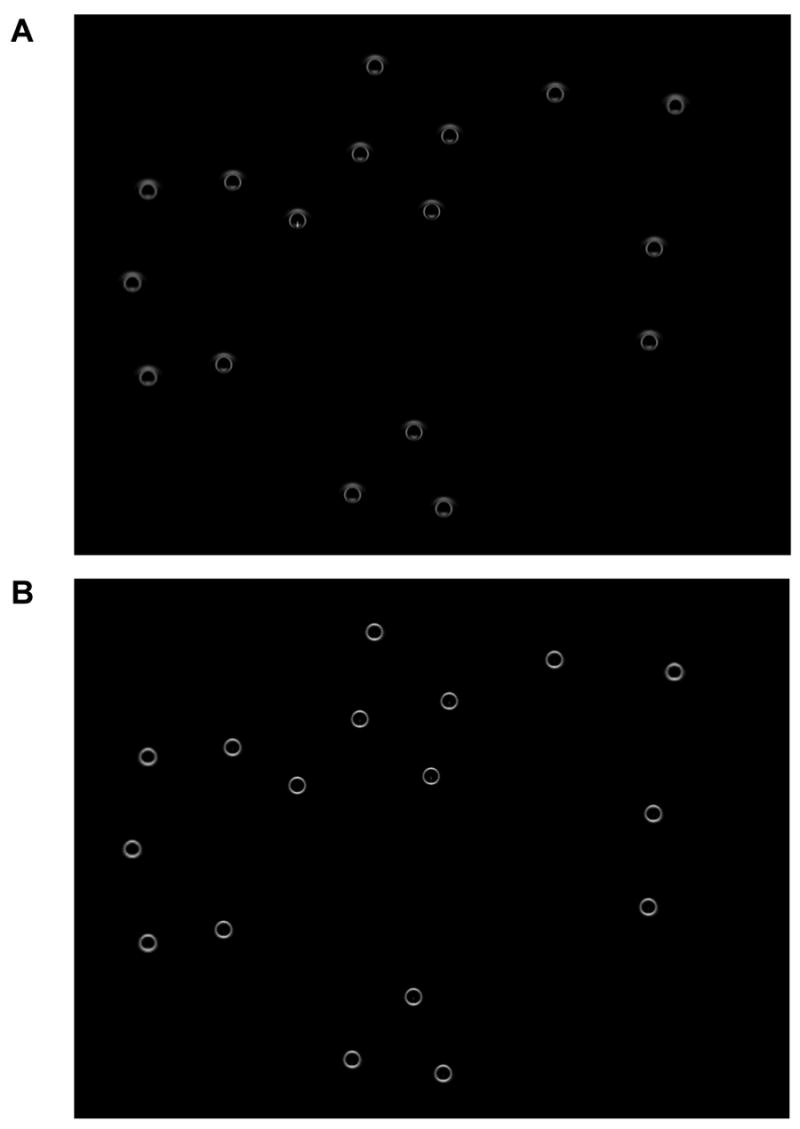
Target map differences underlying TAM's search asymmetry effect. (A) A representative target map from the Q-in-Os task (Experiment 3b). Note the high correlations (bright points) corresponding to the vertical segment of the Q target (upper-left of center). (B) The corresponding target map from the O-in-Qs task (Experiment 3a). Note that the correlations signaling the target are only slightly higher (perhaps imperceptibly so) than the distractor values.
Arguably, the same task-specific coding used by TAM to produce a search asymmetry might also underlie search asymmetries in human behavior. When an observer is searching for a Q in O distractors, she or he is likely searching for the presence of a vertical feature (Treisman & Souther, 1985; Treisman & Gormican, 1988). However, this same observer searching for an O among Qs is likely looking for a qualitatively different target. One possibility is that this target is defined by the absence of verticality, and that this negative feature cannot be used to guide search (Treisman & Souther, 1985). Another possibility is that the observer might search for a positive feature of the O target, such as curvature (Wolfe, 1994). Note that in this latter case search would be guided by the target code to all of the display items roughly equally, as the property of curvature is also shared by each distractor.
Of these two possibilities, the explanation appealing to guidance best describes TAM's behavior. In the Q-in-Os task TAM's gaze was guided directly to the target because it was looking for a vertical bar and the Q was the only pattern in the display having this feature. In the O-in-Qs task TAM was looking for curvature, which resulted in guidance to distractors and a steep set size function. This interpretation was tested in a control experiment by having TAM search for a Q target among O distractors using the bottom-center TV point from the O-in-Qs task. In stark contrast to its previous pop out behavior, the slope of the Fixation × Set Size function was a steep 0.54 fixations/item. This finding not only confirms the above interpretation of TAM's behavior, but also highlights the importance of task-specific target codes in guiding search. Presumably, if observers were also foolish enough to look for curvature when searching for a Q among Os, they too would find the task difficult.
7 Experiment 3c: Acquiring a “Clipped” Q Target among O Distractors
As described in Experiment 3b, TAM acquired some targets more efficiently than others, with the underlying cause of this behavior being a visual similarity relationship between a task-specific target representation and the target and distractor patterns in the search display. Localization was efficient when the target representation was highly similar to the displayed target, and highly dissimilar to the distractors. Localization was inefficient when the target representation was similar to both the targets and distractors. Although the focus of Experiment 3b was to illustrate a search asymmetry, the data therefore indicate equally well an effect of target-distractor (T-D) similarity on localization performance.
Like set size effects and search asymmetries, T-D similarity effects are reproducible across a range of search tasks. Generally, search guidance becomes less efficient as targets and distractors are made increasingly similar (e.g., Duncan & Humphreys, 1989; Treisman, 1991; Wolfe, 1994; Wolfe, Cave, & Franzel, 1989). TAM computes T-D similarity by obtaining a feature vector for the target pattern and comparing it to the feature vectors obtained for the target and distractors in the search display, with the correlation between these features becoming TAM's estimate of visual similarity. The target map, by holding these correlations, is therefore an explicit representation of T-D similarity, one that is specific to the features and comparison method (i.e., correlation) used by TAM.
This experiment explores more directly the effect of T-D similarity on target localization. Although TAM captured behavioral T-D similarity effects in the two previous experiments, it did so indirectly. The actual similarity relationships between the target and distractors did not change between Experiments 3a and 3b, what changed was TAM's representation of the target, as reflected in the different TV points. In this experiment I manipulate the similarity between the target and distractor items while having the model code the same target feature. To do this I re-ran the Q-in-Os task, only this time using a Q target with a “clipped” tail. By making the tail in the Q target smaller, the target becomes more similar to the O distractors. To the extent that TAM and observers are sensitive to this increase in T-D similarity, set size effects should be steeper relative to those reported in Experiment 3b.
7.1 Behavioral Methods
The same 6 observers searched for a clipped Q target among O distractors. Except for the size of the tail defining the Q target (see the Appendix for additional details), all aspects of the behavioral methods were identical to Experiment 3b. Importantly, the distractor elements and the configurations of items in the search displays were unchanged from the previous experiment. Differing patterns of results between the two experiments can therefore be attributed to the size of the Q's tail and the target's greater similarity to the O distractors; an O looks more like a clipped Q than a Q with a full-sized tail.
7.2 Computational Methods
Except for the selection of a different TV point (Section 2.1.3), the computational methods used in Experiment 3c were unchanged from Experiment 3b. In addition to their judgments regarding the O and Q patterns, the 37 student raters were provided with a third sheet showing the clipped Q pattern on the left and the O pattern on the right. Their instructions were again to indicate: “Which point on the left pattern would allow you to most easily differentiate it from the right pattern?” The individual ratings are shown in Figure 14C, superimposed over the clipped Q pattern. As in the case of the Q target (Figure 14B), these ratings clustered on the vertical tail feature of the clipped Q, although the smaller dimension of this tail caused a downward displacement of the modal rating (15, 28; m = 9) relative to the TV point used in Experiment 3b.
7.3 Results and Discussion
7.3.1 Target Acquisition Accuracy
Observers incorrectly localized targets on 2.7% of the trials, which were discarded from further analysis. Target localization in this task was again accompanied by gaze moving to the target in the search display. Terminal gaze-to-target distances averaged 0.73° (± 0.25°) for observers and 0.50° for TAM, a value just within the 95% CI of the behavioral mean and the estimated error of the eye tracker. In general, target acquisition accuracy was highly consistent across all three of the reported OQ experiments; human and model alike tended to terminate a trial only after accurately fixating the target, despite large differences in search efficiency between the tasks.
7.3.2 Number of Fixations
Figure 19A plots the average number of behavioral and simulated fixations from this experiment (middle two functions), and from Experiments 3a (top two functions) and 3b (bottom two functions), for comparison. Figures 19B and 19C group the Experiment 3c data by Near and Far conditions, and show the averaged data together with data from individual observers.
Figure 19.

Number of fixations in Experiment 3c, plotted as a function of set size. Average behavioral data are indicated by the thick blue-green functions; individual observer data are indicated by the thin green functions; data from TAM are indicated by the thick crimson functions. Error bars indicate one SEM. (A) Evidence for an effect of target-distractor similarity. Set size functions for the Experiment 3c task (clipped Q target, middle two functions) shown with data re-plotted from the Experiment 3a task (O target, top two functions) and from the Experiment 3b task (Q target, bottom two functions). (B) Data from the Experiment 3c Near eccentricity condition. (C) Data from the Experiment 3c Far eccentricity condition. Note that TAM's data in this condition largely occludes the averaged behavioral data.
In contrast to the relative immediateness of target localization found in the Q-in-Os task, observers localizing a clipped Q target showed pronounced set size effects. RTs in the 9, 13, and 17-item conditions were 1631, 1963, and 2169 ms, respectively, producing a slope of 67 ms/item. The set size effect for number of fixations was 0.33 fixations/item, based on an average of 6.9 (± 1.2), 8.2 (± 1.2), and 9.5 (± 2.6) fixations in the 9, 13, and 17-item conditions. TAM's set size effect was 0.26 fixations/item, with an average of 6.6, 8.0, and 8.6 fixations in the 9, 13, and 17-item conditions, values all within the behavioral mean's 95% CIs. TAM also agreed with the behavioral data with respect to target eccentricity effects. Observers acquired the target more efficiently in the Near condition (.22 ± .17 fixations/item) than in the Far condition (.45 ± .26 fixations/item), although this difference was only marginally significant, t(5) = 2.24, p = .074. TAM produced a similar pattern, with the Near (.08 fixations/item) and Far (.43 fixations/item) slopes again within the 95% CI of the behavioral means. In summary, very close agreement was obtained between the behavioral and simulated data, both in terms of the intercept and slope of the Fixation × Set Size functions, as well as the dependency of these functions on target eccentricity.
7.3.3 Effect of Target-Distractor Similarity
Comparing the data from Experiment 3c (Figure 19A, middle two functions) with the data from Experiment 3b (Figure 19A, bottom two functions) illustrates a clear effect of target-distractor similarity. The stimuli used in these two experiments were identical except for the size of the tail defining the Q targets. Nevertheless, these few pixels translated into a large behavioral effect. Increasing T-D similarity resulted in a threefold decrease in localization efficiency, from 0.11 fixations/item with a Q target to 0.33 fixations/item with a clipped Q target, a significant difference, t(5) = 3.07, p = .028. TAM's behavior showed a similar relationship; a nearly flat Fixation × Set Size slope for a Q target (0.06 fixations/item) but a steeper slope for the clipped Q target (0.26 fixations/item). Unlike the Q target, a clipped Q did not pop out from the O distractors. Moreover, reliable differences in localization efficiency were not found between the Experiment 3a task (Figure 19A, top two functions) and the Experiment 3c task, in either number of fixations or RTs, t(5) ≤ 1.24, p ≥ .271. Perhaps unsurprisingly, when the similarity between a Q target and O distractors is increased, localization efficiency approximates the inefficient levels commonly observed in an O-in-Qs task.
What contributed to the effect of T-D similarity reported in this experiment? Whereas the different slopes between the O-in-Qs task and the Q-in-Os task might have resulted from the coding of different features, slope differences between the Q and clipped Q tasks indicate a purer effect of T-D similarity, as the same basic features were coded in both tasks. One obvious source of this similarity effect stems from simple pattern matching; the diminutive tail of the clipped Q yielded a poorer representation of verticality, resulting in a stronger match to the O distractors. However, this match was also affected by peripheral blurring, as evidenced by the effect of target eccentricity. Slopes in the Near target condition were relatively flat in the clipped Q task for some observers, suggesting that they might have been able to partially resolve the clipped tail of the Q from their starting gaze position. Far targets, however, resulted in uniformly steep set size functions. It therefore follows that the effect of T-D similarity reported here might also be due, in part, to acuity limitations. This was undoubtedly true for TAM. The clipped Q target in the Near eccentricity condition generated a small but detectable signal, but this signal in the Far condition disappeared in noise as degradation across the simulated retina erased the vertical feature.
8 General Discussion
8.1 Summary
Finding objects of interest in a visual scene and shifting gaze to these targets is a fundamental human behavior, one that is likely performed hundreds of times each day. This article reported an investigation of this target acquisition behavior in the context of three very different target localization tasks. For each task I also compared human behavior to the behavior of a computational model of oculomotor target acquisition, TAM.
Experiment 1 had human and simulated observers locate a tank target in fully realistic scenes. Several findings emerged from this study: observers were able to localize targets with perfect accuracy, they did so using relatively few eye movements, and their initial saccades were typically in the direction of the target, indicating target guidance in this task. TAM captured all three of these human behaviors. Most notably, its initial eye movements were also guided to the targets, and the number of fixations needed by TAM to acquire these targets matched almost perfectly the number of fixations required by human observers.
Experiment 2 had human and simulated observers locate a variety of toy objects in a simple crib scene. The primary behavioral finding was the observation of center-of-gravity (COG) averaging fixations; oculomotor target acquisition was characterized by a prominent spatial averaging tendency that gradually lessened over time until gaze and the target were spatially aligned. Similar COG averaging behavior was found in TAM's simulated fixations; initial saccades were directed consistently to the center of a scene, followed by subsequent saccades that brought gaze steadily towards the target. TAM also localized the target without an accompanying eye movement on a comparable percentage of trials, and even showed the same target dependencies as observers in this no-saccade localization behavior.
Experiment 3 had human and simulated observers perform a variety of localization tasks involving arrays of simple O and Q stimuli. Experiment 3a described a challenging O-in-Qs task, which produced the expected behavioral effects of set size and target eccentricity, albeit with some variability among individuals. Both of these hallmark search behaviors were reproduced by TAM, with this agreement being particularly high when compared to a subset of the observers. Experiment 3b was the converse Q-in-Os localization task. These conditions produced pop-out behavior, demonstrating a search asymmetry when compared to Experiment 3a. TAM produced comparable pop-out behavior and a search asymmetry by using task-specific target coding, based on observer ratings. Experiment 3c reported an effect of target-distractor similarity, with the primary behavioral finding being an increased slope of the target acquisition function when the tail of the Q target was clipped in half. TAM not only captured this T-D similarity effect, but described the behavioral data almost perfectly, even with respect to an interaction between T-D similarity and target eccentricity.
Models are often built to describe specific behaviors, or to work with specific stimuli. A model built to work with a set of simple patterns may not work well with real-world objects, and vice versa. TAM is more general purpose; it was designed to be used with a wide range of stimuli. I evaluated this aspect of the model using stimuli ranging in complexity from fully realistic scenes to Os and Qs. In all cases TAM acquired targets in a believable manner; it did not generate patently artificial scanpaths. TAM is also general in its description of multiple aspects of human target acquisition behavior. Although its ability to reproduce any one of the above summarized data patterns may not be overly impressive, its ability to reproduce all of these patterns is uncommon. This is particularly true given that some of these behavioral patterns seemingly involve mutually incompatible goals. A model that can efficiently acquire a target in fully realistic scenes (Experiment 1) may find it difficult to produce a set size effect in an O-in-Qs localization task (Experiment 3a). Likewise, a model that demonstrates COG averaging in one task (Experiment 2) may be incapable of directly acquiring a pop-out target in another task (Experiment 3b). TAM is robust in its ability to resolve these sorts of incompatibilities, a desirable feature in a general purpose model.
One method of making a model flexible is to endow it with many parameters that can be adjusted from task to task or stimulus to stimulus. This approach may make a model seem general purpose, when in fact it is highly dependent on user-supplied information. TAM takes a different approach, relying instead on five core processes that are likely to be important ingredients in any search or target acquisition task.12
Retina-transform the visual scene for every eye fixation (see also, Geisler & Perry, 1998). Distinguishing between foveal and peripheral vision is essential to any model of oculomotor target acquisition, as acquisition is defined by an alignment between the fovea and a target. The graded acuity limitations introduced by an artificial retina, even one that is highly simplified (as was the case with TAM), might also help to explain the ubiquitous effects of eccentricity reported here and throughout the search literature.
Represent visual information using high dimensional vectors of simple features (see also, Olshausen & Field, 1996). TAM used as features the responses from first and second order Gaussian-derivative filters (GDFs) sampling the color, orientation, and scale feature spaces. It is this representational framework that enabled it to accept arbitrary patterns as stimuli, and to extract information from these patterns that was useful in guiding search.
Use properties of the target to guide search (see also, Wolfe et al., 1989). TAM uses appearance-based information to guide its gaze intelligently to targets. This guidance is accomplished by correlating feature vectors from the target and search scene, thereby creating a map of similarity estimates indicating evidence for the target at each point in scene space (i.e., the target map). Collectively, these values constitute a guidance signal that promotes efficient target acquisition in some tasks, and inefficient target acquisition in others.
Use estimates of signal and noise in the target map to set model parameters (see also, Najemnik & Geisler, 2005). A high signal-to-noise ratio (SNR) causes TAM to make large amplitude saccades in the direction of the target; a lower SNR causes TAM to make smaller amplitude saccades, often to nearby distractors. This use of signal and noise gives TAM's scanpaths a human-like quality, and helps it to make a reasonable number of fixations.
Use a population code to program eye movements (see also, Findlay & Walker, 1999). Each saccade landing position is determined by spatially averaging the population of values on the target map. This averaging is itself modulated by a threshold that progressively prunes from the target map the least target-related activity. It is this threshold, when combined with population averaging, that causes TAM's initially broad distribution of search to gradually converge on the target. Of course a population code is also the reason why TAM makes center-of-gravity fixations; without a population code its fixations on items would be overly precise and the number of simulated fixations would be too closely locked to set size.
Depending on the task, target acquisition may have been affected by one of these processes more than another, but each was active and equally available during every task. There was no parameter telling TAM to use COG averaging for one task but not another, or to weight a particular GDF more for a complex stimulus than for a simple pattern. As would be expected from a general purpose model, contributions from specific processes had to be determined internally, not supplied in the form of task-specific training or parameter fitting.
The inclusion of the above five processes was a necessary first step in endowing TAM with its flexibility, but equally important was the correct orchestration of their interaction. All of these processes were dynamically intertwined, working together as part of an integrated target acquisition system. Consider the interactions that occur during even the first two fixations. The simulated fovea is initially set to a task-neutral location, and from this vantage point the search scene is retina transformed and a target map is constructed from GDF responses. Assuming that the target is not near initial fixation, peripheral degradation may prevent immediate target detection by lowering the correlation between the target feature vector in memory and the feature vectors corresponding to the target in the search scene. In this event, TAM would begin guiding its search for the target by sending its gaze to the weighted centroid of the time-thresholded target map, with the signal and noise characteristics of the target map determining the metrics of this eye movement. Following this gaze shift, a new retina transformation is obtained, new GDF response vectors are derived, and ultimately, a new target map is computed reflecting the visual evidence for the target based on the changed visual locus. The specific computations occurring during any given fixation therefore depend on the computations that occurred on the previous fixation, and indeed on all of the fixations since the start of the search.
8.2 Implications for Theories of Visual Search
The generally high level of agreement between human and simulated behavior reported in this article has several implications for theories of overt, and covert, visual search. Some of these implications follow from the core processes discussed in the previous section.
TAM highlights the importance of retinal acuity limitations in shaping search behavior by quantifying eccentricity effects in the context of a computational model. Given the role that acuity limitations likely play in most visual search tasks, a simulated retina should become a standard component in models of search. This is obviously true for models of eye movements during search, but models of purely covert search should adopt this practice as well. Confining a search theory to covert shifts of attention and applying it to situations too brief to allow eye movement does not justify the neglect of acuity limitations. It is still true that patterns degrade with visual eccentricity and that this degradation will affect the extraction of target information from a scene, and ultimately search behavior.
The search community must start fulfilling its promise to understand search behavior as it exists in the real world. Just because a model is shown to work with simple stimuli, it does not follow that it will work also with fully realistic scenes. This generalization has to be demonstrated, and such demonstrations are not trivial. TAM makes one small payment on this promissory note, but it suggests a much larger repayment plan. It does this by using a fairly standard feature decomposition technique to represent visual patterns. Although more sophisticated techniques are available for extracting features from real-world stimuli (e.g., Zhang, Yu, Zelinsky, & Samaras, 2005), the fact that this relatively simple method produced good results suggests that it may be adequate for most appearance-based search tasks. Simplicity is desirable in these situations, as more complex methods may deter researchers from adding similar filter-based front ends to their search models. Ultimately, only through the more widespread adoption of such techniques can the search community start repaying its promise to make theories with demonstrated real-world applicability.
Search is guided, and any model that does not include a guidance component is describing a fairly rudimentary form of search behavior. Evidence for guidance in the context of simple visual patterns is incontrovertible, and Wolfe's (1994) Guided Search theory does an excellent job of capturing this behavior.13 This theory, however, cannot be easily extended to guidance in real-world contexts, and indeed until now there have been no models of human search behavior demonstrating target guidance in the context of realistic scenes. The current article, by laying a theoretical foundation capable of supporting real-world target guidance, will open the door for further research into this basic search process.
Signal detection theory (Green & Swets, 1966; see also Graham, Kramer, & Yager, 1987) has been invaluable in framing our understanding of search, as have the studies showing how signal and noise affects search behavior (e.g., Geisler & Chou, 1995; Palmer, Verghese, & Pavel, 2000; Palmer, Ames, & Lindsey, 1993). The current study adds to this body of work by demonstrating how a signal-to-noise ratio can be dynamically computed from a target map on a fixation-by-fixation basis, then used to set an internal parameter of a search model. A relatively low-level computation specific to a given search display (i.e., the signal-to-noise ratio) can therefore determine a relatively high-level aspect of the ongoing search behavior, in this case the speed in which overt search converges on a candidate target.
Population codes should not be overlooked in models of visual search. These codes are ubiquitous throughout the brain, and have been implicated in saccade generation since at least the mid 1970s (McIlwain, 1975, 1982, 1991). However, the importance of population coding has only recently been recognized by image-based search theories (e.g., Pomplun et al., 2003; Rao et al, 2002), with oculomotor work in related domains still largely ignoring these codes (e.g., Engbert et al., 2005, Reichle et al., 2003; although see Coeffe & O'Regan, 1987, and Reilly & O'Regan, 1998). Perhaps underlying this relative neglect is a belief that the type of saccade code selected, one based on a population of activity or one consisting of a serialized list of discrete objects, is somewhat arbitrary, and that either can be made to work equally well. TAM demonstrates that this is not the case. Whereas it is true that a population code, with appropriate thresholding, can be made to produce the sort of item-to-item fixation behavior characteristic of serial search (as shown in Figures 5A and 16B), it is less clear how a serialized object model can produce off-object fixations and COG averaging without adopting some form of population code.14 Moreover, without a population code it becomes difficult to explain more global aspects of search behavior, such as the apparent movement from a broad distribution of processing early in a trial to a more focused distribution of processing later in a trial. The choice of using one or the other method of oculomotor coding is therefore not arbitrary; a model built on a population code can fully describe the behavioral data, one built on an item-based code cannot.
Another implication for search arising from the current work involves the wealth of search-relevant information provided by eye movement dependent measures. Many search studies restrict their analyses to measurements of RT, and occasionally errors. In the context of target acquisition these aspects of search are captured by the surrogate measures of terminal endpoint error and number of fixations. However, other eye movement measures might also be used to study more subtle aspects of search, such as the direction of the initial search movement as evidence for guidance, and how search spatially converges on a target over time. By exploring these other eye movement dependent measures it becomes possible to quantify, not just how long observers take to find a particular target, but also how this happens—the unfolding process of search (see also Zelinsky & Sheinberg, 1995, 1997).
Having multiple eye movement measures also creates a challenging dataset for testing a model. With the help of a few well placed parameters it is relatively easy to have a model of search explain patterns of errors and RTs, as the number of parameters might match, or even exceed the number of data points requiring explanation. Adding eye movement measures helps to avoid this problem by providing additional constraints on one's search theory. If a model can account for multiple eye movement patterns, and do so with few or no free parameters, this model can be said to have high explanatory power in predicting search behavior.
A final implication of the current work is that a great deal of target acquisition behavior, and presumably search behavior, can be explained by a fairly simple model. Individually, none of the operations appearing in Figure 1 are very complex, and certainly none of the core processes summarized in Section 8.1 are new or original to this study. What is new, however, is the description of how these operations and processes, when correctly combined and set into motion, can produce a relatively general purpose model of target acquisition.
8.3 Implications for Perspectives on Attention
Up to this point there has been little discussion of how TAM relates to visual attention. This was deliberate. I wanted to keep the focus of this article on directly observable eye movement behavior in a target acquisition task (see also Zelinsky, 2005a), and I did not want to mislead the reader into thinking that TAM is a model of attention, which it is not. That said, several of TAM's operations might be loosely mapped onto processes typically associated with attention, and therefore of interest to the covert attention community.
Like many models of attention in search, TAM can be divided into preattentive and attentive stages. TAM's preattentive stage might consist of the parallel convolution of GDFs with the search image, a strictly bottom-up operation associated with relatively low-level perceptual processing (Section 2.1.3). The attentive stage would consist of all other model operations. Alternatively, one might adopt Ullman's (1984) more computational framing of processing stages. Under this scheme the array of GDF responses would constitute a base representation, which would be obtained automatically and irrespective of task goals or other forms of top-down control. The creation of all other representations would require the application of visual routines, a level of control often assumed to require attention.
The convolution operation used in the preattentive or base representational stage is followed by a correlation operation used to construct the target map. Recall that the target map provides an estimate of target-scene visual similarity for each point in the retina-transformed search image. Under Ullman's scheme, the target map would therefore be considered an incremental representation, one obtained by applying a visual routine (i.e., correlation) to the base representation. Note also that this incremental representation is now task dependent, as a different target map would be obtained if TAM was searching for a different target. It is less clear how the target map fits in to the traditional dichotomy between preattentive and attentive processes. In one sense the target map is preattentive, as information has not yet been selected from the representation. In another sense this representation is attentive, in that it now contains target-specific information that can be used to affect the ongoing search process. It is perhaps more useful to think of activity on the target map as embodying a form of attentional set or priming (see also Zelinsky, 2005a). Because this activity is weighted by its visual similarity to the target, high correlations may increase the efficiency of search guidance to the target, and hence the probability of the target being selected and detected.
Of course the process most closely associated with attention is selection. Selection is distributed over (at least) two operations in TAM. First, a maximum operator is used to obtain the hotspot (i.e., point of maximum correlation) on the target map (Section 2.2.1). Second, a moving threshold is used to prune values from the target map offering the least evidence for the target (Section 2.3.4). TAM is initially in a non-selective state, as represented by multiple points of activation across the target map. Selection is accomplished by steadily removing the low-correlation values from the target map, which ultimately results in only the hotspot value remaining. TAM therefore treats selection as a gradual process, one very much extended in time. Indeed, depending on the signal-to-noise ratio, several eye movements might be made before a single hotspot is fully selected.
This implementation of selection has two implications for attention theory. The first involves the mechanism of selection, whether it is best described as signal enhancement (e.g., Posner, Nissen, & Ogden, 1978; Posner, Snyder, & Davidson, 1980; see also Lu & Dosher, 1998) or noise reduction (Dosher & Lu, 2000a, 2000b; Lu & Dosher, 2000; Shiu & Pashler, 1994). As already discussed, TAM introduces a bias at the target's location on the target map, which can be considered a form of signal enhancement. However, its primary method of selection is to remove non-hotspot activity from the target map, a process more closely associated with noise reduction. TAM therefore uses both mechanisms to select targets, with the relative importance of each depending on the specific task.15 Second, selection under TAM is tied to the production of an eye movement, suggesting a specific relationship between eye movements and attention. TAM does not require that an eye movement be made to the target; if the target gives rise to an above-threshold correlation on the target map, TAM will terminate without shifting its gaze. Note that in this case the target is detected without being selected, where selection is again defined as the removal of non-target noise from the target map. It is only when such an immediate judgment is not possible, meaning that an eye movement is needed to position the simulated fovea closer to the target candidate, that TAM begins its gradual process of selection. The proximal goal of selection is therefore to change gaze, with the more distal goal of selection being actual target detection. In this sense, TAM can be correctly construed as a selection for action theory of attention (Allport, 1987; Neuman, 1987; Norman & Shallice, 1986). Selection is required to move gaze to a particular location in space; if this action was not needed, there would be no selection.
Finally, any discussion of how TAM relates to attention would be incomplete without some mention of capacity limitation and parallel and serial processing. TAM is a blend of both processing forms. Parallel processing is clearly central to the model. The target map indicates evidence for the target over the entire search image, and the values on this map can be accessed in parallel by the target detection process to terminate search. Moreover, the centroid operation used to determine saccade endpoints is an inherently parallel computation. However, it is also true that TAM relies most on parallel computation early in its processing, in the first few eye movements of a trial. As already discussed, processing starts off broadly distributed over the scene, but then constricts around the hotspot as a result of noise reduction accompanying selection. In this respect, TAM is conceptually related to zoom lens models of attention (e.g., Downing & Pinker, 1985; Eriksen & St. James, 1986). For some difficult tasks, such as the O-in-Qs task used in Experiment 3a, TAM might even fall into a distinctly serial mode of behavior. Serial processing is expressed by the successive selection and rejection of hotspots. If gaze converges on a hotspot and the detection threshold is still not exceeded (i.e., the hotspot does not correspond to the target), this hotspot is inhibited (Section 2.4.1) and gaze moves to the next hotspot, and so on. Recall, however, that upon rejecting a hotspot TAM lowers, rather than raises, the target map threshold (Section 2.4.2). This is done to bring previously excluded values back onto the target map so that a new hotspot can be selected. Parallel computation is therefore reintroduced, as multiple points may reappear on the target map, causing gaze to be sent to the centroid of these points. In this sense TAM's behavior is perhaps best described as a parallel-to-serial movement, interspersed with brief periods of serial-to-parallel movement, depending on the task.
Importantly, TAM's parallel-to-serial movement, and its occasional serial behavior, does not reflect a capacity limitation on attention. Unlike many multiple-stage or zoom lens perspectives on attention and search (e.g., Duncan & Humphreys, 1989; Eriksen & St. James, 1986; Olshausen et al., 1993; Treisman & Gelade, 1980; Treisman & Sato, 1990; Wolfe et al., 1989; Wolfe, 1994), TAM does not assume the existence of a limited capacity attention resource (see also Logan, 1997, and Allport, 1980), nor does it assume that serial processing stems from a need to focus this limited resource on a particular display item. As already discussed, TAM collapses its window of search around a pattern, not to restrict attention to that pattern, but rather to select it for fixation by gaze.16 The recognition of a pattern is therefore assisted by the high-resolution fovea moving to the pattern's location, but the recognition process itself is parallel under this version of TAM. In this sense, the current approach is best characterized as an unlimited capacity parallel model of search. As for why TAM sometimes falls into a serial mode of operation, this reflects search optimization rather than capacity limitation; TAM seeks to preserve the low-noise operating state obtained following the constriction of processing around the initial hotspot.
8.4 Comparisons to Other Models
TAM is similar in many respects to existing models of eye movements and search. The following is a brief review of these similarities, and differences, with respect to three representative models of overt search behavior.
8.4.1 The Rao, Zelinsky, Hayhoe, & Ballard (2002) Model
The model bearing the greatest similarity to TAM is the Rao et al. (2002) model, and some of the key similarities and differences have already been discussed in the context of Experiment 2. With regard to similarities, both models represent arbitrarily complex images in terms of spatio-chromatic GDFs (although the models differ with regard to the specific features that are coded), both models use a correlation operation to derive a form of target map, and both models rely on population coding and centroid averaging to program saccades.
There are also key differences between these models. Although the Rao et al. (2002) model was not implemented in this study and explicitly compared to TAM, several behavioral consequences follow directly from the different model architectures.
First, TAM includes a simulated retina, one that has been calibrated to reflect known limitations on human visual acuity. The Rao et al. model includes no retina transformation, operating instead on the unprocessed input images. The absence of a retina in this model means that it would not describe the eccentricity effects reported in Experiment 3 (a-c). Recall that TAM's target correlations tended to decrease with eccentricity in these experiments due to blurring introduced by the simulated retina; target correlations in the Rao et al. model would not vary as a function of eccentricity. Related to this point, eccentricity effects contributed to the different levels of difficulty observed across tasks in this study. The reason why a clipped Q target was harder to detect than a regular Q was due to the target-defining tail of the Q all but disappearing when viewed in the far visual periphery. The Rao et al. model would fail to capture this sort of eccentricity-dependent manipulation of target-distractor similarity, and the consequent changes in search behavior.
Second, TAM implements a noise-reduction selection mechanism to create global-to-local guidance to the target. Target acquisition under the Rao et al. model is accomplished by the coarse-to-fine inclusion of spatial filters in the correlation operation, under the assumption that the target would be accurately acquired once all of the spatial scales are included in the computation. These different target acquisition methods have clear and important consequences for gaze behavior. Although TAM often shifted gaze directly to the target (e.g., Experiment 1 and Experiment 3b), this strong guidance depended on the task. In the O-in-Qs task, the O target was acquired directly on only 5% of the trials; usually gaze was directed to one or more of the Q distractors first. This resulted in a relatively serial search, with gaze moving from false target to false target before finally acquiring the actual target. No such serial search behavior would be expected from the Rao et al. model. Indeed, the strong guidance signal available to this model would make the selection of false targets very rare; except for the occasional distractor fixated by gaze en route to the target, the target would typically be the first object fixated on every trial. This inability to account for distractor fixations severely restricts the applicability of this model to search.
Third, saccade generation under TAM is based on the signal and noise in the target map. Saccade generation under the Rao et al. model is tied to the addition of spatial scales to the matching operation; each new scale typically improves the match between the target template and the target in the search image, which in turn results in a simulated eye movement bringing gaze closer to the target. However, a necessary consequence of this method is that an upper limit is imposed on the number of eye movements by the number of spatial scales; if the model uses only 4 scales to represent visual patterns, then at most only 4 eye movements can be made during search. Relatedly, given that target acquisition is almost certain once all of the spatial scales have been included in the matching operation, the model predicts that all targets will be acquired with at most x eye movements, where x again corresponds to the number of spatial scales. There is no comparable limit imposed on the number of eye movements that human observers can make during search, nor is there a way to ensure that the target will be acquired after a set number of gaze shifts. Indeed, observers in the O-in-Qs task made more than 10 eye movements on 37% of the trials. The Rao et al. model would not be able to account for these behaviors. In this sense the model is too accurate, overestimating the human ability to acquire targets with gaze.
Fourth, TAM includes a correlation-based target detection threshold and an inhibition-of-return mechanism that enables it to continue searching elsewhere in a scene after erroneously converging on a false target. The Rao et al. model includes no mechanism for recovering from fixations on false targets. However, the absence of a recovery mechanism is, in a sense, not problematic for the Rao et al. model. As already discussed, because this model does not allow for the possibility of false targets, there is no need to include mechanisms for breaking gaze from non-target lures or preventing false targets from being refixated.
8.4.2 The Itti & Koch (2000) Model
TAM and the Itti & Koch (2000) model are similar in that they both can accept realistic images as input, and they both attempt to describe the pattern of eye movements that occur during search. However, compared to the Rao et al. (2002) model, the Itti and Koch (2000) model is very different from the current approach. The primary difference lies in the type of guidance assumed by each. In TAM there exists a form of target template (i.e., the target feature vector), and the match between this template and the search display is used to guide gaze towards the target. In this sense the guidance process is driven by knowledge of the target's appearance, placing TAM alongside other primarily top-down accounts of attention control (e.g., Folk, Remington, & Johnston, 1992; Folk, Remington, & Wright, 1994; Folk & Remington, 1998). In contrast to this approach the Itti & Koch model assumes a guidance process based on feature contrast signals in the search image, making it more aligned with other bottom-up descriptions of search (e.g., Theeuwes, 1991, 1994, 2004). Specifically, center-surround receptive field mechanisms are used to derive luminance, color, and orientation contrast signals at multiple spatial scales, which are combined and plotting for each point in the image. This produces a topographic map of feature discontinuity, often referred to as a saliency map (see also, Koch & Ullman, 1985, and Parkhurst, Law, & Niebur, 2002; see Itti, 2005, for more recent implementations of saliency maps). Winner-take-all competition is then used to determine the most salient point, which then becomes the target for an eye movement or shift of attention. According to this model, the search process consists of the systematic movement of gaze from the most to the least salient points in the search image, with search terminating once one of these points corresponds to the target (the model does not include a method for automated target detection). Importantly, whereas TAM requires a designated target and in this sense must always be searching for something, there is no designated target in the Itti & Koch model. This model makes eye movements solely on the basis of visual conspicuity, telling it to search for a particular target would not affect its eye movement behavior.
The different guidance processes used by these models determine the range of behaviors that each can explain. For example, because TAM uses target-based guidance, it would need to be substantially modified in order to describe eye movement behavior in a non-search task, such as picture viewing in preparation for a memory test (e.g., Hollingworth & Henderson, 2002; Loftus, 1972; Noton & Stark, 1971; Underwood & Foulsham, 2006; for reviews, see Henderson & Hollingworth, 1999, and Henderson, 2003). This is because TAM requires a target, and there exists no well-defined target in a picture viewing task. However, in the context of target acquisition or search, this same model was shown to successfully reproduce a variety of human behaviors, including the tendency for search to be guided to the target. Conversely, the Itti & Koch model may be able to describe the human tendency to fixate regions of high feature contrast in a scene (which TAM cannot), but its reliance on saliency-based guidance limits its usefulness as a model of visual search and target acquisition.
None of the evidence for target-based guidance reported in Experiments 1 and 2 could be explained by the Itti & Koch model. As demonstrated in Section 3.3.4, a saliency-based model dramatically overestimated the number of eye movements needed to acquire targets in Experiment 1. Using similar scenes, Zelinsky et al. (2006) argued that this overestimation could be linked directly to the absence of a target-based guidance signal. Target guidance in Experiment 2 was expressed, not so much in the number of fixations, but in the locations of these fixations relative to the target. Recall that gaze in this task tended to converge on the target in a sequence of small steps, with each step bringing gaze steadily closer to the target. Such guidance would not be expected from the Itti & Koch model, as the model includes no mechanism to bias gaze in the target's direction. In addition to its guidance-related limitations, the Itti & Koch model, like the Rao at al. (2002) model, does not pre-process the search image to reflect retina acuity limitations. Consequently, the Itti & Koch model would suffer the same inability to describe the many effects of eccentricity reported in this study.
However, it should be noted that the Itti & Koch model might succeed in describing the behavioral data from Experiments 3a and 3b. TAM explained the many distractor fixations in Experiment 3a in terms of false targets spawned by a weak guidance signal, but this same behavior could potentially be modeled by the successive movement between peaks on a saliency map. In the case of Experiment 3b, both models predict the capture of gaze by pop-out targets, but for entirely different reasons; the Itti & Koch model predicts pop-out due to the Q target being the most salient object in the scene (see also van Zoest, Donk, & Theeuwes, 2004), TAM predicts pop-out due to the strong guidance signal directing gaze to the target (see also Chen & Zelinsky, 2006). These different explanations map loosely onto a broader debate in the search community regarding pop-out and its relationship to top-down and bottom-up processes, and the interested reader should consult this literature for additional discussion (e.g., Egeth & Yantis, 1997; Theeuwes, 2004; Yantis, 2000).
8.4.3 The Wolfe (1994) Model
If the Rao et al. (2002) model is TAM's theoretical parent, Wolfe's (1994) guided search model (GSM) can rightly be called its grandparent. By today's standards, the computational underpinnings of GSM are dated. The model employed a very restricted feature space that limited its application to very simple search patterns. Additionally, a great deal of information had to be hand-delivered to the model, such as the similarity relationships between the target and distractors, and even the number and locations of the search items. Wolfe (1994) acknowledged some of these limitations, stating that his model would benefit from a more realistic ‘front end’ so as to accommodate more complex stimuli (p. 228). The current model provides such a front end, and in this sense can be considered an updated version of GSM rather than a theoretical competitor.
Computational trappings aside, GSM remains theoretically current in its proposal that both top-down and bottom-up factors contribute to search guidance. As in TAM, GSM assumes that search is guided by knowledge of the target's features. Specifically, these target features are preattentively compared to features in the search display, and attention is directed to the pattern offering the most evidence for the target. Noise is injected into this process so as to prevent the target from always being acquired by attention in its initial movement. As in the Itti & Koch (2000) model, GSM also uses bottom-up factors, represented as nearest-neighbor feature contrast signals, to guide attention during search. By incorporating both sources of information, GSM is therefore more theoretically inclusive than either TAM or the Itti & Koch (2000) model (although see Navalpakkam & Itti, 2005, and Zelinsky et al., 2006). However, recent work has shown that when both bottom-up and top-down sources of information are available to search, the bottom-up information is largely ignored (Chen & Zelinsky, 2006; but see Zoest et al., 2004). Weighting the top-down contribution is entirely rational behavior, as bottom-up guidance is unlikely to be as beneficial to search as guidance by the actual target features. Indeed, the addition of a bottom-up guidance signal to a target-guided model of search has been shown to reduce efficiency by guiding search away, rather than towards, the target (Zelinsky et al., 2006; see also Henderson, Brockmole, Castelhano, & Mack, 2007). It is therefore arguable whether a model that combines both top-down and bottom-up signals would be more successful than TAM in describing human behavior, at least in the tasks reported here in which the top-down target information was highly reliable.
It is not clear how well GSM would describe the data reported in this study, as such a comparison would require substantially modifying GSM to work with images, and this would require the addition of theoretical assumptions. However, speculating from the Wolfe (1994) version of the model there would likely be two broad areas of disagreement. First, and as in the case of the Rao et al. (2002) and Itti & Koch (2000) models, GSM lacks a simulated retina, meaning that it too would be unable to describe the reported relationships between target eccentricity and acquisition behavior.17 In general, search theories tend to neglect this key transformation, which is surprising given its demonstrated importance to search (e.g., Geisler and Chou, 1995; Geisler, Perry, & Najemnik, 2006). Second, GSM confines its shifts of attention to objects. Search items are prioritized with respect to top-down and bottom-up guidance signals, and attention visits each item in decreasing order of priority, after a healthy injection of noise. The attention dynamics predicted by this process are very straightforward; the spotlight of attention moves directly from one object to the next until the target is found. The movement dynamics observed in the current study are far more complicated. For example, the majority of the initial movements in Experiment 2 were to regions of the scene devoid of objects. GSM would not be able to account for any of these center-of-gravity fixations. Similarly, it is unlikely that the handful of fixations made en route to the target in Experiment 1 were due to objects attracting attention (as hypothesized by GSM), or due to these points being particularly salient regions of the scene (as hypothesized by the Itti & Koch, 2000, model). Rather, these fixations were more likely a by-product of the process used to gradually select a target from a complex background (as hypothesized by TAM). However, and in fairness to GSM, it is a model of attention during search, not the eye movements used to acquire a search target. To the extent that these movement dynamics are specific to oculomotor search, these behaviors would be beyond the scope of GSM.
8.4.4 Other Theoretical Approaches
There have been several other theoretical frameworks addressing the topic of eye movements during search that will not be considered here in detail. This is either because the work was descriptive and lacking an implemented model (e.g., Findlay & Walker, 1999; Folk et al., 1992; Henderson, 1993; Theeuwes, 2004), because an implemented model was not accompanied by adequate analyses of behavioral eye movement data, (e.g., Frintrop, Backer, & Rome, 2005; Hamker, 2006; Tsotsos et al., 1995), because the work was formulated mathematically rather than computationally, making a direct comparison to TAM difficult (e.g., Eckstein et al., 2007; Eckstein et al., 2006; Motter & Holsapple, 2007, Motter & Simoni (2007)), or because the model was focused more generally on oculomotor control rather than on search or target acquisition (e.g., Godijn & Theeuwes, 2002; Trappenberg et al., 2001). Also neglected are studies aimed at uncovering the neurophysiological substrates of selection during overt visual search (e.g., Nobre et al., 2002; Sheinberg & Logothetis, 2001; see Schall & Thompson, 1999, for a review), and the theoretical frameworks that have grown out of this work (e.g., Desimone & Duncan's, 1995, biased competition model). The current version of TAM is not intended to be a model of any specific brain area or system of areas; as it matures the hope is that these connections to neuroscience will become more apparent. Given this restricted focus there are (at least) four additional approaches that are highly relevant to the current discussion, each of which will be considered briefly.
First, in an elegant extension of Bayesian ideal observer theory to visual search, Najemnik and Geisler (2005) asked whether human searchers employ optimal eye movement search strategies (see also Eckstein, Beutter, & Stone, 2001). In addition to their main finding, that human searchers do indeed select saccade targets so as to maximize the information gained from each fixation, they observed another interesting pattern; these near-optimal fixations came in two varieties, those on background patches similar to the target, and those at locations near the centroid defined by high posterior probabilities. The observation of center-of-gravity fixations in this context raises the intriguing possibility that the target map used by TAM, along with the thresholded centroid averaging process to select saccade targets, might also instantiate a sort of ideal searcher, one that can be applied to fully realistic scenes. It would be interesting to formalize the relationship between the target map and Najemnik and Geisler's (2005) posterior probability map.
The Area Activation Model (AAM) of eye movements during search, developed by Pomplun and colleagues (Pomplun et al., 2003), also shows great promise in describing effects of distractor grouping on search behavior. As in the case of the Najemnik and Geisler (2005) ideal observer model, AAM assumes that eye movements are directed to areas in a search display that maximize the amount of information at each fixation. To do this the model first defines an area surrounding each fixation over which information is extracted, the fixation field. The size of the fixation field depends on a number of factors, including target-distractor similarity and item density (see also Bertera & Rayner, 2000, Bouma, 1978, and Jacobs, 1986). Activation values are then assigned to each search item to reflect the amount of information that would be obtained if that item was fixated. However, rather than using these values to directly prioritize a sequence of fixations, as in GSM, this model cleverly sums the individual activation peaks within a given fixation field. Every point in this area-based activation map, and not just those corresponding to items, is therefore assigned an activation value. Interestingly, Pomplun and colleagues also observed the occasional center-of-gravity fixation using this method; sometimes the most informative point in a display corresponds to the center of a clump of items rather than the most target-like item. Despite its strengths, AAM is also limited in at least two significant respects. First, the model currently requires arrays of featurally simple and individuated search patterns; it cannot yet be applied to realistic scenes. Second, the model requires a great deal of user-supplied information, such as the number of fixations that would likely be made during the search and an estimate of the search guidance signal for each display item. Given that recent work has suggested movement towards overcoming these limitations (Pomplun, 2006), this approach may soon develop into another general purpose model of visual search.
Also noteworthy is a model by Navalpakkam and Itti (2005), which combines bottom-up saliency information with information about the ongoing task or goal. The bottom-up component is based on the Itti and Koch (2000) model; the top-down component consists of task constraints, represented as user-supplied keywords interacting with knowledge in a long-term memory network. In the context of a search task, if the model is asked to search for a banana, and the feature of “yellow” has been associated with this object, the model could impose a yellow bias on the saliency map and thereby increase the likelihood of gaze being directed to the target. Although only partially implemented, this approach is interesting in that it is highly flexible and adopts a very broad definition of top-down information, enabling its application well beyond a visual search task. However, this very breadth also creates challenges. Given the dubious role of bottom-up information in a target-guided acquisition task (Chen and Zelinsky, 2006; Zelinsky et al., 2006), this model would often need to substantially de-weight the bottom-up contribution in order to fit behavioral data. Doing this, however, would cause the model to degenerate into a symbolic version of a primarily top-down search model. Although this endeavor might itself be informative, one would not expect the highly abstracted features stored in associative memory to be as efficient as the actual target features in guiding gaze, raising doubts as to whether this approach will have great success in describing gaze behavior. Still, it will be interesting to see how this work develops as the model is fully implemented and validated through behavioral testing.
Lastly, Rutishauser and Koch (2007) recently reported a method for weighting the features used to guide gaze in conjunction search tasks, and a model of this guidance process. The method analyzes behavioral search data to obtain conditional probabilities of fixations on distractors sharing features with the target, thereby making it possible to determine the extent of guidance offered by each target feature (see also Motter & Belky, 1998, and Tatler, Baddeley, & Gilchrist, 2005). The model includes primary and secondary feature guidance parameters, and a capacity-limited target detection process that evaluates items within a criterion distance from each fixation. Consistent with earlier work (Williams, 1966), Rutishauser and Koch found that color dominates guidance, with orientation and size having lower priority. They were also able to obtain reasonable fits to several eye movement variables, such as the number of fixations made during search and the conditional probability of these fixations falling on a given distractor type. Interestingly, contributions from both primary and secondary features were needed in order to accurately describe the behavioral data. This is important, not only in its quantification of feature weights in the guidance process, but also in its implication for how these feature guidance signals are combined (i.e., using a weighted sum rather than a maximum operation). However, it is not yet known whether this feature weighting method can be generalized to stimuli residing in higher dimensional feature spaces, making the model's applicability to real-world search uncertain.
9 Limitations and Future Directions
TAM's success in describing human target acquisition behavior was contingent upon strict adherence to three testing conditions. First, TAM's task was to move its gaze to a target; it is not known how the model would behave in more common target present/absent search tasks. Second, TAM knew exactly what the target looked like, and the target always appeared in the display exactly as expected. Violating this condition would likely cause the model to fail, and perhaps to do so dramatically. Third, TAM's only source of top-down information was target appearance. In its current form it would not be able to exploit other sources of information that might be used for search guidance. The following is an abbreviated discussion of future work intended to partially lift these constraints and to begin addressing some of the many limitations that they impose.
Improve the model's object recognition capabilities. Models of visual search do not often engage the recognition question, either because the stimuli are so simple as to make the question moot, or because the stimuli are so complex as to move the question beyond the scope of a search study. TAM unfortunately follows the latter trend. The same correlation-based technique used to guide gaze to the target is currently used by the model to recognize the search target. This is undesirable. Although both search guidance (Newell et al., 2004) and object recognition (Bülthoff & Edelman, 1992; Tarr & Bülthoff, 1995,1998) degrade with orientation mismatch between target and test, simple correlation is not a plausible method of object recognition (Biederman, 1995). TAM might therefore guide its gaze successfully to a rotated target, but consistently fail to recognize the target once it is fixated due to an unsophisticated recognition method. Future work will address this problem by dissociating TAM's guidance process from its recognition process. This will enable the application of more powerful methods to deal with more challenging recognition tasks, but these methods might also require additional constraints on TAM's behavior. Recognition is still very much an open question, and as better methods become available these can potentially be integrated into TAM. The goal is to ultimately model the interacting search/recognition system, and in doing so to better characterize search behavior as it exists under less constrained and more realistic conditions.
Enable the model to search for categorically defined targets. TAM relies on knowledge of the target's specific features to guide search; as this target information is degraded, guidance will lessen and search efficiency will suffer. This is problematic as many search tasks are conducted under exactly these conditions, where a precise target definition is unavailable. The best example of this is categorical search. If you need to quickly jot down a note, you might search for any writing instrument within reach, not specifically a pen or a specific favorite pen. Existing models of visual search would fail in such a categorical search task, and TAM is no exception. Future work will address this problem on two fronts, one experimental and the other computational. Experimental work will address the question of how much guidance occurs during categorical search. Although previous work has suggested a categorical representation of search targets (Wolfe, Friedman-Hill, Stewart, & O'Connell, 1992, Wolfe, 1994), it is less clear whether a categorically defined target can mediate search guidance. One recent study reported little or no evidence for categorical guidance (Wolfe et al., 2004), another recent study found reasonably good guidance (Yang & Zelinsky, 2006). This discrepancy must be resolved. Computationally, this problem can be addressed by using machine learning techniques to extract the visual features describing a target class, then supplementing TAM's GDF features with this new feature set. Recent years have seen rapid progress in the computer vision community on solving the object class detection problem (e.g., Belongie, Malik, & Puzicha, 2002; Viola, Jones, & Snow, 2005), and one method has even been validated against human eye movement behavior in a categorical search task (Zhang, Yang, Samaras, & Zelinsky, 2006). A goal will be to model the human searcher's ability to flexibly adapt to different levels of target specificity by devising a comparably flexible target acquisition system, one that would use specific target information when it is available, and categorical information when the target is less well defined.
Reflect the prominence of objects in search behavior. TAM is image-based, meaning that all patterns, objects and backgrounds alike, contribute to activation on the target map in proportion to their similarity to the target. This image-based representation has its advantages and disadvantages. On the one hand it is desirable in that it may enable the model to capture effects of background on search behavior. Recent studies have shown that search times increase when a complex background is added to a display (Neider & Zelinsky, 2006a; Wolfe et al., 2002). TAM might explain this behavior in terms of noise reduction; time is needed to remove the noise associated with the background before more interesting behavioral dynamics can emerge. On the other hand TAM's equal treatment of backgrounds and objects is undesirable as it ignores the special role that objects play in search. The same studies that reported an effect of background on search also showed that set size effects were largely independent of backgrounds or their similarity to the search target (Neider & Zelinsky, 2006a; Wolfe et al., 2002). Even when backgrounds were highly similar to the target, searchers still preferred to look through the target-dissimilar distractor objects (Neider & Zelinsky, 2006a). This finding is generally consistent with object-based allocations of attention (e.g., Goldsmith, 1998; Yantis & Hillstrom, 1994; Yantis & Jonides, 1996) and is problematic for TAM, and potentially for other models that assume guidance based on visual similarity relationships. Future work will need to better quantify these relationships and, if necessary, to consider the inclusion of an object segmentation stage in search models.
Add the potential for other top-down factors to affect search. TAM can be told to acquire different targets, and these different target descriptions would produce different gaze behaviors. However, this top-down control is restricted to target guidance in the current version of TAM; the model cannot be told explicitly how, or even where to search. In contrast, human overt search behavior is subject to many top-down influences, including position biases (e.g., Zelinsky, 1996; see also Tatler et al., 2005), scanning strategies (e.g., Findlay & Brown, 2006a, 2006b), memory for searched paths (Dickinson & Zelinsky, 2007), and a host of contextual constraints (e.g., Henderson, Weeks, & Hollingworth, 1999; Henderson & Hollingworth, 1999; Henderson, 2003). Of recent interest are the effects of scene context on search. Many scene context effects can be described in terms of Bayesian priors. Given that some targets have been viewed previously at given scene locations (e.g., Eckstein et al., 2006; Brockmole & Henderson, 2006), or tend to appear at consistent locations in a scene (e.g., Oliva et al., 2003; Torralba, et al., 2006), these locations can be inspected first, thereby increasing search efficiency. Other scene constraints are probably best described as semantic. If you are searching for a car there would be little reason to scrutinize every cloud in the sky (Neider & Zelinsky, 2006b). Importantly, none of these context effects are captured by TAM. However, recent work by Torralba et al. (2006) may suggest a solution to this shortcoming. Their model combines a Baysian prior method with a scene classification technique to suggest scene-specific regions that are likely to contain a target. By combining the Torralba et al. (2006) model with TAM, it may be possible to bias regions of the target map to reflect an influence of scene context on target acquisition. Such an integrated model would be more powerful than either approach individually; not only would it be able to use scene context to guide search, it would also retain TAM's ability to efficiently acquire specific targets in the absence of scene constraints.
Develop TAM into a comprehensive model of visual search. Given the obvious similarities between target acquisition and search, perhaps the most straightforward direction for future work is the extension of TAM to a standard search task. Immediate work towards this goal will likely follow two directions.
One research effort will extend TAM to target absent search. The current version of TAM describes the processes used to align gaze with a target, but models of search behavior often ask whether a target exists in a display, as well as where it is located. Optimistically, accommodating target absent search behavior might be as simple as adding a preattentively available target absent termination criterion (see also Chun & Wolfe, 1996). If during the course of search a correlation on the target map exceeds the target present threshold, the search would terminate with a target present response, as already described. However, if the hotspot correlation on this map fails to exceed a target absent threshold, perhaps after many applications of inhibition, then search could terminate with a target absent response. What potentially complicates this scenario is the balancing of these responses against the inevitable errors accompanying a present/absent search task. If the target absent threshold is set too high, TAM may terminate a search prematurely, resulting in a miss; if the target absent threshold is set too low, it may generate an unrealistically large number of eye movements before concluding that the target is not present in a scene. It is not known at this time whether the parameter settings used in this study to describe target present search will also produce realistic miss rates and target absent search behavior.
A second research effort will use TAM to describe individual fixation durations during search. Just as comprehensive models of overt search should be able to predict where gaze will be directed in a display, such models should also strive to predict how long gaze will dwell at each of these locations. A description of these temporal dynamics was not included in this article, but the current version of TAM has already in place a mechanism that could partly account for these behaviors. Recall that TAM's normal operation involves the iterative raising of a target map threshold (TMT), used to prune activity from the target map so as to eventually isolate the most likely target location. Although each threshold adjustment suggests a tiny change in gaze, TAM's simulated fovea is prevented from moving until a location is suggested that exceeds a criterion distance (EMT) from the current gaze position. Estimates of individual saccade latencies can therefore be obtained by counting the number of threshold adjustments preceding an eye movement, then multiplying this value by a time factor and offsetting by a constant. Because EMT changes dynamically with the signal-to-noise ratio of the target map, TAM's eye movement latencies will also vary from fixation to fixation, providing another rich source of data that can be compared to human behavior. Note also that this dependence on EMT predicts a speed-accuracy tradeoff between a fixation's duration and the accuracy of the following saccade; the longer TAM is prevented from moving its gaze, the closer the next saccade should land to the target (see also Ottes, van Gisbergen, & Eggermont, 1985). The elaboration of these temporal dynamics will be the topic of a separate study.
10 Conclusion
This article described an interdisciplinary computational and behavioral investigation of how gaze acquires targets in cluttered visual environments. An implemented computational model generated a sequence of eye movements that ultimately aligned a simulated fovea with a designated target. These eye movements were compared to the target acquisition behavior from observers performing the same task and viewing the identical scenes. Such oculomotor characterizations of search create opportunities to generate and test hypotheses at an uncommon level of specificity, with each simulated scanpath, and indeed each fixation becoming a hypothesis that can be tested against human behavior.
Specificity, however, is a double-edged sword. On the one hand one's trust in a model certainly increases with the number of behaviors that it can explain. By this measure TAM inspires confidence. In addition to broadly capturing many gaze patterns, ranging from eye movement guidance and eccentricity effects to center-of-gravity averaging and search asymmetries, it also generated reasonable approximations of where fixations were allocated during a task, culminating in human-like scanpath behavior (e.g., Figures 10A, 12, 16). The fact that TAM was able to explain these diverse data patterns, and did so for a range of tasks and with fixed parameter settings, sets a new standard for models of target acquisition and overt search behavior. On the other hand the many fixation-based predictions generated by TAM will inevitably reveal model failures. Some of these will be local, cases in which TAM shifts its gaze to a location that is qualitatively different from where any of the human observers chose to look. Other failures will reveal more global inconsistencies with human behavior. The hope is that both types of failures will be informative. Local failures may reveal factors contributing to individual differences in target acquisition behavior. It will be interesting to learn whether individual observer scanpaths can be duplicated by adjusting TAM's parameters. Global failures are of course more serious, and given the fundamental limitations outlined in the previous section, these failures may be spectacular. However, because these failures will likely occur in tasks having significant cognitive influences, they too might be informative in demarcating the boundary between low-level visual search processes and the higher level factors affecting eye movements during search.
Acknowledgments
This work was supported by grants from the Army Research Office (DAAD19-03-1-0039) and the National Institute of Mental Health (R01 MH63748). I would like to thank Felix Chi and Wei Zhang for technical assistance and lively discussion throughout this project, and Kyle Cave, Reinhold Kliegl, Erik Reichle, John Henderson, and John Findlay, for many insightful comments on an earlier draft of this paper. TAM is available for download at: http://www.psychology.sunysb.edu/psychology/downloads/TAM/.
Appendix: Supplemental Methods
General
Behavioral eye movement data were collected during Experiments 1-3 using the EyeLink® II eye tracking system (SR Research Ltd.). The spatial resolution of this video-based eye tracker was approximately 0.25°; eye position was sampled at 500 Hz. Testing began with a 9-point calibration procedure needed to map eye position to screen coordinates. A calibration was considered successful if the maximum spatial error was less than 1° and the average error was less than 0.5°. This initial calibration procedure was supplemented by a drift correction procedure prior to the start of each trial (Stampe, 1993).
Stimuli were presented in color (when applicable) on a ViewSonic 19” flat-screen CRT monitor operating at a refresh rate of 100 Hz. Search displays subtended 20°×15° (1280×960 pixels), the same pixel resolution and viewing angle used by the model. Head position and viewing distance were fixed with a chinrest. Stimulus presentation was controlled by an in-house program written in Visual C/C++ (v. 6.0), running under Microsoft Windows XP. Manual responses were collected using a Microsoft SideWinder gamepad attached to the computer's USB port. Trials were initiated by pressing a button operated by the right thumb; target localization judgments were registered using the right or left index-finger triggers.
Experiment 1
Twelve Stony Brook University undergraduates participated for course credit. All had normal color vision and normal, or corrected to normal, visual acuity, by self report.
The search stimuli consisted of 42 landscape scenes, selected and modified from the TNO image database (Toet, Bijl, Kooi, & Valeton, 1998; see also Toet, Kooi, Bijl, & Valeton, 1998). The target, an image of a tank, was also selected from this database. The target preview was a 1.4° (90 pixel) vignette of the search scene, the center of which corresponded to the center of the target. In order to use the same tank target on each search trial, scenes had to be selected that would offer an unobstructed and realistic placement of the target image. Some scenes were highly foliaged, and therefore would not accommodate the target without introducing target occlusion; other scenes depicted mountainous regions that would also not accommodate the target given its two-dimensional perspective. To select scenes, five independent raters were asked to judge whether the target would “look good in at least 10 different locations in the scene.” The raters agreed unanimously on 13 background scenes, which were then used as the base scenes in this experiment.
Search scenes were constructed by digitally extracting the target using Adobe Photoshop 7.1 and inserting it into the base scenes. Targets were placed at five different locations in each base image, producing 65 search scenes. Targets appeared in the left and right halves of the scenes in roughly equal numbers (32 left, 33 right), however scene constraints, typically mountainous terrain, prevented targets from being placed in the upper half of the image in all but three of the scenes. As a result of these constraints, a target was far more likely to appear in the bottom half of a search display. Finally, these 65 scenes were subjected to another round of rating, this time to judge whether “the specific placement of the target looks good in the scene.” Twenty-three scenes were excluded due to rater disagreement, leaving 42 scenes for use as search stimuli; the 23 excluded scenes were used for practice trials. The entire experiment was completed in one session, lasting approximately 30 minutes.
Experiment 2
Eight undergraduate students from Stony Brook University participated for course credit, none of whom participated in Experiment 1. All had normal color vision and normal, or corrected to normal, visual acuity, by self report.
As in the Zelinsky et al. (1997) study, objects in the search display were constrained to six locations, 22.5°, 45°, 67.5°, 112.5°, 135°, or 157.5°, along an arc centered on the observer's initial fixation point. However, these objects, along with the background crib surface, were displayed at a 1280×960 pixel resolution, higher than the 640×480 pixel resolution used in the earlier study. The search displays also subtended a greater visual angle, 20°×15°, compared to the 16°×12° viewing angle used previously. This methodological discrepancy was introduced so as to remain consistent with the viewing angle used in Experiment 1, thereby avoiding any parameter adjustments to TAM's artificial retina.
The preview image was obtained by copying an approximately 160×160 (∼2.5°) patch of the search image depicting the target. It was displayed at a screen location corresponding to the center of the imaginary circle used to arrange the search objects. As in Zelinsky et al. (1997), placement of the target preview at this location served to pre-position gaze such that each search object would be equally eccentric relative to starting fixation (∼7°).
There were 60 trials, evenly divided into 1, 3, and 5 object scenes. Set size was randomly interleaved throughout the experiment, and a target was present in every display. Each of the 10 search objects served as the target 6 times, twice per set size condition. Targets were also evenly distributed over display locations, such that each object appeared as the target exactly once in each of the 6 allowable locations in the display. There were 10 practice trials using search display configurations not used in the experimental trials, and the entire experiment lasted approximately 40 minutes.
Experiment 3a
Six undergraduate students from Stony Brook University participated for course credit, none of whom participated in Experiments 1 or 2. All had normal or corrected to normal vision, by self report.
The target was an O and the distractors were Q-like elements; all were shown in white against a dark background. Each element type subtended 0.48° (31 pixels) visual angle at its diameter. The tail of the Q-like element, which protruded into the inside of the circle, was 0.23° long (15 pixels) and 0.05° (3 pixels) wide. Search displays consisted of 1 target and 8, 12, or 16 distractors. Items were located on an imaginary grid of three concentric circles whose radii subtended 2.1°, 4.2°, and 6.3°, and a fourth broken circle banding the left and right sides of the display with a radius of 8.4°. These four bands contained 4, 10, 15, and 10 potential object locations, respectively. Distractors were randomly assigned to these 39 display positions, with the constraint that the target appeared only at the second (4.2°) and fourth (8.4°) eccentricities. This method of placing items forced neighboring display elements to be separated by at least 2.1° (center-to-center distance), and no item could appear within 2.1° of the display's center, which corresponded to initial fixation. Items were also prevented from appearing within 1.6° of the display's border, resulting in the element configuration subtending a possible 16.8°×12.6° despite the 20°×15° (1280×960 pixels) subtended by the search display, same as in Experiments 1 and 2.
Observers participated in 180 experimental trials and 30 practice trials. The experimental trials were evenly divided into 3 set sizes (9, 13, and 17 items) and 2 target eccentricities (4.2° and 8.4°), leaving 30 trials per cell of the design. The experiment was completed in one session, lasting approximately 50 minutes.
Experiment 3b
The same six undergraduate students who participated in Experiment 3a also participated in Experiment 3b, again for course credit. Trials from the two experiments were blocked, and each experiment was conducted on a different day (separated by a minimum of 4 days). Order of participation was counterbalanced over observers; half of the observers performed the O-in-Qs task before the Q-in-Os task, and vice versa.
Experiment 3c
The stimuli used in this experiment were identical the stimuli from Experiment 3b, except for the length of the Q target's tail. Rather than the tail of the Q being 0.23° in length, the tail of the clipped Q subtended only 0.11° (7 pixels) of visual angle, approximately half the size. The same six undergraduate students who participated in Experiments 3a and 3b also participated in Experiment 3c, again for course credit. As in the other experiments, the 180 trials from Experiment 3c were blocked, with each block separated by at least 4 days. When combined across the three localization tasks, observers participated in a total of 540 trials distributed over three roughly one-hour sessions. The order in which observers participated in these three tasks was counterbalanced using a Latin Squares method.
Footnotes
Aspects of this model were presented at the 46th meeting of the Psychonomics Society (Zelinsky, 2005b) and at the 2005 Neural Information Processing Systems meeting (Zelinsky et al., 2006).
Little effort was made in this study to determine the set of optimal features for target acquisition, and the reader should bear this in mind so as not to attach too much importance to the specific features listed here. Indeed, the goal was just the opposite, to represent stimuli using fairly generic features, and to keep their number small so as to reduce computation time. By doing this, one can be certain that TAM's behavior does not hinge on the inclusion of highly specialized features in its base representation.
Although multiple TV points could be computed on the target image, pilot work determined that these feature vectors would be highly redundant and that the denser target representation would not meaningfully affect task performance, at least not for the relatively small targets used in the current study.
Although this deadlock behavior reveals a potential weakness of the model, one should keep in mind that the very few observed cases of this were limited to search displays consisting of extremely simple patterns (such as the O and Q patterns used in Experiment 3), and only when the target was absent from the search display. Because only target present data are reported here, none of the simulations conducted for this study would have resulted in deadlock in the absence of noise. Regarding the effect of noise on TAM's behavior, it is unlikely that its introduction would have resulted in a meaningful re-prioritization of target map signals; noise ranged from .0000001–.0001 whereas values on the target map ranged from 0–1. Indeed, in pilot simulations conducted with and without the addition of noise, simulated scanpaths were virtually indistinguishable. TAM uses noise solely to discourage identical values from appearing on the target map (which is itself an unlikely occurrence in a biological system), not to affect search guidance. This is not true for all models of search, where noise often plays a more central role. For example, if noise were excluded from Wolfe's (1994) guided search model, the target would be the first item visited by attention on an unrealistically large proportion of trials.
Note that this assumes no internal noise and that the target's appearance in the target image is identical to its appearance in the search image, as was the case in the current study. Correlations would be expected to decrease with an increasing mismatch between these two representations of the target.
Rather than using a simple distance parameter, a better method might incorporate knowledge of the target's actual size and shape when demarcating the signal-defining region. However, this method would require the assumption of a metrical memory of the target's contour, which might not be justified.
Note that although d is the upper bound for triggering an eye movement, it is not an upper bound for the amplitude of an eye movement. Depending on the specific display characteristics it is possible that PFP describes a more eccentric position than HS relative to the current fixation, resulting in an eye movement that overshoots the target. This behavior, although rare, was observed occasionally in Experiment 1 from both TAM and human observers.
Note that although the current version of TAM requires the specification of TV points, a future version of the model might learn these points, thereby eliminating yet another user input. This might be accomplished by comparing targets and distractors to obtain a set of points that optimize pattern discrimination, much as human searchers presumably learn the parts of a target that are most relevant to a search task.
Had the finer sampling of orientation been used, the target and image feature vectors would have grown very large and the computational resources needed to conduct the simulations would have become prohibitive. As more powerful computing resources become available, TAM's filter-based representation can be brought into closer agreement with our existing knowledge of visual neurophysiology.
One observer tended to make an eye movement away from the target frame at the moment of the trigger press, resulting in 17% of his trials not technically meeting the stated criterion for accuracy. However, given that his gaze was clearly within the target frame 200 ms before the manual response, these trials were treated as accurate localizations.
Note that Rao et al. (2002) did not provide detailed analyses of how COG fixation tendencies changed as a function of saccade sequence, nor were data presented for all of the simulated search trials. Nevertheless, the computational data that were reported in Rao et al. (2002) bore a qualitative similarity to the behavioral patterns reported in Zelinsky et al. (1997).
Of course there are many other core search processes that are not included in this version of TAM, and other processes in the existing model that are arguably core processes but are not listed here as such.
Guidance, however, is not perfect, and may be overridden by other factors affecting search (e.g., Zelinsky, 1996).
Note that even if one were to exploit the unsatisfying practice of adding noise to the simulated oculomotor behavior, it would not be possible to explain the simultaneous expression of COG fixations and accurate fixations on individual objects.
Lu and Dosher (2000) argued for a similar task-dependent selection mechanism, proposing the use of external noise exclusion when targets are endogenously cued, and signal enhancement (plus external noise exclusion) when targets are exogenously cued.
Although one might consider gaze itself to be a limited resource (indeed, gaze cannot be allocated to two locations at the same time), this is usually considered a structural limitation, distinct from those imposed by a fixed pool of attention (Kahneman, 1973).
Note that Wolfe and Gancarz, 1996 outlined an updated 3.0 version of GSM that included retina preprocessing. However, this model was not fully implemented and lacked the computational detail and thorough behavioral testing included with the 2.0 version.
Publisher's Disclaimer: The following manuscript is the final accepted manuscript. It has not been subjected to the final copyediting, fact-checking, and proofreading required for formal publication. It is not the definitive, publisher-authenticated version. The American Psychological Association and its Council of Editors disclaim any responsibility or liabilities for errors or omissions of this manuscript version, any version derived from this manuscript by NIH, or other third parties. The published version is available at http://www.apa.org/journals/rev/
References
- Aks D, Enns J. Visual search for size is influenced by a background texture gradient. Journal of Experimental Psychology: Human Perception and Performance. 1996;22:1467–1481. doi: 10.1037//0096-1523.22.6.1467. [DOI] [PubMed] [Google Scholar]
- Allport DA. Attention and performance. In: Claxton G, editor. Cognitive psychology. London: Routledge & Kegan Paul; 1980. pp. 112–153. [Google Scholar]
- Allport DA. Selection for action: some behavioural and neuro-physiological considerations of attention and action. In: Heuer H, Sanders AF, editors. Perspectives on perception and action. Hillsdale, NJ: Lawrence Erlbaum Associates Inc.; 1987. pp. 395–419. [Google Scholar]
- Alvarez GA, Cavanagh P. The capacity of visual short term memory is set both by visual information load and by number of objects. Psychological Science. 2004;15:106–111. doi: 10.1111/j.0963-7214.2004.01502006.x. [DOI] [PubMed] [Google Scholar]
- Anderson JA, Rosenfeld E. Neurocomputing: foundations of research. Cambridge, MA: MIT Press; 1988. [Google Scholar]
- Anderson JA, Silverstein JW, Ritz SA, Jones RS. Distinctive features, categorical perception, and probability learning: Some applications of a neural model. Psychological Review. 1977;84:413–451. [Google Scholar]
- Behrmann M, Watt S, Black S, Barton J. Impaired visual search in patients with unilateral neglect: An oculographic analysis. Neuropsychologia. 1997;35:1445–1458. doi: 10.1016/s0028-3932(97)00058-4. [DOI] [PubMed] [Google Scholar]
- Belongie S, Malik J, Puzicha J. Shape matching and object recognition using shape contexts. Pattern Analysis and Machine Intelligence. 2002;24:509–522. doi: 10.1109/TPAMI.2005.220. [DOI] [PubMed] [Google Scholar]
- Bertera J, Rayner K. Eye movements and the span of the effective stimulus in visual search. Perception & Psychophysics. 2000;62:576–585. doi: 10.3758/bf03212109. [DOI] [PubMed] [Google Scholar]
- Bichot NP, Rossi AF, Desimone R. Parallel and serial neural mechanisms for visual search in macaque area V4. Science. 2005;308:529–534. doi: 10.1126/science.1109676. [DOI] [PubMed] [Google Scholar]
- Biederman I. Visual object recognition. In: Kosslyn S, Osherson D, editors. An Invitation to Cognitive Science. 2nd. Cambridge, MA: MIT Press; 1995. pp. 121–165. [Google Scholar]
- Biederman I, Blickle TW, Teitelbaum RC, Klatsky GJ. Object search in nonscene displays. Journal of Experimental Psychology: Learning, Memory, and cognition. 1988;14:456–467. [Google Scholar]
- Biederman I, Glass AL, Stacy EW. Searching for objects in real-world scenes. Journal of Experimental Psychology. 1973;97:22–27. doi: 10.1037/h0033776. [DOI] [PubMed] [Google Scholar]
- Bouma H. Visual search and reading: Eye movements and functional visual field: A tutorial review. In: Requin J, editor. Attention and performance. VII. Hillsdale, NJ: Erlbaum; 1978. pp. 115–146. [Google Scholar]
- Bourne L. Knowing and using concepts. Psychological Review. 1970;77:546–556. [Google Scholar]
- Boynton R. Visual search techniques (NAS-NRC Publication 712); NRC Vision Committee Symposium.1960. [Google Scholar]
- Brefczynski J, DeYoe E. A physiological correlate of the ‘spotlight’ of visual attention. Nature Neuroscience. 1999;2:370–374. doi: 10.1038/7280. [DOI] [PubMed] [Google Scholar]
- Brockmole JR, Henderson JM. Using real-world scenes as contextual cues for search. Visual Cognition. 2006;13:99–108. [Google Scholar]
- Bülthoff H, Edelman S. Psychophysical support for a two-dimensional view interpolation theory of object recognition. Proceedings of the National Academy of Science, USA. 1992;89:60–64. doi: 10.1073/pnas.89.1.60. [DOI] [PMC free article] [PubMed] [Google Scholar]
- Bundesen C. Visual selection of features and objects: Is location special? A reinterpretation of Nissen's (1985) findings. Perception & Psychophysics. 1991;50:87–89. doi: 10.3758/bf03212208. [DOI] [PubMed] [Google Scholar]
- Burt PJ, Adelson EH. The Laplacian pyramid as a compact image code. IEEE Transactions on Communications. 1983;31(4):532–540. [Google Scholar]
- Buswell GT. How people look at pictures. Chicago: University of Chicago Press; 1935. [Google Scholar]
- Carrasco M, Frieder K. Cortical magnification neutralizes the eccentricity effect in visual search. Vision Research. 1997;37:63–82. doi: 10.1016/s0042-6989(96)00102-2. [DOI] [PubMed] [Google Scholar]
- Carrasco M, Yeshurun Y. The contribution of covert attention to the set-size and eccentricity effects in visual search. Journal of Experimental Psychology: Human Perception and Performance. 1998;24:673–692. doi: 10.1037//0096-1523.24.2.673. [DOI] [PubMed] [Google Scholar]
- Chelazzi L, Miller E, Duncan J, Desimone R. Responses of neurons in Macaque area V4 during memory-guided visual search. Cerebral Cortex. 2001;11:761–772. doi: 10.1093/cercor/11.8.761. [DOI] [PubMed] [Google Scholar]
- Chen X, Zelinsky GJ. Real-world visual search is dominated by top-down guidance. Vision Research. 2006;46:4118–4133. doi: 10.1016/j.visres.2006.08.008. [DOI] [PubMed] [Google Scholar]
- Chun M, Wolfe J. Just say no: How are visual searches terminated when there is no target present? Cognitive Psychology. 1996;30:39–70. doi: 10.1006/cogp.1996.0002. [DOI] [PubMed] [Google Scholar]
- Churchland PS, Sejnowski TJ. The computational brain. Cambridge, MA: MIT Press; 1992. [Google Scholar]
- Coeffe C, O'Regan JK. Reducing the influence of non-target stimuli on saccade accuracy: predictability and latency effects. Vision Research. 1987;27:227–240. doi: 10.1016/0042-6989(87)90185-4. [DOI] [PubMed] [Google Scholar]
- Daugman J. Two-dimensional spectral analysis of cortical receptive field profiles. Vision Research. 1980;20:847–856. doi: 10.1016/0042-6989(80)90065-6. [DOI] [PubMed] [Google Scholar]
- Desimone R, Duncan J. Neural mechanisms of selective visual attention. Annual Review of Neuroscience. 1995;18:193–222. doi: 10.1146/annurev.ne.18.030195.001205. [DOI] [PubMed] [Google Scholar]
- Deubel H, Schneider WX. Saccade target selection and object recognition: Evidence for a common attentional mechanism. Vision Research. 1996;36:1827–1837. doi: 10.1016/0042-6989(95)00294-4. [DOI] [PubMed] [Google Scholar]
- Dickinson CA, Zelinsky GJ. Marking rejected distractors: A gaze-contingent technique for measuring memory during search. Psychonomic Bulletin & Review. 2005;12:1120–1126. doi: 10.3758/bf03206453. [DOI] [PubMed] [Google Scholar]
- Dickinson CA, Zelinsky GJ. Memory for the search path: Evidence for a high-capacity representation of search history. Vision Research. 2007;47:1745–1755. doi: 10.1016/j.visres.2007.02.010. [DOI] [PMC free article] [PubMed] [Google Scholar]
- Dosher BA, Lu ZL. Mechanisms of perceptual attention in precuing of location. Vision Research. 2000a;40:1269–1292. doi: 10.1016/s0042-6989(00)00019-5. [DOI] [PubMed] [Google Scholar]
- Dosher BA, Lu ZL. Noise exclusion in spatial attention. Psychological Science. 2000b;11:139–146. doi: 10.1111/1467-9280.00229. [DOI] [PubMed] [Google Scholar]
- Downing C, Pinker S. The spatial structure of visual attention. In: Posner MI, Marin OS, editors. Attention and performance. XI. Hillsdale, NJ: Erlbaum; 1985. pp. 171–187. [Google Scholar]
- Duncan J, Humphreys G. Visual search and stimulus similarity. Psychological Review. 1989;96:433–458. doi: 10.1037/0033-295x.96.3.433. [DOI] [PubMed] [Google Scholar]
- Eckstein MP. The lower visual search efficiency for conjunctions is due to noise and not serial attentional processing. Psychological Science. 1998;9:111–118. [Google Scholar]
- Eckstein MP, Beutter BR, Pham BT, Shimozaki SS, Stone LS. Similar neural representations of the target for saccades and perception during search. Journal of Neuroscience. 2007;27:1266–1270. doi: 10.1523/JNEUROSCI.3975-06.2007. [DOI] [PMC free article] [PubMed] [Google Scholar]
- Eckstein MP, Beutter BR, Stone LS. Quantifying the performance limits of human saccadic targeting during visual search. Perception. 2001;30:1389–1401. doi: 10.1068/p3128. [DOI] [PubMed] [Google Scholar]
- Eckstein MP, Drescher B, Shimozaki SS. Attentional cues in real scenes, saccadic targeting and Bayesian priors. Psychological Science. 2006;17:973–980. doi: 10.1111/j.1467-9280.2006.01815.x. [DOI] [PubMed] [Google Scholar]
- Egeth HE, Yantis S. Visual attention: Control, representation, and time course. Annual Review of Psychology. 1997;48:269–297. doi: 10.1146/annurev.psych.48.1.269. [DOI] [PubMed] [Google Scholar]
- Elman JL. Finding structure in time. Cognitive Science. 1990;14:179–211. [Google Scholar]
- Engbert R, Nuthmann A, Richter EM, Kliegl R. SWIFT: A Dynamical Model of Saccade Generation during Reading. Psychological Review. 2005;112:777–813. doi: 10.1037/0033-295X.112.4.777. [DOI] [PubMed] [Google Scholar]
- Engel F. Visual conspicuity, directed attention and retinal locus. Vision Research. 1971;11:563–576. doi: 10.1016/0042-6989(71)90077-0. [DOI] [PubMed] [Google Scholar]
- Engel F. Visual conspicuity, visual search and fixation tendencies of the eye. Vision Research. 1977;17:95–108. doi: 10.1016/0042-6989(77)90207-3. [DOI] [PubMed] [Google Scholar]
- Enns JT, Rensink RA. Influence of scene-based properties on visual search. Science. 1990;247:721–723. doi: 10.1126/science.2300824. [DOI] [PubMed] [Google Scholar]
- Enns JT, Rensink RA. Pre-attentive recovery of three-dimensional orientation from line drawings. Psychological Review. 1991;98:335–351. doi: 10.1037/0033-295x.98.3.335. [DOI] [PubMed] [Google Scholar]
- Eriksen C, St James J. Visual attention within and around the field of focal attention: A zoom lens model. Perception & Psychophysics. 1986;40:225–240. doi: 10.3758/bf03211502. [DOI] [PubMed] [Google Scholar]
- Findlay JM. Global visual processing for saccadic eye movements. Vision Research. 1982;22:1033–1045. doi: 10.1016/0042-6989(82)90040-2. [DOI] [PubMed] [Google Scholar]
- Findlay JM. Visual computation and saccadic eye movements: a theoretical perspective. Spatial Vision. 1987;2:175–189. doi: 10.1163/156856887x00132. [DOI] [PubMed] [Google Scholar]
- Findlay JM. Saccade target selection during visual search. Vision Research. 1997;37:617–631. doi: 10.1016/s0042-6989(96)00218-0. [DOI] [PubMed] [Google Scholar]
- Findlay JM. Eye scanning and visual search. In: Henderson JM, Ferreira F, editors. The interface of language, vision, and action: Eye movements and the visual world. New York: Psychology Press; 2004. pp. 135–159. [Google Scholar]
- Findlay JM. Covert attention and saccadic eye movements. In: Itti L, Rees G, Tsotsos J, editors. Neurobiology of attention. Elsevier, Inc.; 2005. pp. 114–116. [Google Scholar]
- Findlay JM, Brown V. Eye scanning of multi-element displays: I. Scanpath planning. Vision Research. 2006a;46:179–195. doi: 10.1016/j.visres.2005.06.010. [DOI] [PubMed] [Google Scholar]
- Findlay JM, Brown V. Eye scanning of multi-element displays: II. Saccade planning. Vision Research. 2006b;46:216–227. doi: 10.1016/j.visres.2005.07.035. [DOI] [PubMed] [Google Scholar]
- Findlay JM, Gilchrist ID. Eye guidance and visual search. In: Underwood G, editor. Eye guidance in reading, driving and scene perception. Oxford: Elsevier; 1998. pp. 295–312. [Google Scholar]
- Findlay JM, Gilchrist ID. Visual attention: The active vision perspective. In: Jenkins M, Harris L, editors. Vision and Attention. Springer Verlag; 2001. pp. 85–105. [Google Scholar]
- Findlay JM, Gilchrist ID. Active vision. New York: Oxford University Press; 2003. [Google Scholar]
- Findlay JM, Walker R. A model of saccadic eye movement generation based on parallel processing and competitive inhibition. Behavioral and Brain Sciences. 1999;22:661–721. doi: 10.1017/s0140525x99002150. [DOI] [PubMed] [Google Scholar]
- Folk CL, Remington RW. Selectivity in distraction by irrelevant feature singletons: Evidence for two forms of attentional capture. Journal of Experimental Psychology: Human Perception and Performance. 1998;24:847–858. doi: 10.1037//0096-1523.24.3.847. [DOI] [PubMed] [Google Scholar]
- Folk CL, Remington RW, Johnston JC. Involuntary covert orienting is contingent on attentional control settings. Journal of Experimental Psychology: Human Perception and Performance. 1992;18:1030–1044. [PubMed] [Google Scholar]
- Folk CL, Remington RW, Wright JH. The structure of attentional control: Contingent attentional capture by apparent motion, abrupt onset, and color. Journal of Experimental Psychology: Human Perception and Performance. 1994;20:317–329. doi: 10.1037//0096-1523.20.2.317. [DOI] [PubMed] [Google Scholar]
- Frintrop S, Backer G, Rome E. Goal-directed search with a top-down modulated computational system. In: Kropatsch W, Sablantnig R, Hanbury A, editors. Lecture Notes in Computer Science: Pattern Recognition (3663); Proceedings of the 27th DAGM Symposium; Springer Verlag; 2005. pp. 117–124. [Google Scholar]
- Geisler WS, Chou K. Separation of low-level and high-level factors in complex tasks: Visual search. Psychological Review. 1995;102:356–378. doi: 10.1037/0033-295x.102.2.356. [DOI] [PubMed] [Google Scholar]
- Geisler WS, Perry JS. A real-time foveated multiresolution system for low-bandwidth video communication. Human Vision and Electronic Imaging, SPIE Proceedings; 1998. pp. 294–305. [Google Scholar]
- Geisler WS, Perry JS. Real-time simulation of arbitrary visual fields. Proceedings of the Eye Tracking Research & Applications Symposium (ACM); 2002. pp. 83–87. [Google Scholar]
- Geisler WS, Perry JS, Najemnik J. Visual search: The role of peripheral information measured using gaze-contingent displays. Journal of Vision. 2006;6:858–873. doi: 10.1167/6.9.1. [DOI] [PubMed] [Google Scholar]
- Godijn R, Theeuwes J. Programming of endogenous and exogenous saccades: Evidence for a competitive integration model. Journal of Experimental Psychology: Human Perception and Performance. 2002;28:1039–1054. doi: 10.1037//0096-1523.28.5.1039. [DOI] [PubMed] [Google Scholar]
- Goldsmith M. What's in a location? Comparing object-based and space-based models of feature integration in visual search. Journal of Experimental Psychology: General. 1998;2:189–219. [Google Scholar]
- Gould J. Eye movements during visual search and memory search. Journal of Experimental Psychology. 1973;98:184–195. doi: 10.1037/h0034280. [DOI] [PubMed] [Google Scholar]
- Graham N, Kramer P, Yager D. Signal-detection models for multidimensional stimuli: Probability distributions and combination rules. Journal of Mathematical Psychology. 1987;31:366–409. [Google Scholar]
- Green D, Swets J. Signal detection theory and psychophysics. New York: Krieger; 1966. [Google Scholar]
- Hamker FH. Modeling feature-based attention as an active top-down inference process. BioSystems. 2006;86:91–99. doi: 10.1016/j.biosystems.2006.03.010. [DOI] [PubMed] [Google Scholar]
- Hausser M, Mel B. Dendrites: bug or feature? Current Opinion in Neurobiology. 2003;13:372–383. doi: 10.1016/s0959-4388(03)00075-8. [DOI] [PubMed] [Google Scholar]
- Hayhoe M. Visual routines: a functional account of vision. Visual Cognition. 2000;7:43–64. special issue on Change Blindness. [Google Scholar]
- He P, Kowler E. The role of location probability in the programming of saccades: Implications for ‘center-of-gravity’ tendencies. Vision Research. 1989;29:1165–1181. doi: 10.1016/0042-6989(89)90063-1. [DOI] [PubMed] [Google Scholar]
- He ZJ, Nakayama K. Surfaces versus features in visual search. Nature. 1992;359:231–233. doi: 10.1038/359231a0. [DOI] [PubMed] [Google Scholar]
- Henderson JM. Visual attention and saccadic eye movements. In: d'Ydewalle G, van Rensbergen J, editors. Perception and cognition: Advances in eye-movement research. Amsterdam: North-Holland; 1993. pp. 37–50. [Google Scholar]
- Henderson JM. Human gaze control during real-world scene perception. Trends in Cognitive Sciences. 2003;7:498–504. doi: 10.1016/j.tics.2003.09.006. [DOI] [PubMed] [Google Scholar]
- Henderson JM, Brockmole JR, Castelhano MS, Mack ML. Visual saliency does not account for eye movements during visual search in real-world scenes. In: van Gompel R, Fischer M, Murray W, Hill RW, editors. Eye movements: A window on mind and brain. Amsterdam: Elsevier; 2007. pp. 537–562. [Google Scholar]
- Henderson JM, Hollingworth A. High-level scene perception. Annual Review of Psychology. 1999;50:243–271. doi: 10.1146/annurev.psych.50.1.243. [DOI] [PubMed] [Google Scholar]
- Henderson JM, Pollatsek A, Rayner K. Covert visual attention and extrafoveal information use during object identification. Perception & Psychophysics. 1989;45:196–208. doi: 10.3758/bf03210697. [DOI] [PubMed] [Google Scholar]
- Henderson JM, Weeks P, Hollingworth A. The effects of semantic consistency on eye movements during scene viewing. Journal of Experimental Psychology: Human Perception and Performance. 1999;25:210–228. [Google Scholar]
- Hodgson T, Müller H. Evidence relating to premotor theories of visuospatial attention. In: Findlay J, Walker R, Kentridge R, editors. Eye movement research: Mechanisms, processes, and applications. Amsterdam: North-Holland; 1995. pp. 305–316. [Google Scholar]
- Hoffman JE. Visual attention and eye movements. In: Pashler H, editor. Attention. London: University College London Press; 1998. [Google Scholar]
- Hoffman JE, Subramaniam B. The role of visual attention in saccadic eye movements. Perception & Psychophysics. 1995;57:787–795. doi: 10.3758/bf03206794. [DOI] [PubMed] [Google Scholar]
- Hollingworth A, Henderson JM. Accurate visual memory for previously attended objects in natural scenes. Journal of Experimental Psychology: Human Perception and Performance. 2002;28:113–136. [Google Scholar]
- Hooge I, Erkelens C. Peripheral vision and oculomotor control during visual search. Vision Research. 1999;39:1567–1575. doi: 10.1016/s0042-6989(98)00213-2. [DOI] [PubMed] [Google Scholar]
- Hooge I, Over E, van Wezel R, Frens M. Inhibition of return is not a foraging facilitator in saccadic search and free viewing. Vision Research. 2005;45:1901–1908. doi: 10.1016/j.visres.2005.01.030. [DOI] [PubMed] [Google Scholar]
- Horowitz TS, Wolfe JM. Memory for rejected distractors in visual search? Visual Cognition. 2003;10(3):257–287. [Google Scholar]
- Hubel D, Wiesel T. Receptive fields, binocular interaction and functional architecture in cat's visual cortex. Journal of Physiology (London) 1962;160:106–154. doi: 10.1113/jphysiol.1962.sp006837. [DOI] [PMC free article] [PubMed] [Google Scholar]
- Humphreys G, Müller H. SEarch via Recursive Rejection (SERR): A connectionist model of visual search. Cognitive Psychology. 1993;25:43–110. [Google Scholar]
- Hurvich L. Color Vision. Sunderland, MA: Sinauer Associates; 1981. [Google Scholar]
- Irwin DE, Gordon RD. Eye movements, attention, and transsaccadic memory. Visual Cognition. 1998;5:127–155. [Google Scholar]
- Irwin DE. Integrating information across saccadic eye movements. Current Directions in Psychological Science. 1996;5:94–99. [Google Scholar]
- Irwin DE, Andrews R. Integration and accumulation of information across saccadic eye movements. In: McClelland J, Inui T, editors. Attention and performance. XVI. Cambridge, MA: MIT Press; 1996. [Google Scholar]
- Irwin DE, Zelinsky GJ. Eye movements and scene perception: Memory for things observed. Perception & Psychophysics. 2002;64:882–895. doi: 10.3758/bf03196793. [DOI] [PubMed] [Google Scholar]
- Itti L. Quantifying the contribution of low-level saliency to human eye movements in dynamic scenes. Vision Cognition. 2005;12:1093–1123. [Google Scholar]
- Itti L, Koch C. A saliency-based search mechanism for overt and covert shifts of visual attention. Vision Research. 2000;40:1489–1506. doi: 10.1016/s0042-6989(99)00163-7. [DOI] [PubMed] [Google Scholar]
- Itti L, Koch C. Computational modeling of visual attention. Nature Reviews Neuroscience. 2001;2:194–203. doi: 10.1038/35058500. [DOI] [PubMed] [Google Scholar]
- Jacobs A. Eye-movement control in visual search: How direct is visual span control? Perception & Psychophysics. 1986;39:47–58. doi: 10.3758/bf03207583. [DOI] [PubMed] [Google Scholar]
- Julesz B. Textons, the elements of texture perception and their interactions. Nature. 1981;290:91–97. doi: 10.1038/290091a0. [DOI] [PubMed] [Google Scholar]
- Kahneman D. Attention and effort. Englewook Cliffs, NJ: Prentice-Hall; 1973. [Google Scholar]
- Kanerva P. Sparse Distributed Memory. Cambridge, MA: Bradford Books; 1988. [Google Scholar]
- Kaufman L, Richards W. “Center-of-gravity” tendencies for fixations and flow patterns. Perception & Psychophysics. 1969a;5:81–85. [Google Scholar]
- Kaufman L, Richards W. Spontaneous fixation tendencies for visual forms. Perception & Psychophysics. 1969b;5:85–88. [Google Scholar]
- Klein RM. Does oculomotor readiness mediate cognitive control of visual attention? In: Nickerson RS, editor. Attention and Performance. VIII. Hillsdale, NJ: Erlbaum; 1980. pp. 259–276. [Google Scholar]
- Klein RM. Inhibitory tagging system facilitates visual search. Nature. 1988;334:430–431. doi: 10.1038/334430a0. [DOI] [PubMed] [Google Scholar]
- Klein RM. Inhibition of return. Trends in Cognitive Science. 2000;4:138–147. doi: 10.1016/s1364-6613(00)01452-2. [DOI] [PubMed] [Google Scholar]
- Klein RM, Farrell M. Search performance without eye movements. Perception & Psychophysics. 1989;46:476–482. doi: 10.3758/bf03210863. [DOI] [PubMed] [Google Scholar]
- Klein RM, MacInnes WJ. Inhibition of return is a foraging facilitator in visual search. Psychological Science. 1999;10:346–352. [Google Scholar]
- Klein RM, Pontefract A. Does oculomotor readiness mediate cognitive control of visual attention? In: Umilta C, Moskovitch M, editors. Attention and performance. XV. Cambridge, MA: MIT Press; 1994. pp. 333–350. Revisited! [Google Scholar]
- Koch C, Ullman S. Shift in selective visual attention: towards the underlying neural circuitry. Human Neurobiology. 1985;4:219–227. [PubMed] [Google Scholar]
- Kowler E, Anderson E, Dosher B, Blaser E. The role of attention in the programming of saccades. Vision Research. 1995;35:1897–1916. doi: 10.1016/0042-6989(94)00279-u. [DOI] [PubMed] [Google Scholar]
- Kustov A, Robinson DL. Shared neural control of attentional shifts and eye movements. Nature. 1996;384:74–77. doi: 10.1038/384074a0. [DOI] [PubMed] [Google Scholar]
- Lades M, Vorbruggen J, Buhmann J, Lange J, von der Malsburg C, Wurtz R, Konen W. Distortion invariant object recognition in the dynamic link architecture. IEEE Transactions on Computers. 1993;42:300–311. [Google Scholar]
- Landy M, Movshon A. Computational models of visual processing. Cambridge, MA: MIT Press; 1991. [Google Scholar]
- Lee C, Rohrer W, Sparks D. Population coding of saccadic eye movements by neurons in the superior colliculus. Nature. 1988;332:357–360. doi: 10.1038/332357a0. [DOI] [PubMed] [Google Scholar]
- Leung T, Malik J. Representing and recognizing the visual appearance of materials using three-dimensional textons. International Journal of Computer Vision. 2001;43:29–44. [Google Scholar]
- Levi DM, Klein SA, Aitsebaomo AP. Vernier acuity, crowding and cortical magnification. Vision Research. 1985;25:963–977. doi: 10.1016/0042-6989(85)90207-x. [DOI] [PubMed] [Google Scholar]
- Levin DT. Classifying faces by race: The structure of face categories. Journal of Experimental Psychology: Learning, Memory and Cognition. 1996;22:1364–1382. [Google Scholar]
- Levin DT, Takarae Y, Miner A, Keil FC. Efficient visual search by category: Specifying the features that mark the difference between artifacts and animals in preattentive vision. Perception and Psychophysics. 2001;63:676–697. doi: 10.3758/bf03194429. [DOI] [PubMed] [Google Scholar]
- Loftus G. Eye fixations and recognition memory for pictures. Cognitive Psychology. 1972;3:525–551. [Google Scholar]
- Logan G. The automaticity of academic life: Unconscious applications of an implicit theory. In: Wyer RS, editor. Advances in social cognition. Vol. 10. Mahwah, NJ: Erlbaum; 1997. pp. 157–179. [Google Scholar]
- Luck SJ, Vogel EK. The capacity of visual working memory for features and conjunctions. Nature. 1997;390:279–281. doi: 10.1038/36846. [DOI] [PubMed] [Google Scholar]
- Lu ZL, Dosher BA. External noise distinguishes attention mechanisms. Vision Research. 1998;38:1183–1198. doi: 10.1016/s0042-6989(97)00273-3. [DOI] [PubMed] [Google Scholar]
- Lu ZL, Dosher BA. Spatial attention: Different mechanisms for central and peripheral temporal precues? Journal of Experimental Psychology: Human Perception and Performance. 2000;26:1534–1548. doi: 10.1037//0096-1523.26.5.1534. [DOI] [PubMed] [Google Scholar]
- Malik J, Perona P. Preattentive texture discrimination with early vision mechanisms. Journal of the Optical Society of America A. 1990;7:923–932. doi: 10.1364/josaa.7.000923. [DOI] [PubMed] [Google Scholar]
- Mannan S, Ruddock K, Wooding D. Automatic control of saccadic eye movements made in visual inspection of briefly presented 2-d images. Spatial Vision. 1995;9:363–386. doi: 10.1163/156856895x00052. [DOI] [PubMed] [Google Scholar]
- Maylor EA, Hockey R. Inhibitory component of externally controlled covert orienting in visual space. Journal of Experimental Psychology: Human Perception and Performance. 1985;11:777–787. doi: 10.1037//0096-1523.11.6.777. [DOI] [PubMed] [Google Scholar]
- McCarley JS, Kramer AF, Wickens CD, Vidoni ED, Boot WR. Visual skills in airport security screening. Psychological Science. 2004;15:302–306. doi: 10.1111/j.0956-7976.2004.00673.x. [DOI] [PubMed] [Google Scholar]
- McConkie G, Rayner K. Identifying the span of the effective stimulus in reading: Literature review and theories of reading. In: Singer H, Ruddell RB, editors. Theoretical models and processes of reading. 2nd. Newark, DE: International Reading Association; 1976. pp. 137–162. [Google Scholar]
- McIlwain JT. Visual receptive fields and their images in superior colliculus of the cat. Journal of Neurophysiology. 1975;38:219–230. doi: 10.1152/jn.1975.38.2.219. [DOI] [PubMed] [Google Scholar]
- McIlwain JT. Lateral spread of neural excitation during microstimulation in intermediate gray layer of cat's superior colliculus. Journal of Neurophysiology. 1982;47:167–178. doi: 10.1152/jn.1982.47.2.167. [DOI] [PubMed] [Google Scholar]
- McIlwain JT. Distributed spatial coding in the superior colliculus: A review. Visual Neuroscience. 1991;6:3–13. doi: 10.1017/s0952523800000857. [DOI] [PubMed] [Google Scholar]
- Medin D, Goldstone R, Gentner D. Similarity involving attributes and relations: Judgments of similarity and difference are not inverses. Psychological Science. 1990;1:64–69. [Google Scholar]
- Medin D, Goldstone R, Gentner D. Respects for similarity. Psychological Review. 1993;100:254–278. [Google Scholar]
- Mel BW. Computation and Neural Systems Memo 6. California Institute of Technology; Pasadena, CA: 1990. The Sigma-Pi column: A model of associative learning in cerebral neocortex. [Google Scholar]
- Motter BC, Belky EJ. The guidance of eye movements during active visual search. Vision Research. 1998;38:1805–1815. doi: 10.1016/s0042-6989(97)00349-0. [DOI] [PubMed] [Google Scholar]
- Motter BC, Holsapple J. Saccades and covert shifts of attention during active visual search: Spatial distributions, memory, and items per fixation. Vision Research. 2007;47:1261–1281. doi: 10.1016/j.visres.2007.02.006. [DOI] [PubMed] [Google Scholar]
- Motter BC, Simoni DA. The roles of cortical image separation and size in active visual search performance. Journal of Vision. 2007;7:1–15. doi: 10.1167/7.2.6. [DOI] [PubMed] [Google Scholar]
- Müller HJ, von Mühlenen A. Attentional tracking and inhibition of return in dynamic displays. Perception & Psychophysics. 1996;58:224–249. doi: 10.3758/bf03211877. [DOI] [PubMed] [Google Scholar]
- Murthy A, Thompson KG, Schall JD. Dynamic dissociation of visual selection from saccade programming in frontal eye field. Journal of Neurophysiology. 2001;86:2634–2637. doi: 10.1152/jn.2001.86.5.2634. [DOI] [PubMed] [Google Scholar]
- Najemnik J, Geisler WS. Optimal eye movement strategies in visual search. Nature. 2005;434:387–391. doi: 10.1038/nature03390. [DOI] [PubMed] [Google Scholar]
- Navalpakkam V, Itti L. Modeling the influence of task on attention. Vision Research. 2005;45:205–231. doi: 10.1016/j.visres.2004.07.042. [DOI] [PubMed] [Google Scholar]
- Neider MB, Zelinsky GJ. Searching for camouflaged targets: Effects of target-background similarity on visual search. Vision Research. 2006a;46:2217–2235. doi: 10.1016/j.visres.2006.01.006. [DOI] [PubMed] [Google Scholar]
- Neider MB, Zelinsky GJ. Scene context guides eye movements during visual search. Vision Research. 2006b;46:614–621. doi: 10.1016/j.visres.2005.08.025. [DOI] [PubMed] [Google Scholar]
- Neuman O. Beyond capacity: A functional view of attention. In: Heuer H, Sanders AF, editors. Perspectives on perception and action. Hillsdale, NJ: Lawrence Erlbaum Associates Inc.; 1987. pp. 361–394. [Google Scholar]
- Newell FN, Brown V, Findlay JM. Is object search mediated by object-based or image-based representations. Spatial Vision. 2004;17:511–541. doi: 10.1163/1568568041920140. [DOI] [PubMed] [Google Scholar]
- Nickerson R. Short term memory for complex meaningful visual material. Canadian Journal of Psychology. 1965;19:155–160. doi: 10.1037/h0082899. [DOI] [PubMed] [Google Scholar]
- Nickerson R. A note on long term recognition memory for pictorial material. Psychonomic Science. 1968;11:58. [Google Scholar]
- Nobre AC, Sebestyen GN, Gitelman DR, Frith CD, Mesulam MM. Filtering of distractors during visual search studied by positron emission tomography. NeuroImage. 2002;16:968–976. doi: 10.1006/nimg.2002.1137. [DOI] [PubMed] [Google Scholar]
- Norman D, Shallice T. Attention to action: Willed and automatic control of behaviour. In: Davison R, Shwartz G, Shapiro D, editors. Consciousness and self regulation: Advances in research and theory. New York: Plenum; 1986. pp. 1–18. [Google Scholar]
- Noton D, Stark L. Scan paths in saccadic eye movements while viewing and recognizing patterns. Vision Research. 1971;11:929–942. doi: 10.1016/0042-6989(71)90213-6. [DOI] [PubMed] [Google Scholar]
- Olshausen B, Anderson C, van Essen D. A neurobiological model of visual attention and invariant pattern recognition based on dynamic routing of information. Journal of Neuroscience. 1993;13:4700–4719. doi: 10.1523/JNEUROSCI.13-11-04700.1993. [DOI] [PMC free article] [PubMed] [Google Scholar]
- Olshausen B, Field D. Emergence of simple-cell receptive field properties by learning a sparse code for natural images. Nature. 1996;381:607–609. doi: 10.1038/381607a0. [DOI] [PubMed] [Google Scholar]
- Oliva A, Torralba A, Castelhano M, Henderson JM. Top-down control of visual attention in object detection. IEEE Proceedings of the International Conference on Image Processing (Vol. I), IEEE; 2003. pp. 253–256. [Google Scholar]
- Oliva A, Wolfe JM, Arsenio H. Panoramic search: The interaction of memory and vision in search through a familiar scene. Journal of Experimental Psychology: Human Perception and Performance. 2004;30:1132–1146. doi: 10.1037/0096-1523.30.6.1132. [DOI] [PubMed] [Google Scholar]
- Ottes FP, Van Gisbergen JAM, Eggermont JJ. Latency dependence of colour-based target vs nontarget discrimination by the saccadic system. Vision Research. 1985;25:849–862. doi: 10.1016/0042-6989(85)90193-2. [DOI] [PubMed] [Google Scholar]
- Palmer J. Set-size effects in visual search: The effect of attention is independent of the stimulus for simple tasks. Vision Research. 1994;34:1703–1721. doi: 10.1016/0042-6989(94)90128-7. [DOI] [PubMed] [Google Scholar]
- Palmer J. Attention in visual search: Distinguishing four causes of a set-size effect. Current Directions in Psychological Science. 1995;4:118–123. [Google Scholar]
- Palmer J, Ames C, Lindsey D. Measuring the effect of attention on simple visual search. Journal of Experimental Psychology: Human Perception and Performance. 1993;19:108–130. doi: 10.1037//0096-1523.19.1.108. [DOI] [PubMed] [Google Scholar]
- Palmer J, Verghese P, Pavel M. The psychophysics of visual search. Vision Research. 2000;40:1227–1268. doi: 10.1016/s0042-6989(99)00244-8. [DOI] [PubMed] [Google Scholar]
- Palmer ST. The effects of contextual scenes on the identification of objects. Memory & Cognition. 1975;3:519–526. doi: 10.3758/BF03197524. [DOI] [PubMed] [Google Scholar]
- Parkhurst DJ, Law K, Niebur E. Modeling the role of salience in the allocation of overt visual selective attention. Vision Research. 2002;42:107–123. doi: 10.1016/s0042-6989(01)00250-4. [DOI] [PubMed] [Google Scholar]
- Perry JS, Geisler WS. In: Rogowitz B, Pappas T, editors. Gaze-contingent real-time simulation of arbitrary visual fields; Human Vision and Electronic Imaging, SPIE Proceedings; 2002. pp. 294–305. [Google Scholar]
- Poggio TA, Hurlbert A. Observations on cortical mechanisms for object recognition and learning. In: Koch C, Davis JL, editors. Large-scale neuronal theories of the brain. Cambridge, MA: MIT Press; 1995. pp. 153–182. [Google Scholar]
- Pomplun M. Saccadic selectivity in complex visual search displays. Vision Research. 2006;46:1886–1900. doi: 10.1016/j.visres.2005.12.003. [DOI] [PubMed] [Google Scholar]
- Pomplun M, Reingold EM, Shen J. Area activation: A computational model of saccadic selectivity in visual search. Cognitive Science. 2003;27:299–312. [Google Scholar]
- Posner MI. Orienting of attention. Quarterly Journal of Experimental Psychology. 1980;32:3–25. doi: 10.1080/00335558008248231. [DOI] [PubMed] [Google Scholar]
- Posner MI, Cohen Y. Components of visual orienting. In: Bouma H, Bouwhuis DG, editors. Attention and performance X: Control of language processes. Hillsdale, N. J.: Erlbaum; 1984. pp. 531–556. [Google Scholar]
- Posner M, Nissen M, Ogden W. Attended and unattended processing modes: The role of set for spatial location. In: Pick N, Saltzman I, editors. Modes of perceiving and processing information. Hillsdale, NJ: Erlbaum; 1978. pp. 137–157. [Google Scholar]
- Posner M, Snyder C, Davidson B. Attention and the detection of signals. Journal of Experimental Psychology: General. 1980;109:160–174. [PubMed] [Google Scholar]
- Rao R, Zelinsky G, Hayhoe M, Ballard D. Modeling saccadic targeting in visual search. In: Touretzky D, Mozer M, Hasselmo M, editors. Advances in Neural Information Processing Systems. Vol. 8. Cambridge, MA: MIT Press; 1996. pp. 830–836. [Google Scholar]
- Rao R, Zelinsky G, Hayhoe M, Ballard D. Eye movements in iconic visual search. Vision Research. 2002;42:1447–1463. doi: 10.1016/s0042-6989(02)00040-8. [DOI] [PubMed] [Google Scholar]
- Rayner K. Eye movements in reading and information processing. Psychological Bulletin. 1978;85:618–660. [PubMed] [Google Scholar]
- Rayner K. Eye movements in reading and information processing: 20 years of research. Psychological Bulletin. 1998;124:372–422. doi: 10.1037/0033-2909.124.3.372. [DOI] [PubMed] [Google Scholar]
- Rayner K, McConkie G, Ehrlich S. Eye movements and integrating information across fixations. Journal of Experimental Psychology: Human Perception and Performance. 1978;4:529–544. doi: 10.1037//0096-1523.4.4.529. [DOI] [PubMed] [Google Scholar]
- Reichle ED, Laurent PA. Using reinforcement learning to understand the emergence of “intelligent” eye-movement behavior during reading. Psychological Review. 2006;113:390–408. doi: 10.1037/0033-295X.113.2.390. [DOI] [PubMed] [Google Scholar]
- Reichle ED, Rayner K, Pollatsek A. The E-Z Reader model of eye movement control in reading: Comparisons to other models. Behavioral and Brain Sciences. 2003;26:445–476. doi: 10.1017/s0140525x03000104. [DOI] [PubMed] [Google Scholar]
- Reilly RG, O'Regan JK. Eye movement control during reading: A simulation of some word-targeting strategies. Vision Research. 1998;38:303–317. doi: 10.1016/s0042-6989(97)87710-3. [DOI] [PubMed] [Google Scholar]
- Rensink R, O'Regan K, Clark J. To see or not to see: The need for attention to perceive changes in scenes. Psychological Science. 1997;8:368–373. [Google Scholar]
- Reynolds JH, Chelazzi L. Attentional modulation of visual processing. Annual Review of Neuroscience. 2004;27:611–647. doi: 10.1146/annurev.neuro.26.041002.131039. [DOI] [PubMed] [Google Scholar]
- Rohaly A, Ahumada A, Watson A. Object detection in natural backgrounds predicted by discrimination performance and models. Vision Research. 1997;37:3225–3235. doi: 10.1016/s0042-6989(97)00156-9. [DOI] [PubMed] [Google Scholar]
- Rosch E. Natural categories. Cognitive Psychology. 1973;4:328–350. [Google Scholar]
- Rumelhart D, McClelland J. Parallel distributed processing: Explorations in the microstructure of cognition. Cambridge, MA: MIT Press; 1986. [DOI] [PubMed] [Google Scholar]
- Rutishauser U, Koch C. Probabilistic modeling of eye movement data during conjunction search via feature-based attention. Journal of Vision. 2007;7:1–20. doi: 10.1167/7.6.5. [DOI] [PubMed] [Google Scholar]
- Sagi D, Julesz B. “Where and “what” in vision. Science. 1985;228:1217–1219. doi: 10.1126/science.4001937. [DOI] [PubMed] [Google Scholar]
- Samuel AG, Weiner SK. Attentional consequences of object appearance and disappearance. Journal of Experimental Psychology: Human Perception and Performance. 2001;27:1433–1451. [PubMed] [Google Scholar]
- Scialfa C, Joffe K. Response times and eye movements in feature and conjunction search as a function of target eccentricity. Perception & Psychophysics. 1998;60:1067–1082. doi: 10.3758/bf03211940. [DOI] [PubMed] [Google Scholar]
- Scinto L, Pillalamarri R, Karsh R. Cognitive strategies for visual search. Acta Psychologica. 1986;62:263–292. doi: 10.1016/0001-6918(86)90091-0. [DOI] [PubMed] [Google Scholar]
- Schall JD, Thompson KG. Neural selection and control of visually guided eye movements. Annual Review of Neuroscience. 1999;22:241–259. doi: 10.1146/annurev.neuro.22.1.241. [DOI] [PubMed] [Google Scholar]
- Sejnowski TJ. Neural populations revealed. Nature. 1988;332:308. doi: 10.1038/332308a0. [DOI] [PubMed] [Google Scholar]
- Simons D, Levin D. Change blindness. Trends in Cognitive Sciences. 1997;1:261–267. doi: 10.1016/S1364-6613(97)01080-2. [DOI] [PubMed] [Google Scholar]
- Simons D, Levin D. Failure to detect changes to people during a real-world interaction. Psychonomic Bulletin & Review. 1998;5:644–649. [Google Scholar]
- Shapley R. Visual sensitivity and parallel retino-cortical channels. Annual Review of Psychology. 1990;41:635–658. doi: 10.1146/annurev.ps.41.020190.003223. [DOI] [PubMed] [Google Scholar]
- Shaw M. Attending to multiple sources of information. Cognitive Psychology. 1982;14:353–409. [Google Scholar]
- Sheinberg DL, Logothetis NK. Noticing familiar object in real world scenes: The role of temporal cortical neurons in natural vision. The Journal of Neuroscience. 2001;21:1340–1350. doi: 10.1523/JNEUROSCI.21-04-01340.2001. [DOI] [PMC free article] [PubMed] [Google Scholar]
- Sheliga B, Riggio L, Rizzolatti G. Orienting of attention and eye movements. Experimental Brain Research. 1994;98:507–522. doi: 10.1007/BF00233988. [DOI] [PubMed] [Google Scholar]
- Shepard R. Recognition memory for words, sentences, and pictures. Journal of Verbal Learning and Verbal Behavior. 1967;6:156–163. [Google Scholar]
- Shepherd M, Findlay J, Hockey R. The relationship between eye movements and spatial attention. Quarterly Journal of Experimental Psychology. 1986;38A:475–491. doi: 10.1080/14640748608401609. [DOI] [PubMed] [Google Scholar]
- Shiu L, Pashler H. Negligible effect of spatial precueing on identification of single digits. Journal of Experimental Psychology: Human Perception and Performance. 1994;20:1037–1054. [Google Scholar]
- Sparks DL, Kristan WB, Shaw BK. The role of population coding in the control of movement. In: Stein, Grillner, Selverston, Stuart, editors. Neurons, Networks, and Motor Behavior. MIT Press; 1997. pp. 21–32. [Google Scholar]
- Sperling GS, Weichselgartner E. Episodic theory of the dynamics of spatial attention. Psychological Review. 1995;102:503–532. [Google Scholar]
- Stampe DM. Heuristic filtering and reliable calibration methods for video-based pupil-tracking systems. Behavioral Research Methods, Instruments and Computers. 1993;25:137–142. [Google Scholar]
- Standing L. Learning 10,000 pictures. Quarterly Journal of Experimental Psychology. 1973;25:207–222. doi: 10.1080/14640747308400340. [DOI] [PubMed] [Google Scholar]
- Swensson R, Judy P. Detection of noisy targets: Models for the effects of spatial uncertainty and signal-to-noise ratio. Perception & Psychophysics. 1981;29:521–534. doi: 10.3758/bf03207369. [DOI] [PubMed] [Google Scholar]
- Tarr M, Bülthoff H. Is human object recognition better described by geon-structural-descriptions or by multiple-views? Journal of Experimental Psychology: Human Perception and Performance. 1995;21:1494–1505. doi: 10.1037//0096-1523.21.6.1494. [DOI] [PubMed] [Google Scholar]
- Tarr M, Bülthoff H. Image-based object recognition in man, monkey and machine. Cognition. 1998;67:1–20. doi: 10.1016/s0010-0277(98)00026-2. [DOI] [PubMed] [Google Scholar]
- Tatler BW, Baddeley RJ, Gilchrist ID. Visual correlates of fixation selection: Effects of scale and time. Vision Research. 2005;45:643–659. doi: 10.1016/j.visres.2004.09.017. [DOI] [PubMed] [Google Scholar]
- Theeuwes J. Exogenous and endogenous control of attention: The effect of visual onsets and offsets. Perception & Psychophysics. 1991;49:83–90. doi: 10.3758/bf03211619. [DOI] [PubMed] [Google Scholar]
- Theeuwes J. Stimulus-driven capture and attentional set: selective search for color and visual abrupt onsets. Journal of Experimental Psychology: Human Perception and Performance. 1994;20:799–806. doi: 10.1037//0096-1523.20.4.799. [DOI] [PubMed] [Google Scholar]
- Theeuwes J. Top down search strategies cannot override attentional capture. Psychonomic Bulletin & Review. 2004;11:65–70. doi: 10.3758/bf03206462. [DOI] [PubMed] [Google Scholar]
- Theeuwes J, Kramer A, Hahn S, Irwin D, Zelinsky GJ. Influence of attentional capture on oculomotor control. Journal of Experimental Psychology: Human Perception and Performance. 1999;25:1595–1608. doi: 10.1037//0096-1523.25.6.1595. [DOI] [PubMed] [Google Scholar]
- Thorpe S, Fize D, Marlot C. Speed of processing in the human visual system. Nature. 1996;381:520–522. doi: 10.1038/381520a0. [DOI] [PubMed] [Google Scholar]
- Tipper SP, Weaver B, Jerreat LM, Burak AL. Object-based and environment-based inhibition of return of visual attention. Journal of Experimental Psychology: Human Perception and Performance. 1994;20(3):478–499. [PubMed] [Google Scholar]
- Toet A, Bijl P, Kooi FL, Valeton JM. A high-resolution image dataset for testing search and detection models (TNO-NM-98-A020) TNO Human Factors Research Institute; Soesterberg, The Netherlands: 1998. [Google Scholar]
- Toet A, Kooi FL, Bijl P, Valeton JM. Visual conspicuity determines human target acquisition performance. Optical Engineering. 1998;37:1969–1975. [Google Scholar]
- Torralba A, Oliva A, Castelhano M, Henderson JM. Contextual guidance of attention in natural scenes: The role of global features on object search. Psychological Review. 2006;113:766–786. doi: 10.1037/0033-295X.113.4.766. [DOI] [PubMed] [Google Scholar]
- Townsend J. Serial and within-stage independent parallel model equivalence on the minimum completion time. Journal of Mathematical Psychology. 1976;14:219–238. [Google Scholar]
- Townsend J. Serial vs. parallel processing: Sometimes they look like tweedledum and tweedledee but they can (and should) be distinguished. Psychological Science. 1990;1:46–54. [Google Scholar]
- Trappenberg TP, Dorris MC, Munoz DP, Klein RM. A model of saccade initiation based on based on the competitive integration of exogenous and endogenous signals in the superior colliculus. Journal of Cognitive Neuroscience. 2001;13:256–271. doi: 10.1162/089892901564306. [DOI] [PubMed] [Google Scholar]
- Treisman A. Features and objects: The Fourteenth Bartlett Memorial Lecture. Quarterly Journal of Experimental Psychology. 1988;40A:201–237. doi: 10.1080/02724988843000104. [DOI] [PubMed] [Google Scholar]
- Treisman A. Search, similarity, and integration of features between and within dimensions. Journal of Experimental Psychology: Human Perception and Performance. 1991;17:652–676. doi: 10.1037//0096-1523.17.3.652. [DOI] [PubMed] [Google Scholar]
- Treisman AM, Gelade G. A feature integration theory of attention. Cognitive Psychology. 1980;12:97–136. doi: 10.1016/0010-0285(80)90005-5. [DOI] [PubMed] [Google Scholar]
- Treisman AM, Gormican S. Feature analysis in early vision: Evidence from search asymmetries. Psychological Review. 1988;95:14–48. doi: 10.1037/0033-295x.95.1.15. [DOI] [PubMed] [Google Scholar]
- Treisman AM, Sato S. Conjunction search revisited. Journal of Experimental Psychology: Human Perception and Performance. 1990;16:459–478. doi: 10.1037//0096-1523.16.3.459. [DOI] [PubMed] [Google Scholar]
- Treisman A, Souther J. Search asymmetry: A diagnostic for preattentive processing of separable features. Journal of Experimental Psychology: General. 1985;114:285–310. doi: 10.1037//0096-3445.114.3.285. [DOI] [PubMed] [Google Scholar]
- Tsotsos J, Culhane S, Wai W, Lai Y, Davis N, Nuflo F. Modeling visual attention via selective tuning. Artificial Intelligence. 1995;78:507–545. [Google Scholar]
- Ullman S. Visual routines. Cognition. 1984;18:97–159. doi: 10.1016/0010-0277(84)90023-4. [DOI] [PubMed] [Google Scholar]
- Underwood G, Foulsham T. Visual saliency and semantic incongruency influence eye movements when inspecting pictures. Quarterly Journal of Experimental Psychology. 2006;59:1931–1945. doi: 10.1080/17470210500416342. [DOI] [PubMed] [Google Scholar]
- Van Opstal AJ, Van Gisbergen JAM. Biological Cybernetics. 1989;60:171–183. doi: 10.1007/BF00207285. [DOI] [PubMed] [Google Scholar]
- Van Zoest W, Donk M, Theeuwes J. The role of stimulus-driven and goal-driven control in saccadic visual selection. Journal of Experimental Psychology: Human Perception and Performance. 2004;30:746–759. doi: 10.1037/0096-1523.30.4.749. [DOI] [PubMed] [Google Scholar]
- Viola P, Jones MJ, Snow D. Detecting pedestrians using patterns of motion and appearance. International Journal of Computer Vision. 2005;63:153–161. [Google Scholar]
- Viviani P. Eye movements in visual search: Cognitive, perceptual and motor control aspects. In: Kowler E, editor. Eye movements and their role in visual and cognitive processes. Elsevier; 1990. pp. 353–393. [PubMed] [Google Scholar]
- Ward R, Duncan J, Shapiro K. The slow time-course of visual attention. Cognitive Psychology. 1996;30:79–109. doi: 10.1006/cogp.1996.0003. [DOI] [PubMed] [Google Scholar]
- Williams D, Reingold E, Moscovitch M, Behrmann M. Patterns of eye movements during parallel and serial visual search tasks. Canadian Journal of Experimental Psychology. 1997;51:151–164. doi: 10.1037/1196-1961.51.2.151. [DOI] [PubMed] [Google Scholar]
- Williams LG. The effect of target specification on objects fixated during visual search. Perception & Psychophysics. 1966;1:315–318. doi: 10.1016/0001-6918(67)90080-7. [DOI] [PubMed] [Google Scholar]
- Wolfe JM. Guided search 2.0: A revised model of visual search. Psychonomic Bulletin and Review. 1994;1:202–238. doi: 10.3758/BF03200774. [DOI] [PubMed] [Google Scholar]
- Wolfe JM. What can 1 million trials tell us about visual search? Psychological Science. 1998a;9:33–39. [Google Scholar]
- Wolfe JM. Visual search. In: Pashler H, editor. Attention. London: University College London Press; 1998b. pp. 13–71. [Google Scholar]
- Wolfe JM, Alvarez GA, Horowitz TS. Attention is fast but volition is slow. Nature. 2000;406:691. doi: 10.1038/35021132. [DOI] [PubMed] [Google Scholar]
- Wolfe JM, Cave K, Franzel S. Guided search: An alternative to the feature integration model for visual search. Journal of Experimental Psychology: Human Perception and Performance. 1989;15:419–433. doi: 10.1037//0096-1523.15.3.419. [DOI] [PubMed] [Google Scholar]
- Wolfe JM, Friedman-Hill S, Stewart M, O'Connell K. The role of categorization in visual search for orientation. Journal of Experimental Psychology: Human Perception and Performance. 1992;18:34–49. doi: 10.1037//0096-1523.18.1.34. [DOI] [PubMed] [Google Scholar]
- Wolfe JM, Gancarz G. Guided Search 3.0. In: Lakshminarayanan V, editor. Basic and clinical applications of vision science. Dordrecht: Kluwer; 1996. pp. 189–192. [Google Scholar]
- Wolfe JM, Horowitz TS, Kenner N, Hyle M, Vasan N. How fast can you change your mind? The speed of top-down guidance in visual search. Vision Research. 2004;44:1411–1426. doi: 10.1016/j.visres.2003.11.024. [DOI] [PubMed] [Google Scholar]
- Wolfe JM, Oliva A, Horowitz TS, Butcher SJ, Bompas A. Segmentation of objects from backgrounds in visual search tasks. Vision Research. 2002;42:2985–3004. doi: 10.1016/s0042-6989(02)00388-7. [DOI] [PubMed] [Google Scholar]
- Yamada K, Cottrell G. A model of scan paths applied to face recognition. Proceedings of the Seventeenth Annual Cognitive Science Conference; 1995. pp. 55–60. [Google Scholar]
- Yang H, Zelinsky GJ. Evidence for guidance in categorical visual search. Journal of Vision. 2006;6(6):449a. [Google Scholar]
- Yantis S. Goal directed and stimulus driven determinants of attentional control. In: Monsell S, Driver J, editors. Attention & Performance. Vol. 18. Cambridge: MIT Press; 2000. pp. 73–103. [Google Scholar]
- Yantis S, Hillstrom A. Stimulus-driven attentional capture: Evidence from equiluminant visual objects. Journal of Experimental Psychology: Human Perception and Performance. 1994;20:95–107. doi: 10.1037//0096-1523.20.1.95. [DOI] [PubMed] [Google Scholar]
- Yantis S, Jonides J. Attentional capture by abrupt onsets: New perceptual objects or visual masking? Journal of Experimental Psychology: Human Perception and Performance. 1996;22:1505–1513. doi: 10.1037//0096-1523.22.6.1505. [DOI] [PubMed] [Google Scholar]
- Yeshurun Y, Carrasco M. Attention improves or impairs visual performance by enhancing spatial resolution. Nature. 1998;396:72–75. doi: 10.1038/23936. [DOI] [PMC free article] [PubMed] [Google Scholar]
- Zelinsky GJ. Using eye saccades to assess the selectivity of search movements. Vision Research. 1996;36:2177–2187. doi: 10.1016/0042-6989(95)00300-2. [DOI] [PubMed] [Google Scholar]
- Zelinsky GJ. Precueing target location in a variable set size “nonsearch” task: Dissociating search-based and interference-based explanations for set size effects. Journal of Experimental Psychology: Human Perception and Performance. 1999;25:875–903. [Google Scholar]
- Zelinsky GJ. Eye movements during change detection: Implications for search constraints, memory limitations, and scanning strategies. Perception & Psychophysics. 2001;63:209–225. doi: 10.3758/bf03194463. [DOI] [PubMed] [Google Scholar]
- Zelinsky GJ. Detecting changes between real-world objects using spatiochromatic filters. Psychonomic Bulletin & Review. 2003;10:533–555. doi: 10.3758/bf03196516. [DOI] [PubMed] [Google Scholar]
- Zelinsky GJ. Specifying the components of attention in a visual search task. In: Itti L, Rees G, Tsotsos J, editors. Neurobiology of attention. Elsevier; 2005a. pp. 395–400. [Google Scholar]
- Zelinsky GJ. The BOLAR theory of eye movements during visual search. Abstracts of the 46th Annual Meeting of the Psychonomic Society; Toronto, Canada. 2005b. p. 23. [Google Scholar]
- Zelinsky GJ, Loschky LC. Eye movements serialize memory for objects in scenes. Perception & Psychophysics. 2005;67:676–690. doi: 10.3758/bf03193524. [DOI] [PubMed] [Google Scholar]
- Zelinsky GJ, Rao R, Hayhoe M, Ballard D. Eye movements reveal the spatio-temporal dynamics of visual search. Psychological Science. 1997;8:448–453. [Google Scholar]
- Zelinsky GJ, Sheinberg D. Why some search tasks take longer than others: Using eye movements to redefine reaction times. In: Findlay J, Kentridge R, Walker R, editors. Eye movement research: Mechanisms, processes and applications. Amsterdam: Elsevier; 1995. pp. 325–336. [Google Scholar]
- Zelinsky GJ, Sheinberg D. Eye movements during parallel–serial visual search. Journal of Experimental Psychology: Human Perception and Performance. 1997;23:244–262. doi: 10.1037//0096-1523.23.1.244. [DOI] [PubMed] [Google Scholar]
- Zelinsky GJ, Zhang W, Yu B, Chen X, Samaras D. The role of top-down and bottom-up processes in guiding eye movements during visual search. In: Weiss Y, Scholkopf B, Platt J, editors. Advances in Neural Information Processing Systems. Vol. 18. Cambridge, MA: MIT Press; 2006. pp. 1569–1576. [Google Scholar]
- Zhang W, Yang H, Samaras D, Zelinsky GJ. A computational model of eye movements during object class detection. In: Weiss Y, Scholkopf B, Platt J, editors. Advances in Neural Information Processing Systems. Vol. 18. Cambridge, MA: MIT Press; 2006. pp. 1609–1616. [Google Scholar]
- Zhang W, Yu B, Zelinsky GJ, Samaras D. Object class recognition using multiple layer boosting with heterogeneous features. Proceedings of the IEEE Computer Society Conference on Computer Vision and Pattern Recognition (CVPR); 2005. pp. 323–330. [Google Scholar]