


Abstract
There have been two types of well-characterized DNA sequence periodicities; both are found to be associated with important molecular mechanisms. One is a 3-nt periodicity corresponding to codon triplets, the other is a 10.5-nt periodicity related to the structure of DNA helixes. In the process of analyzing the genome and transcriptome of Trichomonas vaginalis, we observed a 120.9-nt periodicity along DNA sequences. Different from the 3- and 10.5-nt periodicities, this novel periodicity originates near the 5′-end of transcripts, extends along the direction of transcription, and weakens gradually along transcripts. As a result, codon usage as well as amino acid composition is constrained by this periodicity. Similar periodicities were also identified in other organisms, but with variable length associated with the length of nucleosome units. We validated this association experimentally in T. vaginalis, and demonstrated that the periodicity manifests nucleotide variations between linker-DNA and wrapping-DNA along nucleosome array. We conclude that this novel DNA sequence periodicity is a signature of nucleosome organization suggesting that nucleosomes are well-positioned with regularity, especially near the 5′-end of transcripts.
INTRODUCTION
DNA sequence variations are created through synthetic errors, concerning two essential molecular mechanisms: genome replication and DNA damage–repair; these errors are fixed gradually among genomes through drift and selection over time, leaving various sequence signatures (1–3). DNA sequence periodicity represents one of such signatures, and there have been two well-characterized periodicities among genomes with either 10.5 nt or 3 nt in periodicity length. The 10.5-nt periodicity tends to be close to 11 nt in bacteria, but it is close to 10 nt in archaea and eukaryotes (4). The plausible explanation for the 10.5-nt periodicity has been attributed to chromatin organization (5,6), where DNA double helix exhibits a periodicity of approximately 10.5 nt (7,8), and among eukaryotic genomes it is further folded into nucleosome arrays (9–11). Each nucleosome is composed of a histone octamer wrapped around by double-stranded DNA (12,13), and this packaging makes bases face inward toward the histone octamer less accessible than those facing outward, resulting in a 10.5-nt periodicity in nucleotide composition (5,6,9). The longer length of this periodicity in bacteria was postulated to reflect a less condensed organization of prokaryotic chromatins, and was suggested to be associated with negative DNA supercoiling (14). The 3-nt periodicity is characteristic of protein-coding sequences, and perhaps arises from the selective pressure for proteins and their codons (15–17).
We started our investigation on DNA sequence periodicity of Trichomonas vaginalis, a unicellular parasite found in human urogenital tracts (18,19), as its genomic DNA degrades unusually fast when a common procedure for isolating large DNA fragments were carried out. This organism is an ancient protozoa that lacks mitochondrion but contains hydrogenosome instead, albeit rooted deeply in the eukaryotic branch (19). Recent studies revealed that T. vaginalis genes possess unusually short 5′- and 3′-UTR, 5–20 nt in length (20), and that the organism's genome harbors a large number of heavily duplicated genes (21). In this work, we first describe the discovery of a novel sequence periodicity and its characteristic in the T. vaginalis sequence, then generalize this observation among other unicellular organisms, and finally discuss the biological implications of this novel periodicity.
MATERIALS AND METHODS
The datasets
Our T. vaginalis expressed sequence tag (EST) data includes 71 594 EST sequences generated in our laboratories (Petrus Tang et al., unpublished data) and 20 002 additional ESTs from GenBank. The T. vaginalis genome sequence (∼177 Mb) and 99 319 predicted genes were downloaded from the TIGR database (ftp://ftp.tigr.org/pub/data/Eukaryotic_Projects/t_vaginalis/) on 24 January 2007. The sequence data for assessing nucleosome binding in Saccharomyces cerevisiae were kindly provided by Vishwanath R. Iyer (http://www.iyerlat.org/nucleosome). All other datasets used for this analysis were from GenBank databases.
To separate T. vaginalis genes from the intergenic sequences, we aligned ESTs to the assembled genomic sequences, predicted genes and classified the predicted genes into three categories according to reliability. First, if an EST matches to a genomic region that corresponds to an annotated gene, and if its alignment score is 300 above the second highest score for the same EST, we considered this gene as verified by this EST. This definition yielded a set of 8093 most reliable genes. Second, if a predicted gene matches EST sequences with a score lower than 100, or no EST matches, but yielding clear annotations, we classified these genes as moderately reliable; this dataset contains 6712 genes. Third, when genes are annotated as ‘hypothetical proteins’ or did not yield any meaningful information from their annotations, we classified them as the least reliable gene set that grouped 47 812 genes. We also aligned all the predicted genes to the genome, and masked all matched genomic sequences with a blast score of 30 or above; this process yielded 36.67 Mb unmasked fragments or intergenic sequences, which are longer than 200 bp.
Power spectra
Power spectrum analysis is a popular method for detecting periodicity in numerical sequences. To accelerate calculation, we used Fast Fourier Transform algorithm to compute power spectrum. For a sequence xk of length 2N (N is a positive integer), its power spectrum is expressed as:
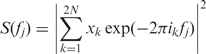 |
where i2 = −1, and fj = j/2N (j = 0, 1, …, N).
To apply power spectrum analysis to DNA sequences, we first translated each DNA sequence into a binary sequence xk: when nucleotide G or C present at position k, xk = 1, otherwise, xk = 0. Resultant binary sequences are then joined into one sequence, and again split into 2N-nt fragments (N = 8192 in Figure 1a; N = 512 in Figures 1b and 3). Power spectrum was calculated for each of these fragments first and plotted the results for all fragments after being averaged.
Figure 1.

Power spectrum density (PSD) analysis of T. vaginalis genomic sequences. Periodicities correspond to spikes above the baseline in the plots. (a) When PSD was applied in a traditional way to identify all sequence periodicities in four different datasets (most reliable genes, moderately reliable genes, least reliable genes and intergenic sequences), there were three major spikes found at length ranges of 3.0, 120.9 and 10.1nt. Periodicities appear more pronounced in more reliable genes. (b) When PSD was applied in a novel way to distinguish periodicities that are in phase with CDS-start, only 3.0 and 120.9-nt periodicities are identified as in phase with CDS-start.
To distinguish periodicities that are in phase with CDS-start, we have applied power spectrum analysis in a novel way. After aligning transcripts with the origin at the junction of the 5′-UTR and the coding sequence (CDS), we calculated GC content (X) for each nucleotide position (K) in bulk for transcripts, generated a binary sequence Xk (k = 0, 1, …, 1024), and subsequently applied the power spectrum analysis to the binary sequence.
Micrococcal nuclease digestion
We harvested T. vaginalis (To16) cells (20 mg) from a 36-h culture by centrifugation and, washed twice with 200 μl PBS (pH 6.0), and resuspended in 400 μl digestion buffer (20 mM Tris–HCL, 5 mM NaCl, 2.5 mM CaCl2, pH 8.0). The cells were homogenized with a PRO200 homogenizer for 30 s. The lysates were incubated with 0.5 μl (∼10U) micrococcal nuclease for 1, 3, 5, 7, 9, 11, 13, 15, 17, 19 and 21 min at 37°C, and the reactions were stopped with 25 mM EDTA. The reaction mixtures were subsequently incubated with 12 μg pancreatic RNase for 1 h at 37°C, followed by incubation with 0.5% SDS for another hour at 37°C and 80 μg proteinase K at 50°C for 3.5 h. Cold ethanol (2.5 volumes of the mixture) was added to precipitate DNA. The isolated DNA was resuspended in 20 μl TE, and 10 μl of this final DNA solution was subjected to electrophoresis with 3% agarose gels.
RESULTS
Power spectrum analysis revealed two types of nucleotide periodicities
Our power spectrum analyses for DNA sequence periodicity began with the T. vaginalis genome sequence based on four datasets: the most reliable, moderately reliable, and least reliable gene sets as well as a collection of intergenic sequences. Three major peaks at 120.9, 10.1 and 3.0 nt in unit lengths were readily observed (Figure 1). The 3- and 10.1-nt periodicities have been reported previously in genomes of both prokaryotes and eukaryotes (22), whereas the 120.9-nt periodicity have not yet been described in literature. All these three periodicities appear more pronounced for gene sequences (Figure 1a), suggesting potential associations with genic or protein-coding sequences. To further investigate these associations, we improved the algorithm for power spectrum analysis to discriminate periodicities that are in phase with CDS-start or not (Figure 1b). In-phase periodicities should share same phase among genes at the junction of 5′-UTR and CDS. The two major peaks, at the coordinates of 120.9 and 3 nt, remained in the spectrum for in-phase periodicities but the 10.1-nt periodicity disappeared (Figure 1b), since the 3-nt periodicity is a signature of the codon triplet (15,16) and the 10.1-nt periodicity is associated with DNA double-helix structure and the eukaryotic chromatin organization (5,6,14).
The 120.9-nt periodicity in the T. vaginalis genic sequences
To further investigate the 120.9-nt periodicity, we calculated GC content for each nucleotide position along transcripts among the most reliable set of genes, partitioning the three nucleotide positions of codons into GC1, GC2 and GC3 (Figure 2a). The 120.9-nt periodicity showed several interesting characteristics. First, it is most pronounced at the third codon position (Figure 2a and b), where at least half of the nucleotide variations do not lead to amino acid composition changes (23). The periodicity also appeared stronger at GC1 than GC2, largely due to the rigidity at the second codon position where nucleotide variations often lead to amino acid changes that convert physiochemical properties (23). Second, the periodicity appears starting at the junction between 5′-UTR and CDS. To further validate this observation, we plotted the GC content with origins at the junction between CDS and 3′-UTR, then the 120.9-nt periodicity was abolished (Figure 2c). We also plotted the GC content starting at the second ATG codon downstream of the real (first) start codon, and observed a weakening periodicity (Figure 2d). Third, the 120.9-nt periodicity seems more striking at the 5′-end of CDS, extends only along the direction of transcription, and deteriorates completely beyond ∼2000 nt. To exclude the possibility of any length effect, we divided our collection of genes into six different length classes, and did not observed obvious deviations from the norm (Supplementary Figure S1). Fourth, despite the fact that this periodicity seemed aligning with the translation start site, we believe that it initiates from the transcription start site for two reasons. One points to the extremely short 5′-UTR in the T. vaginalis genes so that we are unable to distinguish the difference between these two starts. The other is the uneven selection pressure between protein-coding and nonprotein-coding sequences, so that the sequence signature may not be detectable in the UTR regions when compared to protein-coding regions.
Figure 2.

GC-content plotted as a function of nucleotide position among genes. (a) The plot was generated with origin at the junction between 5′-untranslated and coding regions. (b) An enlarged view of what in (a). (c) The plot was generated with origin at the junction between coding and 3′-UTRs. (d) The plot was generated using the second ATG codon instead of the real start codon as the origin. The value at each position was an average over the most reliable genes. Three nucleotide positions for codon triplets were plotted separately as GC1, GC2 and GC3.
In addition to the periodicities, we also observed a positive GC-content gradient along genes. Similar to the case of the 120.9-nt periodicity, the gradient effect appears more pronounced in GC3 and at the 5′-end of CDS. The GC3 curve was fitted as:
where X(k) represents GC content at a position that is K nucleotides away from the junction between 5′-UTR and CDS. The right side of this equation can be split into two parts: the first
describes a baseline for GC3, and the second
yields a sine undulation with a period length of 120.9 nt.
The universal 10.5-nt periodicity in genomes of all three kingdoms was explained primarily as a periodic distribution of dinucleotides, and different dinucleotide contributes differently to the periodicity, such as the dominant effect of ApA/TpT (22). Although the individual nucleotides contribute to the 120.9-nt periodicity with little difference (Supplementary Figure S2a), the 120.9-nt periodicity seems to prefer different combinations of the 16 dinucleotide, ranging from the strongest, such as ApA and TpT, to the weakest, such as TpA, GpA and CpG (Supplementary Figure S2b). In addition, this periodicity has obvious directionality along the direction of transcription, manifesting clearly among the complementary dinucleotide pairs, such as ApC/GpT and CpA/TpG.
Universality of the 120.9-nt periodicity
The ability to detect a transcript-centric periodicity is governed by strength of the periodicity relevant to reliability and adequacy of the datasets. Since the 120.9-nt periodicity in T. vaginalis genome is rather transcript-centric, the amount of EST-validated gene sequences played a critical role in its successful detection (Figure 3). We have tried to collect data from other organisms and attempted to generalize this discovery with a caveat of lacking adequate amount of validated gene sequences and pronounced effects. We did observe similar periodicities in some of the organisms simply by applying our power spectrum analysis, especially in some archaea and unicellular eukaryotic species (Figure 3). To further validate the results, we also tried to illustrate these periodicities in mononucleotide and dinucleotide compositions, as we have done for the 120.9-nt periodicity in T. vaginalis genome, and observed at least two similar periodicities with lengths of ∼132 and 156 nt in Giardia lamblia and Yarrowia lipolytica, respectively (Supplementary Figure S3). Similar to the T. vaginalis 120.9-nt periodicity, these periodicities also start at the 5′-end of CDS, appeared more obvious in GC3 along the direction of transcription, extending over 1500 nt in length. The dinucleotide preference of the two periodicities is distinguished from that of the T. vaginalis 120.9-nt periodicity, in that the 132-nt periodicity of G. lamblia prefers ApT, TpA and CpC, whereas the 156-nt periodicity of Y. lipolytica prefers GpC, CpG and ApG.
Figure 3.

Power spectra for periodicities that are in phase with CDS-start in genes of different species. Most of the spectra were based on coding sequences from selected multicellular and unicellular organisms, except those labeled in bold—which were EST-verified coding sequences of T. vaginalis and transcript sequences that include multiple introns and exons of Arabidopsis thaliana and Homo sapiens.
On the biology implication of the 120.9-nt periodicity
In the process of identifying similar periodicities among different species, we observed that the lengths of these periodicities range from 150 to 200 nt, which is capable of folding into a nucleosome unit in eukaryotes (24). We realized that these periodicities may relate to the organization of nucleosomes among different species as histone polymers in archaea and eukaryotes form stable complex with 50–200 bp DNA sequences (25–28). We went on to measure the unit length of T. vaginalis nucleosomes based on micrococcal nuclease digestion (Figure 4). The DNA ladders with fragment lengths of 480, 360 and 240 bp suggested the existence of a repetitive unit protected by nucleosome structures with a length of ∼120 bp. This length is equivalent to the length of the novel periodicity although a precise size measurement with single-basepair resolution is impossible, largely limited by the rather poor resolution of agarose gel electrophoresis and the dynamic nature of enzyme digestions. The 100 bp and 140 bp bands are believed to be nucleosome-associated DNA fragments without any and with the two linker sequences, respectively.
Figure 4.

Electrophoretic analysis of T. vaginalis chromosomal DNA fragments protected by nucleosomes based on micrococcal nuclease digestion. Time-controlled enzyme digestions were performed for 1, 3, 5, 7, 9, 11, 13, 15, 17, 19 and 21 min at 37°C. Bands identified at 480, 360 and 240 bp suggested the existence of a nucleosome repeat unit with a length of ∼120 bp. The 140- and 100-bp bands are believed to be nucleosome-associated DNA fragments with and without two linker sequences, respectively.
Another empirical evidence for the nucleosome relevance of this periodicity came from a study on nucleosome fingerprinting of S. cerevisiae. Although its periodic behavior in genomic GC content appeared much weaker (albeit better at GC3) as compared to that of T. vaginalis genome (Figure 5a), a high-resolution map on nucleosome positioning provided us an adequate amount of nucleosome-protected DNA sequences to interrogate how nucleotide composition is constrained by nucleosome organization (29). When aligned the nucleosome-protected sequences to calculate GC content along nucleosome arrays (Figure 5b), we observed that the nucleosome-protected DNA is more GC-rich than the linker DNA, and this local GC content varies with a periodicity corresponding to its nucleosome unit length.
Figure 5.

The 165-nt sequence periodicity in S. cerevisiae. (a) GC content at three codon positions were plotted separately as GC1, GC2 and GC3 along coding DNA sequences. (b) Nucleosome-binding DNA sequences were aligned from one end to calculate GC content along nucleosome array; each red oval represent one nucleosome position. A 10-nt sliding window was used to smooth the curves.
Codon usage and amino acid composition
Codon usage can be biased among genes and genomes toward GC or purine contents (23,30–34). A codon-based analysis named effective number of codons (Ne) was chosen to quantify codon usage bias along CDS (35–37). We calculated Ne at each codon position for all genes aligned from the translation initiation site (TIS; Figure 6a). Ne usually ranges from 20 (when only one codon is used for each amino acid) to 61 (when there is no bias at all). We observed that Ne fluctuates with the 120.9-nt (40.3 codons) periodicity, suggesting that codon usage is significantly constrained by this periodicity (Figure 6a). In the case of leucine, four of its six codons show an obvious periodicity except the CTY codons—CTT and CTG—which just appeared noisier (Figure 6b). Another feature is that the periodicities of different codons appeared to fall into two phases, either in-phase or in-reverse-phase with each other. We thus went on to scrutinize all codons of 20 amino acids and found several rules. First, G- and C-ending codons are generally in the same phase (valley), whereas A- and T-ending codons are in another (peak). Second, although there are 12 exceptions to the first rule, all amino acids with 2-fold degenerate codons follow the first rule firmly. The two degenerate codons for each amino acid are either purine- or pyrimidine-ending, remaining in the opposite phases (peak versus valley). Third, all amino acids with three or more codons have at least one exception to the first rule. The amino acids with three and four codons have only one exception for each and those with six codons have one to three exceptions depending on their usages. For instance, the most abundant amino acid is leucine in all genomes so it has three exceptions, as compared to serine and arginine, which have two and one exceptions, respectively. Fourth, all exceptional codons are either A- or T-ending except one codon for the most abundant amino acid—leucine, which is a G-ending codon. It becomes obvious that these rules are all pointing to a biased codon usage pressured by mutations in favorite of GC-decrease or AT increase from 5′ to 3′ along the transcripts. Further more, the periodicity and the phase for amino acids are governed by a collective effect of all their codons.
Figure 6.

Codon usage analyses over aligned coding sequences. (a) Effective number of codons was plotted as a function of codon positions along the direction of translation. (b) The 120.9-nt periodicity in the six leucine codons. Value at each position was averaged among the most reliable gene set of T. vaginalis and a sliding window of 10 codons was used to smooth the curves. Note that periodicities are more obvious when certain codons were plotted individually albeit poor appearance at amino acid level.
DISCUSSION
Intensive computational analyses allowed us to identify a novel 120.9-nt periodicity in T. vaginalis genome and generalize its existence in several other organisms, where the periodicity length varies in accordance with the unit length of their nucleosome DNA. This length association, along with the validation from other newly available data type—S. cerevisiae nucleosome-binding DNA sequences, reveals that this novel periodicity exhibits different nucleotide compositional dynamics between linker-DNA and wrapping-DNA of nucleosomes. The preference of this periodicity toward CDS, and its start at the junction between 5′-UTR and CDS, along with its extension along the direction of transcription, suggest that nucleosomes are well-positioned near 5′-end along CDS. This is in agreement with several recent reports demonstrating that the coding region downstream of the start codon (or transcription start site) is well-organized into nucleosome arrays, and there is usually a nucleosome-free region upstream of the start codon (29,38–41).
The nucleosome-associated nature of the periodicity suggested that its characteristics should be universal to all eukaryotic genomes. However, there are several reasons why we only succeeded in discovering the 120.9-nt periodicity in T. vaginalis and a few other genomes, but are unable to identify the comparable periodicity in the majority of other species. First, the strength of the transcript-centric periodicity is associated with reliable identification of genes in the genome and correct alignment of their transcripts. The great amount (more than 60 000 genes and 10 000 of them were EST-verified) of annotated genes in T. vaginalis genome provided adequate materials for the detection as we have not seen enough data among other genomes, especially other unicellular organisms (Tables 1 and 2). Second, since the periodicity is transcript-centric, the length of 5′-UTR and introns are also interruptive. In T. vaginalis genome, there are only 65 introns identified so that the signal of the periodicity is rather maximal; it was also supported by the observation of a better signature after removal of intron-containing genes in Entamoeba histolytica (Supplementary Figure S4). This point is also footnoted by our failed attempts to discover significant periodicities in higher eukaryotes. Third, the better presentation of this periodicity among unicellular eukaryotes is believed to be largely due to the relatively regularity of nucleosome organization. For higher eukaryotes, the standard nucleosomes are composed of two copies of the four core histones H2A, H2B, H3 and H4 and the linker histone H1(12). H1 is critical in determining the high-order folding state of chromatins (42). There is a robust linear relationship between H1 stoichiometry and nucleosome repeat length, investigations in mammalian cerebral cortex demonstrated that neuronal and ganglial chromatins have nucleosome repeat length of 162 and 201 bp, and H1 stoichiometry of 0.45 and 1.04 molecule per nucleosome, respectively. This variation in nucleosome unit length might interrupt the formation of the periodicity. As the four core histones and nucleosome structure are highly conserved, histone H1 is rather variable and appears absent in some taxa (43). We identified five groups of histone genes in T. vaginalis through homolog search; the four core histones among eukaryotes were easily defined but the linker histone H1 was not easily defined. Similar results have been reported for G. lamblia (44,45) that also showed a well-defined sequence periodicity in this study.
Table 1.
Comparison between genomes of species investigated in this work
| Species | Kingdom | Genome size | GC (%) | CDS number | CDS with intron (%) |
|---|---|---|---|---|---|
| Arabidopsis thaliana | Plant | 119.19 | 36 | 30 480 | 80.02 |
| Homo sapiens | Protist | 3230.8 | 41 | 26 336 | 85.20 |
| Caenorhabditis elegans | Protist | 100.2 | 35 | 22 844 | 97.45 |
| Saccharomyces cerevisiae | Fungus | 12.16 | 38 | 5877 | 5.36 |
| Yarrowia lipolytica | Fungus | 20.5 | 49 | 6520 | 10.28 |
| Aspergillus nidulans | Fungus | 31 | 50 | 9396 | N/A |
| Entamoeba histolytica | Protist | 22.86 | 25 | 9772 | 24.99 |
| Giardia lamblia | Protist | 9.72 | 48 | 6569 | 0.02 |
| Trichomonas vaginalis | Protist | 177.89 | 33 | 99 319 | 0.07 |
| Haloarcula marismortui | Archaeon | 4.27 | 61 | 4240 | 0.00 |
| Methanosarcina acetivorans | Archaeon | 5.75 | 43 | 4540 | 0.00 |
| Escherichia coli | Bacterium | 4.64 | 51 | 4243 | 0.02 |
| Rhodopseudomonas palustris HaA2 | Bacterium | 5.33 | 66 | 4683 | 0.00 |
| Burkholderia sp. 383 | Bacterium | 8.68 | 66 | 7717 | 0.00 |
| Acidobacteria bacterium Ellin345 | Bacterium | 5.65 | 58 | 4777 | 0.00 |
N/A, data not available.
Table 2.
The 120.9-nt periodicity in codons and amino acids of T. vaginalis
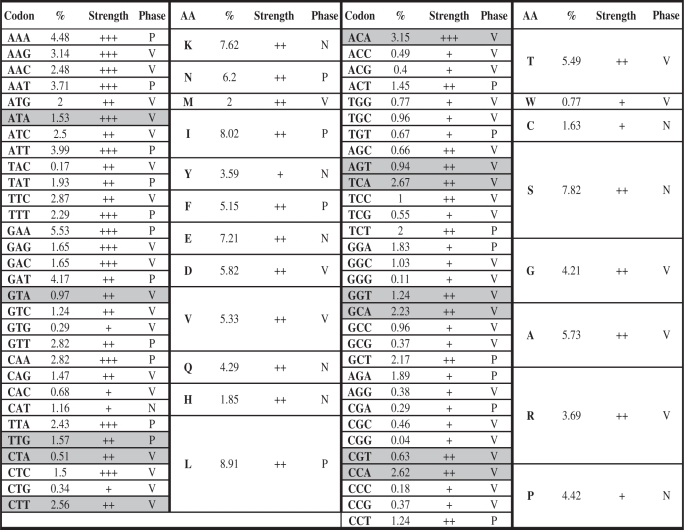 |
The phases of periodicity are assigned based on the alignment of sequences from the translation start and define as peak (P), valley (V) and undistinguishable (N) based on the center position of the periodicity. In most of the cases, when a codon is ended with A or T, they are in the peak phase, and when the codon is ended with G or C, they are in the valley phase. Exceptions do exist for amino acids with three or more codons (shaded).
Although we do not yet have direct evidence to illuminate how nucleosome organization gives rise to this periodicity, we can speculate a possible molecular mechanism. Histones and DNA helix are packaged into compact forms to prevent DNA from damages as opposed to the linker region between nucleosome folds, which is relatively exposed and thus vulnerable to mutagens. The susceptible linker DNA is damaged more frequently, repaired more often, and therefore leaves its nucleotide composition more variable. Since nucleosomes are not randomly positioned along DNA sequences and their regularity appears to coincide with transcriptional units, the different damage-repair frequency between linker-DNA and wrapping-DNA finally causes oscillation of nucleotide composition along nucleosome array over time. Nevertheless, this explanation requires further investigations but provides a plausible clue for formulating hypotheses and designing experiments.
SUPPLEMENTARY DATA
Supplementary data are available at NAR Online.
FUNDING
National Basic Research Program (973 Program) from the Ministry of Science and Technology of the People's Republic of China (2006CB910404 to J.Y.). Funding for open access charge: National Basic Research Program (2006CB910404).
Conflict of interest statement. None declared.
Supplementary Material
ACKNOWLEDGEMENTS
We would like to acknowledge Dr Weidong Bao for many constructive suggestions and our colleagues Jizeng Zhang, Shu Tao, Lei Wang and Jiucheng Liu for helpful discussions.
REFERENCES
- 1.Tuteja N, Singh MB, Misra MK, Bhalla PL, Tuteja R. Molecular mechanisms of DNA damage and repair: progress in plants. Crit. Rev. Biochem. Mol. Biol. 2001;36:337–397. doi: 10.1080/20014091074219. [DOI] [PubMed] [Google Scholar]
- 2.Hu J, Zhao X, Yu J. Replication-associated purine asymmetry may contribute to strand-biased gene distribution. Genomics. 2007;90:186–194. doi: 10.1016/j.ygeno.2007.04.002. [DOI] [PubMed] [Google Scholar]
- 3.Zhao X, Zhang Z, Yan J, Yu J. GC content variability of eubacteria is governed by the pol III alpha subunit. Biochem. Biophys. Res. Com. 2007;356:20–25. doi: 10.1016/j.bbrc.2007.02.109. [DOI] [PubMed] [Google Scholar]
- 4.Worning P, Jensen LJ, Nelson KE, Brunak S, Ussery DW. Structural analysis of DNA sequence: evidence for lateral gene transfer in Thermotoga maritima. Nucleic Acids Res. 2000;28:706–709. doi: 10.1093/nar/28.3.706. [DOI] [PMC free article] [PubMed] [Google Scholar]
- 5.Rhodes D, Klug A. Sequence-dependent helical periodicity of DNA. Nature. 1981;292:378–380. doi: 10.1038/292378a0. [DOI] [PubMed] [Google Scholar]
- 6.Segal E, Fondufe-Mittendorf Y, Chen L, Thastrom A, Field Y, Moore IK, Wang JP, Widom J. A genomic code for nucleosome positioning. Nature. 2006;442:772–778. doi: 10.1038/nature04979. [DOI] [PMC free article] [PubMed] [Google Scholar]
- 7.Watson JD, Crick FH. Molecular structure of nucleic acids; a structure for deoxyribose nucleic acid. Nature. 1953;171:737–738. doi: 10.1038/171737a0. [DOI] [PubMed] [Google Scholar]
- 8.Watson JD, Crick FH. Genetical implications of the structure of deoxyribonucleic acid. Nature. 1953;171:964–967. doi: 10.1038/171964b0. [DOI] [PubMed] [Google Scholar]
- 9.Noll M, Kornberg RD. Action of micrococcal nuclease on chromatin and the location of histone H1. J. Mol. Biol. 1977;109:393–404. doi: 10.1016/s0022-2836(77)80019-3. [DOI] [PubMed] [Google Scholar]
- 10.Rill RL, Oosterhof DK, Hozier JC, Nelson DA. Heterogeneity of chromatin fragments produced by micrococcal nuclease action. Nucleic Acids Res. 1975;2:1525–1538. doi: 10.1093/nar/2.9.1525. [DOI] [PMC free article] [PubMed] [Google Scholar]
- 11.Shaw BR, Herman TM, Kovacic RT, Beaudreau GS, Van Holde KE. Analysis of subunit organization in chicken erythrocyte chromatin. Proc. Natl Acad. Sci. USA. 1976;73:505–509. doi: 10.1073/pnas.73.2.505. [DOI] [PMC free article] [PubMed] [Google Scholar]
- 12.McGhee JD, Felsenfeld G, Eisenberg H. Nucleosome structure and conformational changes. Biophys. J. 1980;32:261–270. doi: 10.1016/S0006-3495(80)84955-1. [DOI] [PMC free article] [PubMed] [Google Scholar]
- 13.Schalch T, Duda S, Sargent DF, Richmond TJ. X-ray structure of a tetranucleosome and its implications for the chromatin fibre. Nature. 2005;436:138–141. doi: 10.1038/nature03686. [DOI] [PubMed] [Google Scholar]
- 14.Herzel H, Weiss O, Trifonov EN. Sequence periodicity in complete genomes of archaea suggests positive supercoiling. J. Biomol. Struct. Dyn. 1998;16:341–345. doi: 10.1080/07391102.1998.10508251. [DOI] [PubMed] [Google Scholar]
- 15.Shepherd JC. Method to determine the reading frame of a protein from the purine/pyrimidine genome sequence and its possible evolutionary justification. Proc. Natl Acad. Sci. USA. 1981;78:1596–1600. doi: 10.1073/pnas.78.3.1596. [DOI] [PMC free article] [PubMed] [Google Scholar]
- 16.Tsonis AA, Elsner JB, Tsonis PA. Periodicity in DNA coding sequences: implications in gene evolution. J. Theor. Biol. 1991;151:323–331. doi: 10.1016/s0022-5193(05)80381-9. [DOI] [PubMed] [Google Scholar]
- 17.Gutierrez G, Oliver JL, Marin A. On the origin of the periodicity of three in protein coding DNA sequences. J. Theor. Biol. 1994;167:413–414. doi: 10.1006/jtbi.1994.1080. [DOI] [PubMed] [Google Scholar]
- 18.Petrin D, Delgaty K, Bhatt R, Garber G. Clinical and microbiological aspects of Trichomonas vaginalis. Clin. Microbiol. Rev. 1998;11:300–317. doi: 10.1128/cmr.11.2.300. [DOI] [PMC free article] [PubMed] [Google Scholar]
- 19.Schwebke JR, Burgess D. Trichomoniasis. Clin. Microbiol. Rev. 2004;17:794–803. doi: 10.1128/CMR.17.4.794-803.2004. [DOI] [PMC free article] [PubMed] [Google Scholar]
- 20.Vanacova S, Liston DR, Tachezy J, Johnson PJ. Molecular biology of the amitochondriate parasites, Giardia intestinalis, Entamoeba histolytica and Trichomonas vaginalis. Int. J. Parasitol. 2003;33:235–255. doi: 10.1016/s0020-7519(02)00267-9. [DOI] [PubMed] [Google Scholar]
- 21.Carlton JM, Hirt RP, Silva JC, Delcher AL, Schatz M, Zhao Q, Wortman JR, Bidwell SL, Alsmark UC, Besteiro S, et al. Draft genome sequence of the sexually transmitted pathogen Trichomonas vaginalis. Science. 2007;315:207–212. doi: 10.1126/science.1132894. [DOI] [PMC free article] [PubMed] [Google Scholar]
- 22.Trifonov EN. 3-, 10.5-, 200- and 400-base periodicities in genome sequences. Physica A. 1998;249:511–516. [Google Scholar]
- 23.Yu J. A content-centric organization of the genetic code. Genomics Proteomics Bioinformatics. 2007;5:1–6. doi: 10.1016/S1672-0229(07)60008-4. [DOI] [PMC free article] [PubMed] [Google Scholar]
- 24.Woodcock CL, Skoultchi AI, Fan Y. Role of linker histone in chromatin structure and function: H1 stoichiometry and nucleosome repeat length. Chromosome Res. 2006;14:17–25. doi: 10.1007/s10577-005-1024-3. [DOI] [PubMed] [Google Scholar]
- 25.Bailey KA, Chow CS, Reeve JN. Histone stoichiometry and DNA circularization in archaeal nucleosomes. Nucleic Acids Res. 1999;27:532–536. doi: 10.1093/nar/27.2.532. [DOI] [PMC free article] [PubMed] [Google Scholar]
- 26.Musgrave D, Forterre P, Slesarev A. Negative constrained DNA supercoiling in archaeal nucleosomes. Mol. Microbiol. 2000;35:341–349. doi: 10.1046/j.1365-2958.2000.01689.x. [DOI] [PubMed] [Google Scholar]
- 27.Pereira SL, Grayling RA, Lurz R, Reeve JN. Archaeal nucleosomes. Proc. Natl Acad. Sci. USA. 1997;94:12633–12637. doi: 10.1073/pnas.94.23.12633. [DOI] [PMC free article] [PubMed] [Google Scholar]
- 28.Sandman K, Reeve JN. Structure and functional relationships of archaeal and eukaryal histones and nucleosomes. Arch. Microbiol. 2000;173:165–169. doi: 10.1007/s002039900122. [DOI] [PubMed] [Google Scholar]
- 29.Shivaswamy S, Bhinge A, Zhao Y, Jones S, Hirst M, Iyer VR. Dynamic remodeling of individual nucleosomes across a eukaryotic genome in response to transcriptional perturbation. PLoS Biol. 2008;6:618–630. doi: 10.1371/journal.pbio.0060065. [DOI] [PMC free article] [PubMed] [Google Scholar]
- 30.Wong GK, Wang J, Tao L, Tan J, Zhang J, Passey DA, Yu J. Compositional gradients in Gramineae genes. Genome Res. 2002;12:851–856. doi: 10.1101/gr.189102. [DOI] [PMC free article] [PubMed] [Google Scholar]
- 31.Bulmer M. Coevolution of codon usage and transfer RNA abundance. Nature. 1987;325:728–730. doi: 10.1038/325728a0. [DOI] [PubMed] [Google Scholar]
- 32.Knight RD, Freeland SJ, Landweber LF. A simple model based on mutation and selection explains trends in codon and amino-acid usage and GC composition within and across genomes. Genome Biol. 2001;2:R10. doi: 10.1186/gb-2001-2-4-research0010. [DOI] [PMC free article] [PubMed] [Google Scholar]
- 33.Stenico M, Lloyd AT, Sharp PM. Codon usage in Caenorhabditis elegans: delineation of translational selection and mutational biases. Nucleic Acids Res. 1994;22:2437–2446. doi: 10.1093/nar/22.13.2437. [DOI] [PMC free article] [PubMed] [Google Scholar]
- 34.Xia X. Maximizing transcription efficiency causes codon usage bias. Genetics. 1996;144:1309–1320. doi: 10.1093/genetics/144.3.1309. [DOI] [PMC free article] [PubMed] [Google Scholar]
- 35.Fuglsang A. The ‘effective number of codons’ revisited. Biochem. Biophys. Res. Commun. 2004;317:957–964. doi: 10.1016/j.bbrc.2004.03.138. [DOI] [PubMed] [Google Scholar]
- 36.Fuglsang A. Estimating the “effective number of codons”: the Wright way of determining codon homozygosity leads to superior estimates. Genetics. 2006;172:1301–1307. doi: 10.1534/genetics.105.049643. [DOI] [PMC free article] [PubMed] [Google Scholar]
- 37.Wright F. The ‘effective number of codons’ used in a gene. Gene. 1990;87:23–29. doi: 10.1016/0378-1119(90)90491-9. [DOI] [PubMed] [Google Scholar]
- 38.Bernstein BE, Liu CL, Humphrey EL, Perlstein EO, Schreiber SL. Global nucleosome occupancy in yeast. Genome Biol. 2004;5:R62. doi: 10.1186/gb-2004-5-9-r62. [DOI] [PMC free article] [PubMed] [Google Scholar]
- 39.Yuan GC, Liu YJ, Dion MF, Slack MD, Wu LF, Altschuler SJ, Rando OJ. Genome-scale identification of nucleosome positions in S. cerevisiae. Science. 2005;309:626–630. doi: 10.1126/science.1112178. [DOI] [PubMed] [Google Scholar]
- 40.Liu CL, Kaplan T, Kim M, Buratowski S, Schreiber SL, Friedman N, Rando OJ. Single-nucleosome mapping of histone modifications in S. cerevisiae. PLoS Biol. 2005;3:e328. doi: 10.1371/journal.pbio.0030328. [DOI] [PMC free article] [PubMed] [Google Scholar]
- 41.Lee W, Tillo D, Bray N, Morse RH, Davis RW, Hughes TR, Nislow C. A high-resolution atlas of nucleosome occupancy in yeast. Nat. Genet. 2007;39:1235–1244. doi: 10.1038/ng2117. [DOI] [PubMed] [Google Scholar]
- 42.Hendzel MJ, Lever MA, Crawford E, Th’ng JP. The C-terminal domain is the primary determinant of histone H1 binding to chromatin in vivo. J. Biol. Chem. 2004;279:20028–20034. doi: 10.1074/jbc.M400070200. [DOI] [PubMed] [Google Scholar]
- 43.Kasinsky HE, Lewis JD, Dacks JB, Ausio J. Origin of H1 linker histones. Faseb J. 2001;15:34–42. doi: 10.1096/fj.00-0237rev. [DOI] [PubMed] [Google Scholar]
- 44.Wu G, McArthur AG, Fiser A, Sali A, Sogin ML, Mllerm M. Core histones of the amitochondriate protist, Giardia lamblia. Mol. Biol. Evol. 2000;17:1156–1163. doi: 10.1093/oxfordjournals.molbev.a026398. [DOI] [PubMed] [Google Scholar]
- 45.Yee J, Tang A, Lau WL, Ritter H, Delport D, Page M, Adam RD, Muller M, Wu G. Core histone genes of Giardia intestinalis: genomic organization, promoter structure, and expression. BMC Mol. Biol. 2007;8:26. doi: 10.1186/1471-2199-8-26. [DOI] [PMC free article] [PubMed] [Google Scholar]
Associated Data
This section collects any data citations, data availability statements, or supplementary materials included in this article.