

Abstract
Background & Aims:
Wireless capsule endoscopy provides an opportunity to study the macroscopic features in celiac disease by providing a magnified view of the intestinal mucosa. In this study, we evaluated the following: (1) the distribution of atrophy in untreated celiac disease, (2) the correlation between extent of changes and clinical manifestations, (3) the accuracy and interobserver agreement of wireless capsule endoscopy assessment, and (4) the effect of gluten withdrawal.
Methods:
Thirty-eight consecutive patients with untreated biopsy-proven celiac disease underwent wireless capsule endoscopy. Each subject was invited to undergo repeat testing after at least 6 months of gluten withdrawal. The video images of each patient were reviewed independently by 2 investigators.
Results:
Thirty-five (92%) subjects had visible atrophy detected by capsule endoscopy. Twenty-two (59%) subjects showed an extensive enteropathy, 12 (32%) had enteropathy limited to the duodenum, and only 1 had a jejunal enteropathy. No association was shown between the extent of the lesion and clinical manifestations. Capsule endoscopy had a better overall sensitivity for the detection of atrophy as compared with upper endoscopy (92% vs 55%, P = .0005), with a specificity of 100%. The overall interobserver agreement for the 2 reviewers was relatively high (% total agreement, 86.5%). After gluten withdrawal, the extent and the pattern of atrophy improved both qualitatively and quantitatively.
Conclusions:
Celiac disease affects a highly variable portion of the small intestine starting at the duodenum. The extent of visible enteropathy does not explain differences in clinical presentation. Most subjects with visually detected villous atrophy showed a clinically significant improvement after gluten withdrawal.
Celiac disease (CD) is defined as a permanent intolerance to ingested gluten that damages the small intestine, characteristically inducing crypt hyperplasia and villous atrophy, and resolves with removal of gluten from the diet.1
The grade of injury (severity of villous atrophy) based on the histologic analysis of biopsy specimens taken from the proximal intestine does not necessarily predict the severity of symptoms in CD in both children and adults.2,3 Moreover, it has been suggested that the extent of small-bowel involvement with CD is a likely explanation for the great variability of symptoms and severity of clinical presentation.4,5 However, little is known about the extent of the small bowel that is affected in untreated CD and if indeed the extent of the enteropathy explains the clinical presentation.
CD is associated with changes in the villous structure of the mucosa that may be visible with standard endoscopy.6 These changes include reduced Kerckring's folds, scalloping of the mucosa on circular folds, mucosal fissures, and a mosaic pattern.7-10 However, the sensitivity of standard endoscopy for the detection of villous atrophy is poor (59%), in part because partial villous atrophy may elude visual detection.11 Other invasive endoscopic techniques or technologies have been used to improve the rate of macroscopic detection of intestinal villous atrophy, but they are limited to the study of the proximal small intestine (eg, the water immersion technique, chromoscopic endoscopy with magnification, push enteroscopy, and zoom endoscopy).12-14
Until recently, it was difficult to accurately determine the extent of intestinal involvement of CD in a noninvasive manner. Wireless capsule endoscopy (WCE) is an innovative diagnostic method that allows painless imaging of the entire length of the small bowel.15 WCE is ideally suited for assessing the visual appearance of the small-intestinal mucosa in a near physiologic setting when the villi are readily visible floating in intestinal juice and without the effects of air distension.16,17 WCE is more reliable than previous noninvasive imaging techniques for detecting visible small-intestinal lesions.18,19 The clinical utility of WCE has been explored previously and recommended in patients with CD who had gastrointestinal symptoms despite treatment with a gluten-free diet (GFD).20,21 The sensitivity of WCE for the detection of intestinal villous atrophy in the small bowel of patients with untreated CD varies between 70% and 85%, with a specificity of 100%.22,23
Although we assume that untreated CD affects the proximal small-intestinal mucosa, little is known about the pattern of healing that occurs after adherence to the GFD. Indeed, many patients with CD do not achieve complete mucosal healing of the proximal small intestine, as assessed by biopsy of the distal part of the duodenum, nor does negative celiac serology (eg, endomysial antibodies) necessarily predict histologic recovery despite a good clinical response to a GFD.24-27 WCE provides a magnified view of both the proximal and distal small bowel, and may be useful to assess the effect of a GFD on the whole distribution and extent of atrophy in CD.
The aims of this study were as follows: (1) to evaluate the sensitivity of WCE for histologically determined villous atrophy, (2) to identify the extent and pattern of intestinal involvement in untreated CD, (3) to correlate the extent of visual changes detected by WCE and clinical features, and (4) to examine the effect of GFD on these changes.
Materials and Methods
Experimental Design
The study was a single-center prospective study of patients with newly diagnosed CD. Within 2 weeks of the diagnosis but before the onset of a GFD, patients giving informed consent underwent WCE. The video images of each patient were reviewed independently by 2 investigators (C.J.G. and J.A.M.) for the presence and distribution of mucosal abnormalities associated with CD. Each subject was invited to undergo repeat testing at least 6 months after starting a GFD.
Patients
Inclusion criteria
We included consecutive adult patients (>18 y) with newly diagnosed and biopsy-proven CD in whom a GFD had not yet been started.
Exclusion criteria
Patients with a previous diagnosis or treatment for CD, an inability to swallow the capsule as a result of dysphagia, symptoms and signs of intestinal obstruction, a history of small- or large-bowel strictures, inflammatory bowel disease, a known motility disorder of the gastrointestinal tract, or any previous bowel surgery were excluded.
Wireless Capsule Endoscopy
The study used the Wireless Endoscopy Imaging System (Given M2A videocapsule; Given Imaging Ltd, Yoqneam, Israel). The technical data of the capsule and the technique used to obtain an optimal image of the small intestine have been described in detail elsewhere.15,16 No bowel preparation or pro-kinetic medications were used.
Image Analysis
Two investigators with experience in both WCE (>100 capsule endoscopies reviewed each) and in identifying endoscopic features of CD (C.J.G. and J.A.M.) reviewed the video images. The investigators were blinded to the patients' clinical symptoms and the results of previous endoscopic procedures or histology. The following features were considered a priori indicative of CD: (1) mucosa (scalloping, fissuring, mosaic surface pattern, or nodularity) (2) villi (absence or blunting), and (3) circular folds (effacement or absence) (Figure 1).
Figure 1.
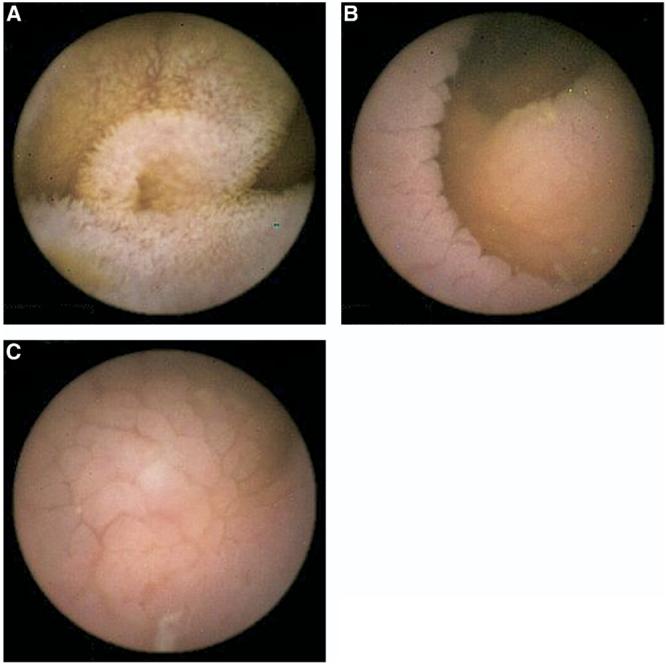
Examples of features of atrophy detected by WCE in CD. (A) Normal villi, (B) scalloping of the mucosa on circular folds, (C) mosaic pattern. Note the absence of villi in the mucosa that shows features of atrophy.
The extent of involvement was assessed using 2 methods: the qualitative method, and the time-based (quantitative) method. The qualitative assessment was based on 2 determinations. First, the features of atrophy were characterized as patchy or continuous. The findings were judged to be continuous if the changes were seen on successive images with-out intervening normal mucosal appearance, and patchy if areas of normal mucosa were seen between diseased mucosa. Second, the localization of these observations was classified as follows: proximal (isolated duodenal enteropathy), distal (jejunal enteropathy), and extensive enteropathy (affecting both locations). The time-based measurement of extent was obtained by recording the time without villi and the time with any abnormality (feature of atrophy). Time was expressed in hours and fraction of hours, and also as the percentage of total small-bowel transit time (time from last duodenal entry to cecal entry).
The capsule transition from duodenum to jejunum was determined by the passage of the capsule across the midline to the left side in a downward direction as judged using the signal strength software.
Although the initial intent of the study was to address the extent of involvement of disease in CD, a retrospective comparison between cases and a negative control group was undertaken to address the specificity of the WCE findings. The control group consisted of 38 age- and sex-matched subjects with negative celiac serology (either tissue transglutaminase and/or endomysial antibodies) in whom normal duodenal biopsy specimens had been obtained. These control group individuals underwent WCE for a variety of indications contemporaneously with the CD cases. The WCE studies of these controls were re-evaluated and mixed in random order with the WCE videos of the cases and re-interpreted blindly for the presence and extent of features suggestive of atrophy if present.
Clinical and Laboratory Data
The presence or absence of diarrhea, abdominal pain, and unintentional weight loss were recorded prospectively. A complete blood cell count and celiac serology (endomysial and/or tissue transglutaminase antibodies) were measured at the initial evaluation.
Endoscopy and Histologic Analysis
The initial diagnostic upper endoscopy was performed by endoscopists other than the investigators. Any mucosal abnormalities seen in the duodenum during endoscopy were recorded in the clinical record. At least 4 biopsy specimens taken from the distal duodenum were stained with H&E and examined by gastrointestinal pathologists for the presence or absence and grade of intestinal atrophy, crypt hyperplasia, as well as count of intraepithelial lymphocytes per 100 epithelial cells. Only subjects with villous atrophy according to Marsh stage III were included in the study.28
Statistics
Data were summarized and presented using descriptive statistics. Clinical and laboratory parameters measured on a continuous scale were summarized and expressed by their mean and SD. For categoric data, such as the presence and pattern of mucosal abnormalities, the frequency and percentage of subjects in each category was presented. When warranted, a 95% confidence interval (CI) around the observed proportion based on the binomial distribution was reported. Individual subject data, such as the location of mucosal abnormalities, was recorded and presented in subject data listings.
The association between categoric indications and extent of enteropathy (extensive vs limited) was assessed using a chi-squared test or the Fisher exact test. A Wilcoxon rank-sum test was used to test associations of continuous scale characteristics with extent of enteropathy. Overall sensitivity for WCE examination was calculated assuming histology as the gold standard and compared with the sensitivity of the initial esophagogastroduodenoscopy using the McNemar exact test. The interobserver agreement for abnormality indications was estimated by the percentage of total agreement and Cohen's κ statistic along with corresponding 95% CIs. For quantitative parameters, the interobserver agreement was measured using Lin's concordance correlation coefficient with 95% CI.29 Changes in WCE findings between baseline and 6-month follow-up testing were assessed for clinical importance using descriptive statistics. The presence of features of atrophy was compared between duodenal and jejunal regions using the McNemar test. A significance level of α = .05 was considered for all analyses.
Results
Characteristics of Patients With Celiac Disease and Negative Control Group
Forty patients initially were enrolled into the study during the period from March 2003 to August 2004 at Mayo Clinic Rochester. Three patients ultimately were excluded because of the following: (1) incorrect initial diagnosis in 2 patients (both had negative celiac serology and absence of the HLA-DQ2 or -DQ8 haplotypes), and (2) the capsule did not exit the stomach in 1 patient (this patient was included as if she had normal WCE findings in the sensitivity analysis to avoid overestimation of the WCE diagnostic accuracy). Because of the need for patients to stay overnight or return for the capsule study, most patients who were recruited came from within 100 miles and mirrored the locally reported sex and age distribution of CD clinically.30 The mean age (±SD) was 47 (±11) years, with twice as many females as males (25 vs 12). Indications for clinical evaluation were malabsorption syndrome and iron-deficiency anemia in 21 patients (58%), screening at-risk individuals in 8 patients (21.6%: 5 with a family member affected by CD, 2 with severe osteoporosis, and 1 with unexplained abnormal liver function tests), involuntary weight loss in 4 patients (10.8%), and unexplained abdominal pain in 4 patients (10.8%). Twenty-nine patients (78.3%) had a positive tissue transglutaminase and 25 patients (68%) had a positive endomysial antibody (EmA). All the patients had a positive result in at least one of these antibodies. Thirty-seven patients (100%) had intestinal villous atrophy (Marsh stage III lesion) and increased intraepithelial lymphocytes (mean, 74 ± 20 lymphocytes/100 epithelial cells). Thirty-eight age- and sex-matched individuals with negative celiac serology and normal duodenal histology were used as a negative control group. There were 25 (65.8%) females, with a mean age of 46.6 years (range, 23–73 y). Obscure-occult gastrointestinal bleeding (iron-deficiency anemia) was the principal indication (n = 18) for capsule endoscopy evaluation in the control group. The demographics and overall results of the patients and controls are summarized in Table 1.
Table 1.
Summary of Demographics, Symptoms, Serology, Histology, and Endoscopic Findings
| Patients with CD | Control group | |
|---|---|---|
| Demographics | ||
| Number of cases | 37 | 38 |
| Female | 25 (68%) | 25 (65.8%) |
| Age | 46.4 ± 10.7 (24–70) | 46.6 ± 13.2 (23–72) |
| Indication for work-up | ||
| Anemia | 11 | 18 |
| Malabsorption | 10 | 4 |
| Screening at-risk individualsa | 8 | 0 |
| Unexplained abdominal pain | 4 | 6 |
| Unexplained loss of weight | 4 | 2 |
| Obscure-overt gastrointestinal bleeding | 0 | 8 |
| Celiac serology | ||
| Positive serology (either EmA or tTGA) | 37 | 0 |
| Duodenal histology | ||
| Normal | 0 | 38 |
| Marsh IIIa | 19 | 0 |
| Marsh IIIb | 0 | 0 |
| Marsh IIIc | 18 | 0 |
| Increased intraepithelial lymphocytes | 37 | 0 |
| Number of intraepithelial lymphocytes | 74 ± 20 | N/A |
| Endoscopic findings | ||
| Upper endoscopy markers of atrophy | 21 | 0 |
| Any feature of atrophy by capsule endoscopy | 35 | 0 |
EmA, Antiendomysial antibody; tTGA, tissue transglutaminase antibodies; N/A, not available.
Five with family history of CD, 2 osteoporosis, 1 abnormal liver function test.
Association Between Upper Endoscopy, Wireless Capsule Endoscopy, and Histologic Findings
All 38 patients swallowed the capsule successfully, including the 1 patient whose capsule did not exit the stomach. Among them, 35 patients (92%; 95% CI, 79%–98%) showed at least one mucosal feature of atrophy detected by WCE, consisting of fissuring, scalloping, or mosaic pattern (see later). In 3 patients, the WCE was normal. Two of these 3 subjects had a normal upper endoscopy and all 3 had total villous atrophy (Marsh stage III-c lesion) on the mucosal biopsy specimen of the distal part of the duodenum.
By contrast, endoscopically detected mucosal abnormalities suggestive of CD were detected in only 21 patients (55%; 95% CI, 38%–71%) at the time of the upper-endoscopy evaluation. The WCE sensitivity was significantly higher than the sensitivity based on the diagnostic upper endoscopy (P = .0005). None of the negative control individuals had any evidence of villous atrophy identified by WCE on the blinded, randomized re-review, whereas 35 of 37 cases with CD did have evidence of villous atrophy found. Extent of atrophy in the re-review in the cases was similar to that of the initial review. Because no villous atrophy was found in the control group, extension of atrophy was irrelevant. The upper endoscopy macroscopic evaluation of the mucosa of the duodenum was normal in all the negative control group individuals. The specificity of both tests was 100% (95% CI, 86%–100%).
Extent and Type of Bowel Involvement
Qualitative extent assessment
In the majority of patients, the abnormal findings started in the proximal duodenum and extended a variable length into the jejunum. Abnormal findings were seen in a continuous pattern in the duodenum. In the jejunum, features of atrophy were less obvious and frequently overlapped with normal mucosa.
Twenty-two patients (59%) showed continuous involvement of the duodenum and at least patchy jejunal lesions (extensive enteropathy, type A lesion), 12 patients (32%) showed continuous involvement in the duodenum (limited duodenal enteropathy, type B lesion), and 1 patient had patchy involvement in the jejunum (jejunal enteropathy, type C lesion) (Figure 2).
Figure 2.

Distribution of features of villous atrophy detected by WCE in untreated CD.
Features of atrophy were seen more often in the duodenum (92%) than in the jejunum (62%) (P = .0034). In the duodenum, fissuring was evident in 33 patients (89%), scalloping was evident in 30 patients (81%), and the mosaic pattern was evident in 24 patients (65%). In the jejunum, fissuring was present in 22 patients (59%), scalloping was present in 20 patients (54%), and the mosaic pattern was present in 18 patients (48%) (P = .0034, .0020, .0703, respectively).
Twenty-four patients (65%) with duodenal lesions had all 3 features of atrophy (fissuring, scalloping, and mosaic pattern), 5 patients (14%) had a combination of 2 features, and 5 patients (14%) had only 1 type of feature. In the jejunum, 17 patients (46%) showed all 3 features of atrophy, 3 patients (8%) had 2 features, and 3 patients (8%) had only 1 type of feature.
Quantitative extent assessment
The mean combined time with abnormality of any mucosal features of villous atrophy was 0.86 hours (median [interquartile range (IQR)], 0.27 [0.03– 0.99] h and 0.34 [0.04 –1.12] h for investigators 1 and 2, respectively). When the time with abnormality was considered as a percentage of the total small-bowel transit time (the period of time between the last duodenal entry to the first cecal view of the capsule), the mean was 15.9% (median [IQR], 5.8% [0.8%–20.7%]) for investigator 1 and 17.0% (median [IQR], 7.3% [0.9%–23.5%]) for investigator 2.
When only the absence of intestinal villi was considered as a mucosal feature of atrophy, the average time without villi was 0.82 hours (median [IQR], 0.38 [0.06 –1.03]). The average percentage of time of the total small-bowel transit time without villi was 16.4% (median [IQR], 8.8% [1.7%–22.7%]).
Extent of Lesion and Clinical Manifestations
No significant associations of extent of enteropathy and clinical manifestations were detected. Patients with extensive enteropathy (type A lesion) were of similar age, clinical presentation, level of hemoglobin, and number of intraepithelial lymphocytes per 100 epithelial cells as celiac patients with isolated duodenal enteropathy (type B lesion) (Table 2).
Table 2.
Clinical Parameters and Extent of Involvement Detected by WCE
| Variable | Extensive enteropathy (n = 22) |
Limited duodenal enteropathy (n = 12) |
P value |
|---|---|---|---|
| Age, y | 47.4 ± 11.0 | 47.4 ± 10.9 | .90 |
| Body mass index, kg/m2 | 24.2 ± 5.1 | 24.4 ± 4.1 | .81 |
| Diarrhea | 8 (36%) | 4 (33%) | .86 |
| Weight loss | 6 (27%) | 2 (17%) | .68 |
| Abdominal pain | 5 (23%) | 3 (25%) | .88 |
| Hemoglobin level, g/dL | 12.6 ± 1.5 | 12.3 ± 1.7 | .73 |
| IELs | 74 ± 20 | 71 ± 20 | .70 |
IELs, intraepithelial lymphocytes.
Further, there was an absence of significant associations between clinical parameters and the quantitative measures of extent of intestinal involvement. In general, characteristics at clinical presentation were not associated with time without villi or time with abnormality, although a positive EmA result did correspond with a longer time with abnormality (P = .0259). In addition, positive EmA had a borderline significant association with longer time without villi (P = .0686), as did positive anti–tissue transglutaminase with both time parameters (P = .0742 and .0823 for times without villi and with abnormality, respectively) (Table 3).
Table 3.
Associations Between Clinical Parameters and WCE Quantitative Parameters for Extent of Intestinal Involvement
| Time without villi |
Time with abnormality |
|||
|---|---|---|---|---|
| Parameter | Spearman correlation coefficient | P value | Spearman correlation coefficient | P value |
| Age | ||||
| (n = 37) | 0.1271 | .4536 | 0.1409 | .4056 |
| Body mass index | ||||
| (n = 37) | −0.0967 | .5690 | −0.2359 | .1599 |
| Hemoglobin level | ||||
| (n = 33) | −0.1438 | .4247 | −0.2471 | .1657 |
| Median (IQR) | Median (IQR) | |||
| Sex | ||||
| F(n = 25) | 0.56 (0.05–1.11) | .7827a | 0.45 (0.02–1.15) | .5701a |
| M(n = 12) | 0.16 (0.09–0.72) | 0.19 (0.03–0.84) | ||
| Total VA | ||||
| Y(n = 17) | 0.15 (0.07–0.62) | .2285a | 0.17 (0.02–0.79) | .1538a |
| N(n = 19) | 0.97 (0.04–1.24) | 0.54 (0.04–1.27) | ||
| Diarrhea | ||||
| Y(n = 14) | 0.61 (0.12–1.51) | .2047a | 0.49 (0.03–1.70) | .4522a |
| N(n = 23) | 0.14 (0.06–0.97) | 0.30 (0.02–0.90) | ||
| Weight loss | ||||
| Y(n = 9) | 0.12 (0.01–1.75) | .3482a | 0.32 (0.01–1.92) | .9154a |
| N(n = 28) | 0.47 (0.08–1.02) | 0.44 (0.03–1.01) | ||
| Severe CDb | ||||
| Y(n = 6) | 0.34 (0.02–3.32) | .9836a | 0.38 (0.03–3.50) | .6503a |
| N(n = 31) | 0.38 (0.06–1.03) | 0.34 (0.02–1.02) | ||
| EMA | ||||
| + (n = 25) | 0.84 (0.13–1.21) | .0742a | 0.54 (0.07–1.36) | .0259a |
| − (n = 8) | 0.08 (0.06–0.32) | 0.05 (0.00–0.54) | ||
| tTGA | ||||
| + (n = 29) | 0.65 (0.10–1.21) | .0823a | 0.45 (0.09–1.21) | .0686a |
| − (n = 4) | 0.10 (0.02–0.32) | 0.02 (0.00–0.52) | ||
EmA, Endomysial antibody; tTGA, tissue transglutaminase antibodies; VA, villous atrophy.
P value from rank-sum test.
Severe CD was defined by the presence of diarrhea and weight loss.
Interobserver Agreement
The overall agreement between the 2 reviewers for the detection of features suggesting atrophy was 86.5%, but corresponded to a κ statistic of only κ = 0.37; (95% CI, 0.00 – 0.81). This paradox was caused by an imbalance in the marginal with and without features of atrophy because 30 of 37 subjects were identified as having features of atrophy by both reviewers.31 The overall percentage agreement was 84% for the detection of fissuring (κ = 0.41, 95% CI, 0.02– 0.79), 84% for scalloping (κ = 0.59; 95% CI, 0.30 – 0.88); and 89% for mosaic pattern (κ = 0.77; 95% CI, 0.56 – 0.98) (Table 4).
Table 4.
Interobserver Agreement on the Presence of Features of Atrophy in the Small Bowel of Patients With CD Evaluated by WCE
| Criteria | % Agreement | κ coefficient (95% CI) |
|---|---|---|
| Fissure | 83.8 | 0.41 (0.02–0.79) |
| Mosaic | 89.2 | 0.77 (0.56–0.98) |
| Scalloping | 83.8 | 0.59 (0.30–0.88) |
| Any | 86.5 | 0.37 (0–0.81) |
There was a high degree of interobserver agreement for the quantitative measures of extent of involvement of the small intestine by atrophy. Lin's (unbiased) concordance correlation coefficient29 of 0.96, 0.93, 0.92, and 0.90 for time and percentage of time with abnormality, and time and percentage of time without villi, respectively.
Response to Gluten-Free Diet
Thirty (78%) of 37 patients underwent repeat testing at least 6 months after starting the GFD: 9 patients (30%) at 6 months, 12 patients (40%) between 7 and 12 months, and 9 patients (30%) between 13 and 18 months. Six patients were not available to return for the capsule because of inconvenience, and 1 patient could not swallow the capsule the second time.
Qualitative Analysis After Gluten-Free Diet
Features of atrophy and extent of the lesion
The qualitative assessment revealed a significant decrease in the frequency of features of villous atrophy, both in the duodenum and jejunum, after at least 6 months of treatment with a GFD (Table 5). Among those with a baseline presence of at least one abnormality (feature of atrophy) who were retested after a GFD (n = 29), the extent of the intestinal lesions improved in 23 patients (79%), including 9 patients (31%) with completely normal mucosa, and remained unchanged in 6 patients (21%). Patients with extensive enteropathy (type A lesion, n = 20) showed either complete healing (n = 13) or partial improvement (n = 6) of the jejunal lesions, and complete or partial improvement of the duodenal changes in 15 cases. Only 1 case remained completely unchanged and another 4 showed no improvement in the duodenal region. The intestinal mucosa became entirely normal in 5 cases. Patients with limited duodenal enteropathy who were retested (type B lesion, n = 8) showed reversal to normal mucosa in 3 cases but some residual involvement in 5 subjects. The patient with jejunal enteropathy (type C lesion) showed complete healing of the mucosa after GFD.
Table 5.
Effect of GFD in Frequency of Features of Atrophy Detected by WCE
| Type of lesion | Untreated CD (n = 30) |
After gluten withdrawal (n = 30) |
|---|---|---|
| Duodenal | ||
| Fissures | 27 | 16 |
| Scalloping | 27 | 14 |
| Mosaic pattern | 21 | 4 |
| Any lesion | 28 | 17 |
| Jejunum | ||
| Fissure | 20 | 7 |
| Scalloping | 18 | 6 |
| Mosaic pattern | 16 | 2 |
| Any lesion | 21 | 8 |
One patient with extensive enteropathy who remained unchanged at the follow-up capsule endoscopy admitted at the dietician interview that she had not followed a GFD at all during the intervening period despite being symptomatic with gluten ingestion. All the patients denied intentional gluten ingestion; neither was an obscure source of gluten contamination identified by the dietician interview.
The duration of the GFD before the follow-up WCE was not associated with the change in the degree of improvement in features of atrophy (6 mo vs >6 mo; duodenum, P = .53; jejunum, P = 1.0; or <1 y vs >1 y; duodenum, P = .58; jejunum, P = 1.0).
Quantitative Analysis After Gluten-Free Diet
Among the 30 subjects who participated in the repeat testing, the average time with abnormality decreased from about 60 minutes pre-GFD to about 12 minutes after gluten withdrawal, whereas the percentage of time with abnormality decreased from 19% of the total small-bowel transit time before GFD to 4% after gluten exclusion. Similarly, the mean time without villi (and percentage of time without villi) decreased after at least 6 months on a GFD to 15 minutes (5%) compared with 56 minutes (18%) before GFD onset (Table 6).
Table 6.
WCE Quantitative Parameters for Assessment of Extent of Intestinal Involvement in CD Before and After Gluten Withdrawal
| Averaged from 2 investigators |
|||
|---|---|---|---|
| Parameter | n | Untreated CD | Treated CDa |
| Time with abnormality, h | 30 | 1.00 ± 1.44 | 0.20 ± 0.45 |
| Time without villi, h | 29 | 0.94 ± 1.39 | 0.26 ± 0.88 |
| % Time with abnormality | 30 | 19.0 ± 24.3 | 4.2 ± 9.4 |
| % Time without villi | 29 | 17.9 ± 22.5 | 5.2 ± 18.5 |
After at least 6 months of GFD.
Discussion
This study showed that CD affects the proximal small intestine and extends distally for a variable distance in a more or less continuous fashion and also heals in the reverse direction after gluten withdrawal. The study confirmed that most patients have a continuous pattern of atrophy, almost always observable in the duodenum. Just 1 patient did not have observable atrophy changes on the duodenal images with atrophy being seen only in the jejunum. Although these data support the concept that CD affects predominantly the proximal small intestine,32 it also showed that CD can be quite variable in its distribution and in the extent of involvement in the intestine.
It has long been known that the mode of presentation and/or the severity of CD are not predicted by the severity of mucosal damage that is found on biopsy specimens of the proximal small intestine.1,3 Rather, it has been suggested that it is the variation of the extent of involvement of the intestine that may predict the clinical severity of malabsorption.4,33 This study suggested that this is not the case, the extent of visual changes did not correlate with the clinical severity of CD, body mass index, age, or sex. The only previous study that examined the extent of intestinal involvement (in vivo) and its influence on the symptoms of CD was performed using a multiple biopsy device and fluoroscopy in the early 1960s. This study was limited because it included only a small number of patients and because it included only patients with frank malabsorption.5 Necropsies on patients with predominantly complicated CD in the early 1970s confirmed that the mucosal lesion in adult CD involved the duodenum and jejunum and only occasionally extended into the ileum and that the flat lesion persists to a lesser extent in a proportion of cases after GFD.34 Our larger set of patients encompassed a broad range of clinical presentations that more completely represent the current spectrum of CD.
Other factors may be more important for the understanding of what predicts severity of CD. One explanation could be the gene dose effect of the HLA-DQ2 alleles. Indeed, the homozygosity for the DQB1*0201 allele was associated with a more severe form of CD assessed by more severe villous atrophy, slower recovery of villous atrophy after a GFD, younger age, more severe diarrhea, and a lower level of blood hemoglobin at the time of diagnosis.35 An additional factor may be the gastrointestinal motility disturbances associated with untreated CD, which can play a role in the genesis of gastrointestinal symptoms and disappear after gluten withdrawal.36
Studies in children have shown that improvement and, indeed, return to normality may occur relatively quickly within weeks to months of the institution of a GFD.37 However, a high proportion of adults may not heal their intestinal abnormalities even after a year or more of a GFD.25-27,38,39 Our results in an adult population suggest that mucosal improvement is readily apparent after gluten withdrawal by 6 months, with a reduction in the frequency and distribution of features of atrophy in both the duodenum and jejunum. Biopsy specimens of the proximal small intestine alone may not reflect the healing that has occurred more distally in response to a GFD. Capsule endoscopy, in our study, showed that healing in the small intestine occurred from a distal to proximal direction with most residual changes remaining in the duodenum. The reasons for this finding are unclear, but may reflect a greater exposure of the duodenum to gluten and the disease-inducing peptides that could produce greater or more long-lasting changes in the mucosa compared with more distal involvement.5
This was a single-center study susceptible to both referral and regional bias; however, the inclusion of consecutive cases may have decreased the risk of selection bias.
In summary, this study, using WCE, showed the predominantly proximal distribution of visible features of atrophy in untreated CD and a significant reduction in the extent of involvement in response to a GFD, with some residual changes limited to the duodenum. This study strongly suggested that the extent of the enteropathy alone does not explain the wide clinical spectrum that characterizes CD.
Acknowledgments
Supported in part by Given Imaging Ltd, who did not have any role in the design, execution, analysis, or preparation of the manuscript. Also supported by National Institutes of Health grants DK-57892 and DK-070031 (J.A.M.).
Glossary
- CD
celiac disease
- CI
confidence interval
- GFD
gluten-free diet
- IQR
interquartile range
- WCE
wireless capsule endoscopy
References
- 1.Rostom A, Murray JA, Kagnoff MF. American Gastroenterological Association (AGA) Institute technical review on diagnosis and management of celiac disease. Gastroenterology. 2006;131:1981–2002. doi: 10.1053/j.gastro.2006.10.004. [DOI] [PubMed] [Google Scholar]
- 2.Ravelli AM, Tobanelli P, Minelli L, et al. Endoscopic features of celiac disease in children. Gastrointest Endosc. 2001;54:736–742. doi: 10.1067/mge.2001.119217. [DOI] [PubMed] [Google Scholar]
- 3.Brar P, Kwon GY, Egbuna, et al. Lack of correlation of degree of villous atrophy with severity of clinical presentation of celiac disease. Dig Liver Dis. 2007;39:26–29. doi: 10.1016/j.dld.2006.07.014. [DOI] [PubMed] [Google Scholar]
- 4.Marsh MN, Crowe PT. Morphology of the mucosal lesion in gluten sensitivity. Baillieres Clin Gastroenterol. 1995;9:273–293. doi: 10.1016/0950-3528(95)90032-2. [DOI] [PubMed] [Google Scholar]
- 5.MacDonald WC, Brandborg LL, Flich AL, et al. Studies of celiac sprue IV: the response of the whole length of the small bowel to a gluten free diet. Gastroenterology. 1964;47:573–589. [PubMed] [Google Scholar]
- 6.Lee SK, Green PH. Endoscopy in celiac disease. Curr Opin Gastroenterol. 2005;21:589–594. doi: 10.1097/01.mog.0000174218.00333.19. [DOI] [PubMed] [Google Scholar]
- 7.Brocchi E, Corazza GR, Caletti G, et al. Endoscopic demonstration of loss of duodenal folds in the diagnosis of celiac disease. N Engl J Med. 1989;321:263–264. doi: 10.1056/NEJM198809223191202. [DOI] [PubMed] [Google Scholar]
- 8.Jabbari M, Wild G, Goresky CA, et al. Scalloped valvulae conniventes: an endoscopic marker of celiac sprue. Gastroenterology. 1988;95:1518–1522. doi: 10.1016/s0016-5085(88)80071-4. [DOI] [PubMed] [Google Scholar]
- 9.Olds G, McLoughlin R, O'Morian C, et al. Celiac disease for the endoscopist. Gastrointest Endosc. 2003;58:92–95. doi: 10.1016/s0016-5107(02)70047-3. [DOI] [PubMed] [Google Scholar]
- 10.Dickey W. Endoscopic markers for celiac disease. Nat Clin Pract Gastroenterol Hepatol. 2006;3:546–551. doi: 10.1038/ncpgasthep0601. [DOI] [PubMed] [Google Scholar]
- 11.Oxentenko AS, Grisolano SW, Murray JA, et al. The insensitivity of endoscopic markers in celiac disease. Am J Gastroenterol. 2002;97:933–938. doi: 10.1111/j.1572-0241.2002.05612.x. [DOI] [PubMed] [Google Scholar]
- 12.Cammarota G, Pirozzi GA, Martino A, et al. Reliability of the “immersion technique” during routine upper endoscopy for detection of abnormalities of duodenal villi in patients with dyspepsia. Gastrointest Endosc. 2004;60:223–228. doi: 10.1016/s0016-5107(04)01553-6. [DOI] [PubMed] [Google Scholar]
- 13.Siegel LM, Stevens PD, Lightdale CJ, et al. Combined magnification endoscopy with chromoendoscopy in the evaluation of patients with suspected malabsorption. Gastrointest Endosc. 1997;43:226–230. doi: 10.1016/s0016-5107(97)70091-9. [DOI] [PubMed] [Google Scholar]
- 14.Badreldin R, Barrett P, Wooff DA, et al. How good is zoom endoscopy for assessment of villous atrophy in celiac disease? Endoscopy. 2005;37:994–998. doi: 10.1055/s-2005-870245. [DOI] [PubMed] [Google Scholar]
- 15.Iddan G, Meron G, Glukhovsky A, et al. Wireless capsule endoscopy. Nature. 2000;405:417. doi: 10.1038/35013140. [DOI] [PubMed] [Google Scholar]
- 16.Gong F, Swain P, Mills T. Wireless endoscopy. Gastrointest Endosc. 2000;51:725–729. doi: 10.1067/mge.2000.105724. [DOI] [PubMed] [Google Scholar]
- 17.Green PH, Rubin M. Capsule endoscopy in celiac disease: diagnosis and management. Gastrointest Endoscopy Clin N Am. 2006;16:307–316. doi: 10.1016/j.giec.2006.03.003. [DOI] [PubMed] [Google Scholar]
- 18.Costamagna G, Shah SK, Riccioni ME, et al. A prospective trial comparing small bowel radiographs and video capsule endoscopy for suspected small bowel diseases. Gastroenterology. 2002;123:999–1005. doi: 10.1053/gast.2002.35988. [DOI] [PubMed] [Google Scholar]
- 19.Voderholzer WA, Ortner M, Rogalla P, et al. Diagnostic yield of wireless capsule enteroscopy in comparison with compute tomography enteroclysis. Endoscopy. 2003;35:1009–1015. doi: 10.1055/s-2003-44583. [DOI] [PubMed] [Google Scholar]
- 20.Culliford A, Daly J, Diamond B, et al. The value of wireless capsule endoscopy in patients with complicated celiac disease. Gastrointest Endosc. 2005;62:55–61. doi: 10.1016/s0016-5107(05)01566-x. [DOI] [PubMed] [Google Scholar]
- 21.Cellier C, Green PHR, Collin P, et al. ICCE consensus for celiac disease. Endoscopy. 2005;37:1055–1059. doi: 10.1055/s-2005-870310. [DOI] [PubMed] [Google Scholar]
- 22.Petroniene R, Dubcenco E, Baker JP, et al. Given capsule endoscopy in celiac disease: evaluation of diagnostic accuracy and interobserver agreement. Am J Gastroenterol. 2005;100:685–694. doi: 10.1111/j.1572-0241.2005.41069.x. [DOI] [PubMed] [Google Scholar]
- 23.Hopper AD, Sidhu R, Hurlstone DP, et al. Capsule endoscopy: an alternative to duodenal biopsy for the recognition of villous atrophy in celiac disease? Dig Liver Dis. 2007;3992:140–145. doi: 10.1016/j.dld.2006.07.017. [DOI] [PubMed] [Google Scholar]
- 24.Vahedi K, Mascart F, Mary JY, et al. Reliability of antitransglutaminase antibodies as predictors of gluten-free compliance in adult celiac disease. Am J Gastroenterol. 2003;98:1079–1087. doi: 10.1111/j.1572-0241.2003.07284.x. [DOI] [PubMed] [Google Scholar]
- 25.Dickey W, Hughes DF, Path FRC, et al. Disappearance of endomysial antibodies in treated celiac disease does not indicate histological recovery. Am J Gastroenterol. 2000;95:712–714. doi: 10.1111/j.1572-0241.2000.01838.x. [DOI] [PubMed] [Google Scholar]
- 26.Wahab PJ, Meijer JW, Mulder CJ. Histologic follow-up of people with celiac disease on a gluten-free diet: slow and incomplete recovery. Am J Clin Pathol. 2002;118:458–463. doi: 10.1309/EVXT-851X-WHLC-RLX9. [DOI] [PubMed] [Google Scholar]
- 27.Lee SK, Lo W, Memeo L, et al. Duodenal histology in patients with celiac disease after treatment with a gluten-free diet. Gastrointest Endosc. 2003;57:187–191. doi: 10.1067/mge.2003.54. [DOI] [PubMed] [Google Scholar]
- 28.Marsh MN. Gluten, major histocompatibility complex, and the small intestine. A molecular and immunobiologic approach to the spectrum of gluten sensitivity (“Celiac sprue”) Gastroenterology. 1992;102:330–354. [PubMed] [Google Scholar]
- 29.Carrasco JL, Jover L. Estimating the generalized concordance correlation coefficient through variance components. Biometrics. 2003;59:849–858. doi: 10.1111/j.0006-341x.2003.00099.x. [DOI] [PubMed] [Google Scholar]
- 30.Murray JA, Van Dyke C, Plevak MF, et al. Trends in the identification and clinical features of celiac disease in a North American community: 1950–2001. Clin Gastroenterol Hepatol. 2003;1:19–27. doi: 10.1053/jcgh.2003.50004. [DOI] [PubMed] [Google Scholar]
- 31.Feinstein AR, Cicchetti DV. High agreement but low kappa: I. The problems of two paradoxes. J Clin Epidemiol. 1990;43:543–549. doi: 10.1016/0895-4356(90)90158-l. [DOI] [PubMed] [Google Scholar]
- 32.Cameron AH, Astley R, Hallowell M, et al. Duodeno-jejunal biopsy in the investigation of children with celiac disease. QJM. 1962;31:125–140. [PubMed] [Google Scholar]
- 33.Marsh MN. Mechanisms of diarrhea and malabsorption in gluten-sensitive enteropathy. Eur J Gastroenterol Hepatol. 1993;5:784–795. [Google Scholar]
- 34.Thompson H. Necropsy studies on adult celiac disease. J Clin Pathol. 1974;27:710–721. doi: 10.1136/jcp.27.9.710. [DOI] [PMC free article] [PubMed] [Google Scholar]
- 35.Karinen H, Karkkainen P, Pihlajamaki J, et al. Gene dose effect of the DQB1*0201 allele contributes to severity of celiac disease. Scand J Gastroenterol. 2006;41:191–199. doi: 10.1080/00365520500206277. [DOI] [PubMed] [Google Scholar]
- 36.Tursi A. Gastrointestinal motility disturbances in celiac disease. J Clin Gastroenterol. 2004;38:642–645. doi: 10.1097/01.mcg.0000118792.58123.c1. [DOI] [PubMed] [Google Scholar]
- 37.Hill ID, Dirks MH, Liptak GS, et al. North American Society for Pediatric Gastroenterology, Hepatology and Nutrition. Guideline for the diagnosis and treatment of celiac disease in children: recommendations of the NASPGHN. J Pediatr Gastroenterol Nutr. 2005;40:1–19. doi: 10.1097/00005176-200501000-00001. [DOI] [PubMed] [Google Scholar]
- 38.Ciacci C, Cirillo M, Cavallaro R, et al. Long-term follow-up of celiac adults on gluten-free diet: prevalence and correlates of intestinal damage. Digestion. 2002;66:178–185. doi: 10.1159/000066757. [DOI] [PubMed] [Google Scholar]
- 39.Tursi A, Brandimarte G, Giorgetti GM, et al. Endoscopic and histological findings in the duodenum of adults with celiac disease before and after changing to a gluten free diet: a 2-year prospective study. Endoscopy. 2006;38:702–707. doi: 10.1055/s-2006-925178. [DOI] [PubMed] [Google Scholar]