Abstract
The goal of this work is to develop and characterize an integrated indenter-ARFI (acoustic radiation force impulse) imaging system. This system is capable of acquiring matched datasets of ARFI images and stiffness profiles from ex vivo tissue samples, which will facilitate correlation of ARFI images of tissue samples with independently-characterized material properties. For large and homogeneous samples, the indenter can be used to measure the Young's moduli by using Boussinesq's solution for a load on the surface of a semi-infinite isotropic elastic medium. Experiments and finite element method (FEM) models were designed to determine the maximum indentation depth and minimum sample size for accurate modulus reconstruction using this solution. Applying these findings, indentation measurements were performed on three calibrated commercial tissue-mimicking phantoms and the results were in good agreement with the calibrated stiffness. For heterogeneous tissue samples, indentation can be used independently to characterize relative stiffness variation across the sample surface, which can then be used to validate the stiffness variation in registered ARFI images. Tests were performed on heterogeneous phantoms and freshly-excised colon cancer specimens to detect the relative stiffness and lesion sizes using the combined system. Normalized displacement curves across the lesion surface were calculated and compared. Good agreement of the lesion profiles was observed between indentation and ARFI imaging.
Keywords: Acoustic radiation force, ARFI imaging, indentation, ultrasound, Young's modulus
I. Introduction
Characterizing tissue mechanical properties has been the focus of many research efforts. As pathological changes are normally accompanied with stiffness changes,1 a measure of tissue mechanical properties can be a useful diagnostic method to detect abnormalities in soft tissues. Acoustic Radiation Force Impulse (ARFI) imaging is a radiation force based acoustic imaging technique that provides information about localized mechanical properties of the tissue.2-6 During ARFI imaging, localized displacements are generated in tissue by short, high-intensity, focused acoustic pulses and tracked using ultrasonic correlation-based methods.8 In tissue-mimicking phantoms, ARFI images demonstrate good contrast and boundary definition between stiffer spherical lesions and their background materials.8, 19 Fahey et al demonstrated the capability of ARFI imaging to monitor lesion formation during radiofrequency (rf) ablation.11, 12 In these applications, structures and stiffness variations are some-times visualized in ARFI images that are not observed in matched B-mode images due to a lack of contrast in acoustic properties between lesions and the background. To verify these ARFI imaging findings, an independent measure of tissue mechanical properties is needed.
Indentation is one of the most frequently used approaches to quantitatively measure the mechanical properties of soft tissues.12-20 This method measures the resultant force while pushing the indenter tip into the test material to a given displacement, and uses the force-displacement relation to reconstruct the material stiffness. Analytic solutions have been proposed for different indentation models with various materials, boundary conditions and indenter shapes. Boussinesq derived a linear force-displacement solution for a cylindrical indenter with a flat or spherical tip on a semi-infinite isotropic elastic homogeneous medium under a small strain assumption.21 Considering limited sample sizes and nonlinear effects involved with large deformation, Water modeled indentation on a thin rubber sheet with a spherical tip.22 Hayes mathematically analyzed indentation on articular cartilage,23 and Mak solved the biphasic indentation model24. Finite element method (FEM) models have also been used to simulate indentation on soft tissue samples with finite dimensions and fixed boundaries.25, 26
Although biological tissues are generally viscous, biphasic and nonlinear, researchers often assume the tissue to be isotropic, linear elastic and incompressible, so that a simple linear force-displacement relationship can be applied to calculate the moduli of biological tissues. During indentation, the slope of the force-displacement curve represents the material stiffness, which is a function of the geometry, boundary conditions and Young's modulus of the tissue. Samani proved numerically that the stiffness and Young's modulus are linearly related by a conversion factor, which is determined by the object's geometry and boundary conditions.18 By making this assumption, various indentation systems have been designed to measure the Young's moduli of tissue samples. Samples are cut to a specific shape and size, and their boundaries are set accordingly. Conversion factors are either determined experimentally or through FEM simulation.13, 17 However, the conversion factor can only be used for a specific geometry and boundary condition. Once the boundary conditions and sample geometry change, recalibration is necessary.
The goal of this work is to design and build an integrated ARFI imaging and indentation system, which is capable of acquiring matched datasets, so that indentation can be used to validate ARFI imaging findings in excised tissue specimens. In the first part of this project, conditions required for the application of Boussinesq's solution to quantify material stiffness in homogeneous samples were studied. Three commercially-available, tissue-mimicking phantoms of calibrated stiffness were employed to test the system. In the second part of this study, indentation mapping was performed on both tissue mimicking lesion phantoms and ex vivo colon specimens, whose resultant profiles were then compared to the corresponding ARFI images.
Linear indentation theory
The analytic solution derived by Boussinesq for the static response of a homogeneous semi-infinite elastic medium under an indenter tip with a flat end is given by Eq. (1):
| (1) |
| (2) |
where F and σ are the applied force on and stress distribution under the indenter tip, r is the distance from the center of the indenter tip, R is the radius of the tip, E and υ are the Young's modulus and Poisson's ratio of the medium and d is the displacement of the indenter tip. Equation (1) describes the relationship between force and displacement, which can be acquired by the indentation system. Equation (2) describes the stress distribution under the indenter tip for a given force.
II. Materials and Methods
A. Design of indentation system
A custom indentation system shown in figure 1 was built to measure the force-displacement relationship when an indenter tip compresses soft tissue. The device uses a 250-gram Honeywell load cell (Honeywell Sensotec, Columbus, OH) connected to a flat-end indenter probe to apply and measure incremental loads. Load signals are amplified by a Vishay 2310A Strain Gage Conditioner (Vishay Intertechnology Inc., Malvern, PA) and then digitized by an A/D converter in an XPS motion controller (Newport Corporation, 1791 Deere Ave., Irvine, CA 92606, USA). The XPS motion controller controls the three-dimensional movement of the indenter tip. The built-in signal acquisition card in the XPS motion controller samples the force signals and the positions of the indenter tip synchronously. These data are then sent to a laptop computer. The signal sampling rate can be as high as 10 kHz. The translation stage has an accuracy of 1 μm and a maximum speed of 10 mm/s in all three axes. In this study, the data sampling frequency was 500 Hz.
FIG. 1.
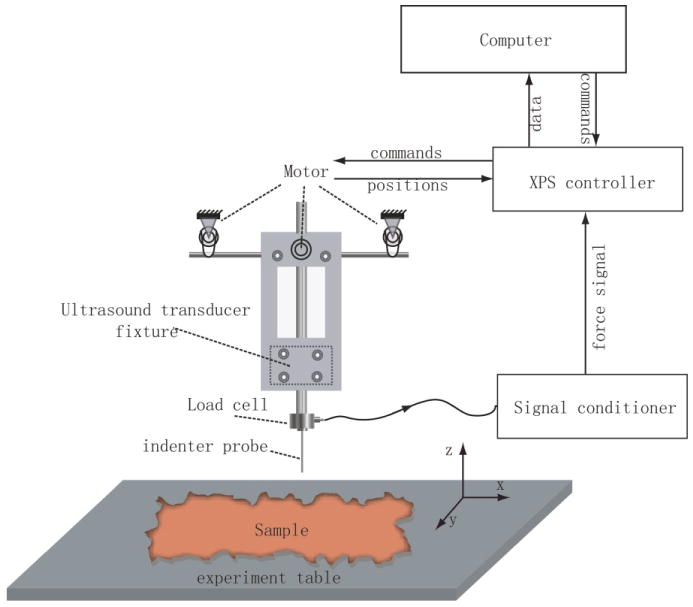
The combined indentation and ARFI imaging system. A flat ended cylindrical tip is attached to a 250-gram Honeywell load cell to measure the load signal, which is then amplified by a Vishay 2310A strain gage conditioner. The XPS motion controller moves the translation stage and samples both the force signal and motor position synchronously, and then sends the data to the laptop computer to process and display. The custom transducer holder keeps the imaging plane and indenter tip aligned so that the indentation data can be registered and compared with the ARFI image data.
A Labview (National Instruments Corporation, Austin, TX) program was developed to control the stage, collect the load and displacement data in real time, and automate 2D mapping of the surface geometry and stiffness of the test sample. After inputting the ranges and step sizes, the program calculated the locations to be indented and automated the indentation process point-by-point. At each indentation location, the sample's surface was first detected using a force threshold algorithm. A threshold of 0.69 mN, determined by the noise floor of the instrument, was used to detect surface contact in real-time. The indenter then compressed the tissue a predetermined displacement dependent upon the tip size with a preset speed and then returned to the sample surface. Finally, the tip returned to the initial height above the sample and translated to the next point. This process represents one cycle of indentation and was repeated until the entire region of interest was interrogated.
B. Validation of indentation system for stiffness quantification
1. Determination of maximum displacement
Equations (1) and (2) are only valid for small deformation and frictionless surfaces in an isotropic, elastic, semi-infinite medium. It is necessary to determine the maximum indentation depth for which the linear force-displacement relation described in the analytic solution holds. Substituting Eq. (1) into Eq. (2), we have
| (3) |
Because the stress distribution under the indenter tip is a function of d/R (for a material with a Young's modulus E and Poisson's ratio υ), the ratio d/R can be used to determine a threshold for satisfying the small deformation assumption.
Indenter tips of different diameters (1.0 mm, 1.2 mm, 1.5 mm, 1.8 mm and 2.0 mm) were used to determine the maximum displacement-diameter ratio in the linear force-displacement range on a homogeneous tissue-mimicking gelatin phantom.27 The phantom was cylindrical with a diameter of 80 mm and height of 53 mm, which is large compared to the indenter tips. The indenter was programmed to indent to 200% of the tip diameter from the phantom surface when nonlinear effects are clearly apparent in the indentation curve. The compression part of the indentation curve was low-pass filtered offline with a cutoff frequency of 5 Hz. In order to quantify the linear force-displacement range, a data window, whose initial length was 5% of the tip diameter, starting from the sample surface, was linearly fit. The mean of the absolute differences between fit data and raw data in this window was calculated, which was termed the average residual. By extending the length of the window, a curve of average residual was calculated, which approached the noise floor of the system when the data were linear and increased with increasing nonlinearity. Indentation was repeated at six different locations on the phantom surface for all indenter tips and the indentation depths satisfying the linear assumption were determined as a function of the tip diameter.
2. Minimal dimensions of test samples
Finite element method (FEM) models were created to determine the minimum size of the test sample for which the analytic solution described in Eqs. (1) and (2) is valid. The models were composed of two parts: an indenter tip and a test material, with a frictionless contact surface between them. Both parts were cylindrical in shape. The indenter tip was modeled as steel with a radius of 1.0 mm. The test material was modeled as a linear, isotropic and elastic material with a Poisson's ratio of 0.495 and Young's modulus of 5 kPa. A number of FEM models with varying test material sizes were created to determine the minimum sample size. The mesh was generated assuming quarter symmetry using Altair Hypermesh (Altair Engineering, Inc. Troy, MI). Eight-node cubic elements were used in the mesh. The models were solved with LS-DYNA3D (Livermore Software Technology Corporation, Livermore, CA) using an explicit, time-domain solver. The resultant stress and displacement under the indenter tip were recorded and compared to theoretical results.
3. Experimental validation in homogeneous phantoms
Three calibrated homogeneous tissue-mimicking phantoms (Computerized Imaging Reference Systems, Inc., Norfolk, Virginia 23513 USA) were measured by the indenter. All three phantoms are cylindrical in shape with a height of 20 mm and diameter of 50 mm. An indenter tip with a diameter of 2.0 mm was used. Based upon the findings from section B.1, the maximum displacement was set to 1.2 mm. The indentation speed in the axial direction was slow (1 mm/s) in order to meet the quasistatic requirement. For each phantom, an area of 20 mm by 20 mm was indented with spacing of 2.5 mm between adjacent locations. Mean and standard derivation of the reconstructed moduli were then computed and compared with the manufacturer-calibrated Young's moduli.
C. Indentation mapping
A lesion phantom (phantom A) was made to test the indenter's ability to map stiffness variation on the surface. As this phantom was not made for imaging, no scatterers were included and both the lesion and background material were made only from gelatin and water with 7% gelatin concentration. 100 and 300 Bloom strength gelatins were used for the background material and stiffer lesion, respectively.28 The background phantom has a rectangular shape with a width, length and height of 150 mm, 250 mm and 40 mm. The lesion was located in the center of the phantom surface, which was cylindrical in shape with a height of 30 mm and diameter 27 mm. Indentation was performed to measure the stiffness of the background material and the lesion using a 2 mm indenter tip before fusing them together to form a lesion phantom. To make the colon cancer mimicking lesion phantom, the lower half of the stiff lesion was buried in the soft background phantom and a small amount of hot melted background material was applied at the lesion boundary to fix the lesion. The phantom was then cooled until all parts congealed. The phantom recipes were designed to create Young's moduli consistent with those reported for normal colon tissues (2-25 kPa),31 and malignant lesions are normally a few times stiffer.32
Both line and 2D indentation were performed. The line-indentation was performed with an indentation spacing 0.2 mm and a range of 70 mm with four indenter tip diameters: 0.8 mm, 1.2 mm, 1.5 mm and 2.0 mm. The lesion sizes detected by the four tips were compared. Then, the stiffness profile detected by the 2.0 mm tip was subsampled to study the impact of the step size on lesion characterization. For 2D stiffness mapping, an area of 50 mm × 50 mm centered in the lesion was indented with a step size of 1 mm using the 2.0 mm diameter tip.
D. Matched lesion profiles
The combined indentation and ARFI imaging system was used to detect lesion profiles in heterogeneous samples (both phantoms and excised tissue specimens). Due to the heterogeneity, irregular surfaces and complex boundary conditions, the elastic moduli could not be reconstructed from analytic solutions for the indentation data. The indentation depths were set to 100% of tip diameters to increase the load signal. The detected lesion profiles from indentation and ARFI imaging were compared.
1. ARFI imaging sequences
ARFI imaging was performed using a Siemens 75L40 linear array (7.2 MHz, F/1.3 lateral focal configuration, F/3.8 elevation focal configuration with a fixed elevation focus at 20 mm) on a Siemens SONOLINETM Elegra scanner (Siemens Medical Solutions USA, Inc., Ultrasound Division, Issaquah, WA, USA). The lateral focal depth was 20 mm. 102 locations were interrogated with a beam spacing 0.22 mm. At each lateral location, a reference-tracking beam was transmitted, followed by high-intensity ARFI pushing beams that displaced the tissue.2-4 The duration of the pushing beams was 45 μs and the transmit power was the maximal value that the system can provide. A series of tracking beams with a pulse repetition frequency of 5.632 kHz after the push beam were used to track the tissue movement.
2. Data processing
To compare the indenter data with the displacement profiles calculated from the ARFI image, the indentation displacement at each location for a fixed load was calculated. Due to the heterogeneity and irregular surface shape of the lesion phantom, the load varied considerably among indentation locations. In order to find a common force that occurred in all the indentation locations, the maximum load at the most compliant point was used. In the ARFI imaging datasets, maximum displacements were calculated at each beam location. Since the indentation measurement reflects the cumulative stiffness variation underneath the tip in a heterogeneous sample and is most sensitive to the stiffness variation close to the sample surface, a 2 mm slice of ARFI imaging data determined empirically starting from the top surface was averaged axially and then normalized by the displacement at the lesion edge and compared with the indentation data.
3. Combined ARFI-Indentation phantom experiment
A cylindrical tissue-mimicking phantom (phantom B) was made with a stiff ellipsoidal lesion half embedded in the center of the phantom surface. The phantom had a diameter of 80 mm and a height of 53 mm. The background and lesion were made of 100 and 300 bloom gelatin.27 The long and short axes of the lesion in the imaging plane were 12 mm and 9 mm, respectively.
An ARFI imaging dataset was acquired along the lesion's largest dimension first. Then, indentation was performed along the imaging plane. A 2 mm diameter indentation tip was used. The maximum displacement was set to 2 mm. The indentation spacing was 1 mm. To calculate the lesion-to-background contrast, the formula 1 − Sl/Sb was used,28 in which Sl and Sb are the mean displacement in the lesion and background, respectively.
4. Combined ARFI-Indentation ex-vivo experiment
A freshly-excised, surgical colon cancer specimen was collected, bisected and pinned on a corkboard prior to histological sectioning. The sample was imaged and then indented at room temperature. Saline was periodically sprayed on the surface of the specimen to prevent dehydration. During the indentation, a tip with a diameter 1.5 mm was used. The step size and maximum displacement were 0.8 mm and 1.5 mm, respectively.
III. Results
A. Maximum indentation depth and minimal sample dimensions
Indentation data of a single cycle using a 2mm-diameter indenter tip in a homogeneous phantom are shown in figure 2. The plots show the raw force-displacement data (solid line), and its resultant curve after the low-pass filter. Before the indenter tip reached the phantom surface, the force was approximately zero, which is shown as the flat region at the very beginning of the curves. After the point of contact, the force grew linearly with the displacement initially and became nonlinear with increasing indentation depth. The average residual curve is shown as a dashed line. In the linear region, the average residual values are constant with small variations, and increase with increasing nonlinearity. A threshold value of 0.001 was used to determine the end of the linear region in the average residual curve.
FIG. 2.
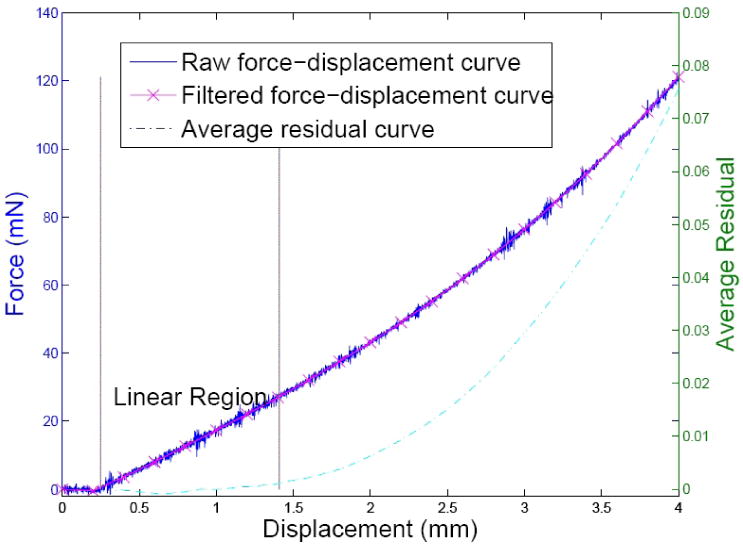
Indentation curve and determination of its linear region. The solid line is the raw indentation curve acquired by a tip of 2 mm in diameter. The ‘x’ marked line is the filtered indentation curve, whose ordinate is shown on the left. The dashed line shows the average residual curve and its ordinate is shown on the right. The abscissa is the displacement of the indenter tip. The linear region was determined to be between the point of surface contact and 0.001 in the average residual curve, which is shown between the two vertical lines.
Five indentation tips of varied diameters (1.0 mm, 1.2 mm, 1.5 mm, 1.8 mm and 2.0 mm) were tested to determine the maximum indentation depth. The linear regions of the force-displacement curves were calculated and are shown in figure 3. The maximum indentation depths were normalized by the tip diameters respectively. The error bars were based on six tests for each indenter tip. Data from all the tips exhibited linear behavior within the depth up to 60% of the indenter tip diameter.
FIG. 3.
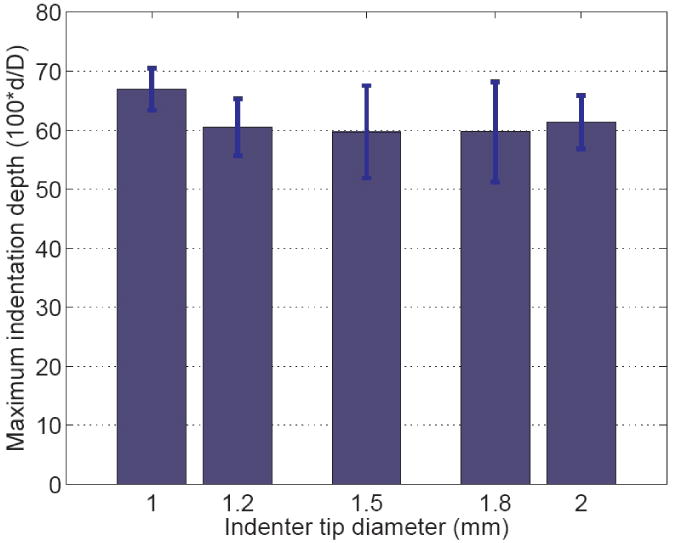
Normalized maximum indentation depths where a linear force-displacement relation is maintained, from five indenter tips of different sizes. The error bars were calculated based on 6 trials. The maximum indentation depth was normalized by the diameters of the indenter tips. All the tips show a linear region up to 60% of the tip diameter.
To investigate the influence of specimen size on the measurement, FEM models of different sample sizes were developed. Young's moduli were computed using Eq. (1) and normalized to the input material stiffness (5 kPa). The curves showing the width and height effects are shown in figure 4; a limited height can potentially overestimate the Young's modulus and a limited width can underestimate it. The plots suggest that when both the sample height and radius are over 15 times of the indenter tip size, the analytic solution can be directly applied to reconstruct material stiffness.
FIG. 4.
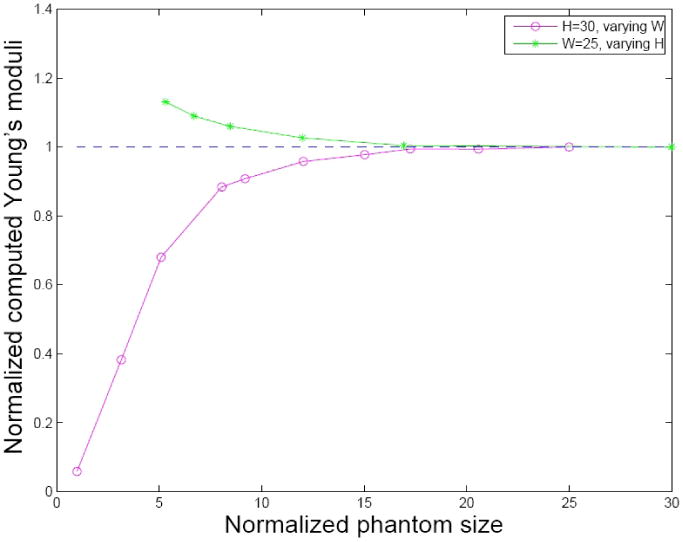
Impact of the sample sizes. Both the height and width were normalized by the tip radius. The circles represent reconstructed Young's moduli when keeping sample height constant (30 times the radius) and varying the sample width; the stars represent those keeping width constant (25 times the radius) and changing the sample height.
The measured Young's moduli of the three CIRS phantoms and those quantified by the manufacturer are listed in table 1; the mean stiffness and standard errors were computed from 81 locations from an area of 20 mm × 20 mm for each phantom. The table shows good agreement with the stiffness measured by the indenter and those quantified by the manufacturer.
TABLE 1.
Young's moduli of CIRS phantoms.
| Phantom | 1 | 2 | 3 |
|---|---|---|---|
| Quoted Young's modulus (kPa) | 3.6 | 8.1 | 12.1 |
| Measured modulus (kPa) | 3.0 ± 0.1 | 7.6 ± 0.1 | 11.8 ± 0.1 |
B. Indentation mapping on phantoms with lesions
The stiffness of the background material and the stiff lesion in phantom A were measured separately prior to combining them, to be 11.6 ± 0.2 kPa and 21.6 ± 0.9 kPa. Figure 5 shows the stiffness and surface plots across this phantom from line-indentation mapping using four different indenter tips with diameters 0.8 mm, 1.2 mm, 1.5 mm and 2.0 mm, and a spacing of 0.2 mm. The lesion can be clearly identified from both the surface geometric map and the stiffness maps. The reconstructed stiffness given in the ordinate was computed by neglecting the complex boundary conditions and applying Boussinesq's analytic solution to the force displacement data. The four tips give similar lesion stiffness profiles. The smaller tips give relatively noisier lesion profiles. The spikes at the lesion edges were created by the poor contact at sharp edges of the lesion. Using a mean stiffness value between the background material and lesion material (16.6 kPa), thlesion's full width at half maximum (FWHM) and the reconstructed stiffness within the FWHM for each tip are computed in table 2. At the base of the lesion profiles, all tips gave the lesion width around 26.8 mm compared with the true lesion diameter 27.0 mm. The reconstructed stiffness is lower at the edges and plateaus at the center of the lesion. Smaller tips plateaued faster than the bigger tips. For example, the widths of the 95% peak stiffness determined by the 0.8 mm and 2.0 mm tips are 17.8 mm and 15.4 mm. In this region, the reconstructed stiffness of the lesion using the 2 mm tip is calculated to be 20.9 ± 0.3kPa.
FIG. 5.
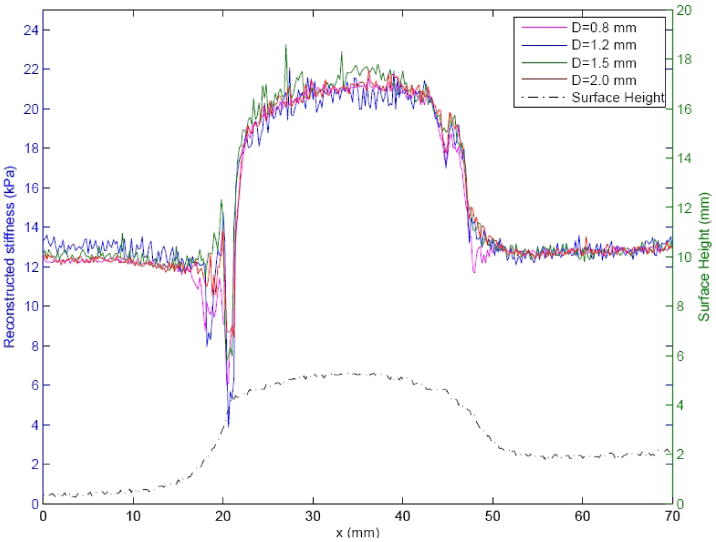
Line indentation mapping on phantom A with 0.2 mm step size. The curves on the top are the reconstructed stiffness using different indenter tips with the diameters 0.8 mm, 1.2 mm, 1.5 mm and 2.0 mm by applying Boussinesq's solution at each indentation location. The curve at bottom is the plot of surface shape detected by indentation. The abscissa represents the location, the left ordinate represents the reconstructed stiffness and the right ordinate represents the relative height of the phantom surface.
TABLE 2.
Line-indentation results.
| Tip diameter (mm) | 0.8 | 1.2 | 1.5 | 2.0 |
|---|---|---|---|---|
| Lesion width (FWHM) (mm) | 25.4 | 25.4 | 25.0 | 24.8 |
| Reconstructed stiffness (kPa) | 20.0 ± 1.1 | 20.6 ± 1.2 | 20.4 ± 1.0 | 20.2 ± 1.1 |
The stiffness profile acquired by the 2 mm diameter tip was subsampled to test the influence of different indentation step sizes. Figure 6 shows the step sizes of 0.2 mm, 1.0 mm and 2.0 mm. All step sizes detect the lesion. However, the 2 mm step size portrays poorer resolution at the edges of the lesion. The plots show that a step size of 1.0 mm, which is 50% of the tip diameter, preserves the details of the lesion while only requiring 20% of the indentation locations that the 0.2 mm step size requires.
FIG. 6.
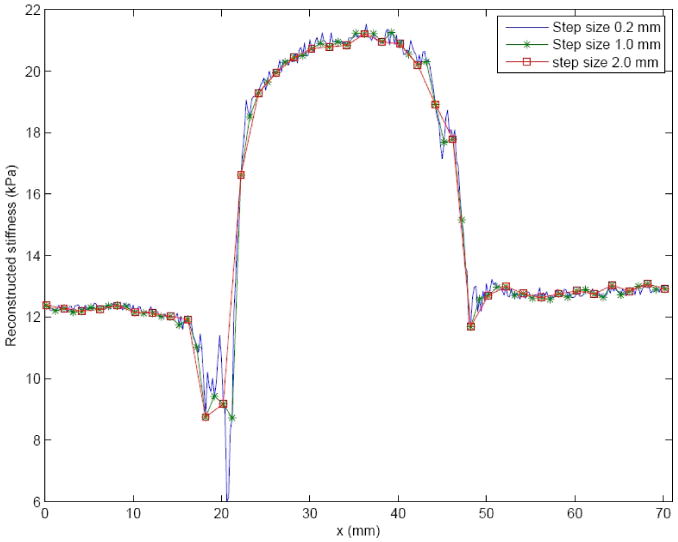
Line indentation of phantom A with different indentation step sizes. The indentation tip diameter was 2 mm. The original stiffness profile sampled at 0.2 mm was subsampled to 1.0 mm and 2.0 mm.
The results of 2D indentation mapping are shown in figure 7. The surface geometric characteristics of the phantom are shown on the left, portraying the FWHM of the protruding structure to be 28.7 mm. The reconstructed stiffness image is shown on the right, portraying with the FWHM of the lesion to be 24.5 mm. The stiffness image clearly portrays the boundary of the lesion.
FIG. 7.
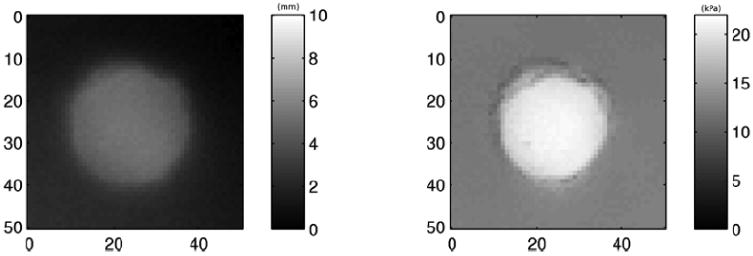
Two dimensional indentation mapping of phantom A. The surface geometric map of the phantom is shown on the left and stiffness map on the right.
C. Matched lesion profiles
The coregistered B-Mode and ARFI images of phantom B are shown in figure 8. On the left is the B mode image. A spherical lesion can be seen with low contrast (35.4%). On the right is the maximum displacement image calculated from the ARFI dataset, in which brightness represents the displacement amplitude, ranging from 0-14 μm. Higher amplitudes correspond to more compliant materials. The lesion exhibits smaller displacements than the background material (contrast 83.7%). The areas defined by the dashed boxes were used to calculate the contrast. Displacement profiles from ARFI imaging and indentation are plotted in figure 9. The dashed line represents the indentation displacement at a fixed force (83 mN). The solid line is the ARFI displacement averaged axially across a 2 mm band at the phantom surface (14-16 mm in depth). Both profiles were normalized by the values at the left edge of the lesion respectively. The lesion width as determined from the indentation is slightly smaller than the ARFI image (9.7%).
FIG. 8.

Matched B mode and ARFI images on the lesion phantom. The left side is the B-mode image and the right side is the maximum-displacement image calculated from ARFI dataset. The units of the axes are mm. In the B-mode image, the lesion-to-background contrast is 35.4% while it is 83.7% for the ARFI image. The contrast values were calculated based on the gray values within the area defined by the dashed box.
FIG. 9.
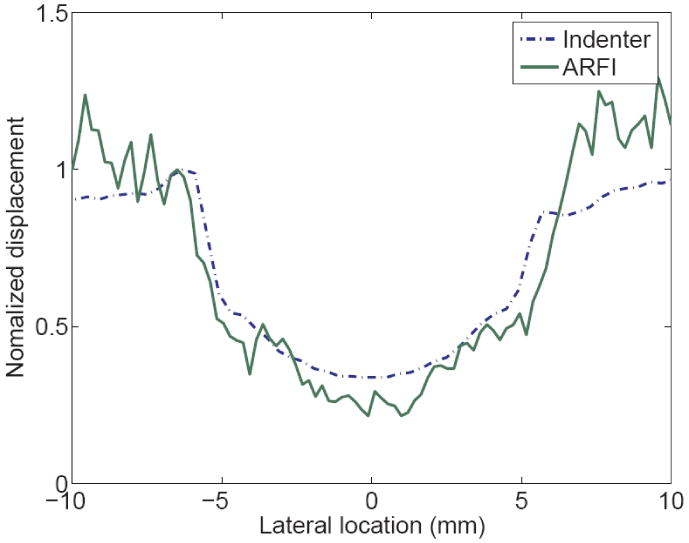
Normalized displacement profiles on the lesion phantom measured from indentation and ARFI image. The dashed line represents the indentation displacement at a fixed force (14 mN). The solid line is the ARFI displacement averaged axially across the 2 mm band below the sample surface. Both profiles were normalized by the values at the left edge of the lesion respectively.
Coregistered B-mode and ARFI images of the excised colon cancer specimen are shown in figure 10. The top shows the B-mode image. The continuous dark lines shown in both B-mode and ARFI images are the muscularis propria layer of the colon.4 The tumor is circled in the B-mode image. Both images indicate that the tumor has penetrated into the muscularis propria layer. Because of coupling difficulties, it was not possible to image the tissue beyond the right side of the tumor. In the ARFI image, the left side of the tumor (darker) looks stiffer than the right side. The region between the two dashed lines was the region used to compare with the indentation results. The normalized displacement profiles across the tumor are shown in figure 11. The displacement profiles from the indentation and ARFI imaging are in good agreement with respect to the tumor size and relative stiffness.
FIG. 10.
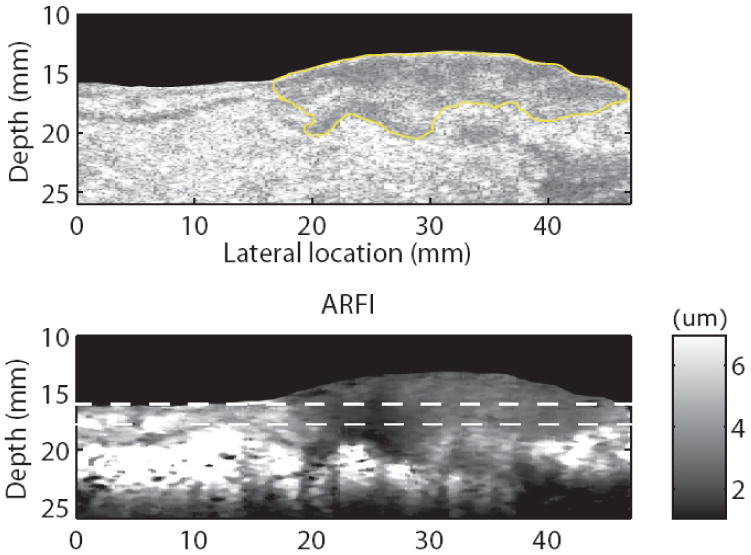
Matched B-mode (a) and ARFI (b) images in the colorectal cancer sample. The tumor is circled in the B-mode image. The color bar describes the displacement scale shown in the ARFI image.
FIG. 11.
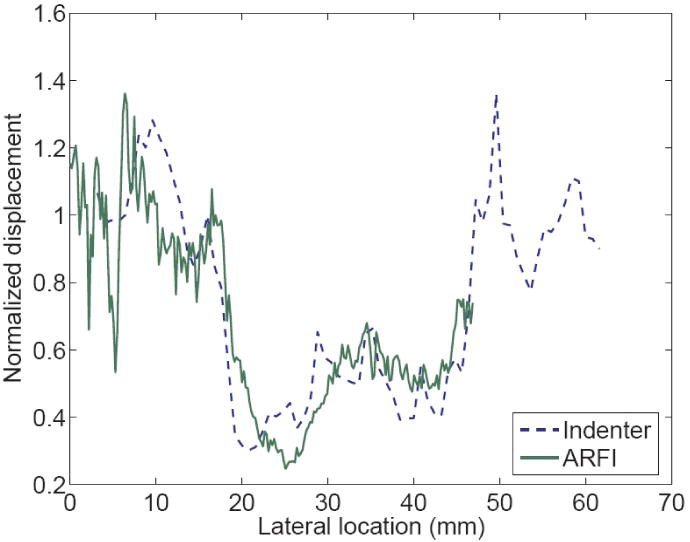
Normalized displacement profiles on the colon cancer specimen measured from indentation and ARFI image. The dashed line represents the indentation displacement at a fixed force (5 mN). The solid line is the ARFI displacement averaged axially across the 2 mm band below the sample surface. Both profiles were normalized by the values at the left edge of the lesion respectively.
IV. Discussion
An integrated indenter-ARFI imaging system has been developed to acquire matched datasets. The indenter is used to characterize the stiffness map of the test sample surface in order to validate the findings of ARFI imaging. It has been demonstrated that the indenter is able to measure material moduli by applying Boussinesq's analytic solution on large and homogeneous elastic samples. However, for tissue samples with complex boundary conditions and limited sizes, the analytic solution does not apply. Under these conditions, the indenter provides combined information about the sample including its mechanical properties, boundary conditions and geometry. Although the sample's modulus cannot be calculated, the lesion size and its relative stiffness provided by the indenter are useful and have been used to validate the lesion profiles detected by ARFI imaging.
When using the indenter to reconstruct material stiffness, it is critical to satisfy all the underlying assumptions. In this paper, the conditions for applying the analytic solution described in Eq. (1) to a clinically-relevant range of tissue elastic moduli and geometries and indenter tip sizes was investigated. Based on the derivation in Eq. (3), the stress distribution under the indenter tip is dependent on the displacement-to-tip size ratio and the material stiffness under the linearity assumption. The maximum indentation depth, where the force-displacement curve remains linear, was determined to be 60% of the tip diameter. Beyond this limit, force increases nonlinearly with displacement. Thus, significant overestimation can be produced if the analytic solution is applied in the nonlinear range. For example, for the indentation curve shown in figure 2, a 2.8% overestimation of the modulus will occur if the maximum displacement is 80% of the tip diameter compared with 12% overestimation for a displacement of 120% the tip diameter and 25% overestimation for 160% of the tip diameter.
The minimum dimensions of the test material that are required to satisfy the semi-infinite assumption for the Boussinesq's solution were determined by FEM simulations, which suggest a sample can be considered large enough when its height and radius are over 15 times of the indenter tip radius. As shown in figure 4, a smaller sample width results in underestimation of the material stiffness, which means less force is needed to achieve a displacement than for wider samples. This is due to the fact that the free boundaries allow the material to be more compliant under the indenter tip when indentation is performed close to the sample edge. When the sample is too thin, the same indentation displacement can generate larger strain, which will result in higher force and overestimation of the stiffness. The opposing effects of width and height can cancel each other and can be beneficial when measuring tissue samples of limited sizes. However, the increased strain in samples with small thickness can decrease the linear force-displacement region. Therefore, caution should be taken not to exceed the linear limit when reconstructing the Young's moduli of specimens with limited height. The radii of the indenter tips used with this indentation system range from 0.15 mm to 1.0 mm depending upon the sample size. For the smallest indenter tip, a cylindrical sample as small as 2.25 mm tall and 4.5 mm in diameter is large enough to achieve accurate stiffness quantification. Also, the boundaries of the test sample do not need to be fixed, which makes this indenter a practical and convenient tool for quantifying the stiffness of soft tissues.
A sufficient signal-to-noise (SNR) ratio is always desired during measurement. Although greater indentation depths generate larger load signals, the maximum indentation depth is dictated by the linear force-displacement range. Also, damage of the sample surface can be another concern that limits the indentation depth. Defining the ratio d/R of the indentation depth d to the tip diameter D as α, Eq. (1) can be rewritten as
| (4) |
As demonstrated empirically in figure 3, the upper limit of in the linear force-displacement region is constant (0.6) for all tip sizes. The maximum force signal decays quadratically with decreasing indenter tip size R. For the same noise level, a larger tip will achieve higher SNR. However, when sample size is limited, the indenter tip size has to be small enough to satisfy the boundary conditions of the analytic solution. The trade-off between SNR and sample size must be evaluated prior to indentation of a given sample.
In the mapping test of the lesion phantoms, the indenter correctly determined the lesion boundaries. When the sample has a flat surface and the local homogeneous region is relatively large compared to the indenter tip (phantom A), the indenter is able to quantify the local stiffness. When the sample surface geometry is rough, the indenter cannot provide absolute material stiffness, however it does provide relative stiffness profiles to identify lesion boundaries (Figs. 9, 11), which is useful for validating ARFI findings.
When mapping heterogeneous tissue samples, the optimal indenter tip size is determined by two competing effects: signal-to-noise ratio (SNR) and spatial resolution. A smaller indenter tip acquires more localized information about the sample, thus it is less influenced by the geometry changes and has higher spatial resolution. As shown in figure 5 and table 2, the smaller tips measure larger FWHM (more accurate values), thus detecting sharper edges. On the top of the lesion, smaller tips have larger plateau areas where the stiffness can be reconstructed without considering the effects from the limited boundaries. However, the SNR decreases significantly with the tip size. The detected lesion profiles using smaller tips are noisier (see figure 5). This also affects the surface detection during automatic indentation mapping using a small tip. For a constant force threshold, which is normally determined by the system noise floor, the smaller tip indents farther into the sample prior to detecting surface contact. Therefore, the surface contact algorithm fails in very soft samples, because the threshold load is not achieved until significant displacement is applied. This can overestimate the tissue stiffness due to nonlinear effects,29 in addition to risking damaging soft tissues. Therefore, the indenter tip size needs to be carefully chosen for each experiment according to the sample stiffness and size. In the ex vivo colon cancer study, the typical specimen size is over 200 mm by 150 mm with a thickness of 20 mm, and the lesions are generally more than 15 mm in diameter and the mucosal layer is very soft. An indenter tip diameter between 1.5 mm and 2.0 mm is normally used.
Indentation step size is another variable when indenting heterogeneous tissue samples. Although smaller indentation spacing is desired to maintain high spatial resolution, the indentation time required increases linearly with the number of indentation points. As a continuum, the mechanical properties acquired at one location depend on the surrounding material. The indenter tip effectively averages the underlying tissue. Thus, excessive over sampling is not necessary. Figure 6 shows that a step size of 50% of the tip diameter is comparable to the smaller step size in detecting the lesion edge. Therefore, for all the subsequent experiments, a step size of 50% of the tip diameter was used.
In figure 11, the indentation force used to compute the lesion profile was 5 mN. With a 2 mm diameter tip, it generated an average stress of 1.6 kPa across the indenter surface; assuming the Young's modulus of the normal tissue is 3 kPa, the displacement at 5 mN is only 0.6 mm, which was within the linear force-displacement range (1.2 mm). Stress distributions within tissue introduced by ARFI pulses was investigated using FEM simulations. 5, 8, 9 The stress amplitudes within the region of interest (ROI) of this study were computed to be 200 to 300 Pa. With the small stress and displacement, both the indenter and ARFI imaging system interrogate tissue within the linear stress-strain range.
A limitation of this study is that viscoelastic effects were not considered during the experiments. Biological tissues are generally viscoelastic, and in viscoelastic materials, higher elastic moduli are associated with higher rates of excitation. The rates of mechanical excitation of the tissue differ greatly between ARFI and the indenter; thus, in viscoelastic materials, the absolute elastic moduli would likely differ between the two measurement methods. However, the relative differences in material stiffness across heterogeneous viscoelastic tissue specimens as determined by both methods can be expected to trend together. Figures 9 and 11 show good agreement between lesion sizes and relative stiffness for both indentation and ARFI imaging.
V. Conclusion
An integrated indentation and ARFI imaging system has been developed to characterize the stiffness of soft tissues. The system is capable of acquiring stiffness maps on the surface of tissue samples and matched ARFI datasets. For relatively large elastic and homogeneous materials, the indenter can be used to quantify Young's modulus, as has been validated both experimentally and through FEM simulation. For heterogeneous samples, the indenter provides combined structural and material stiffness information, which has been used to validate stiffness variations portrayed in ARFI images.
Acknowledgments
The authors would like to thank Dr. Gregg Trahey for his valuable insights in this project, and Siemens Medical Systems, ultrasound group for their technical support. This work is supported by NIH 1R01CA-114075.
References
- 1.Skovoroda A, Klishko A, Gusakyan D, et al. Quantitative analysis of the mechanical characteristics of pathologically changed soft biological tissues. Biophysics. 1995;40:1359–1364. [PubMed] [Google Scholar]
- 2.Nightingale K, Bentley R, Trahey G. Observations of tissue response to acoustic radiation force: Opportunities for imaging. Ultrasonic Imaging. 2002;24:100–108. doi: 10.1177/016173460202400301. [DOI] [PubMed] [Google Scholar]
- 3.Nightingale K, Palmeri M, Nightingale R, Trahey G. On the feasibility of remote palpation using acoustic radiation force. J Acoust Soc Am. 2001;110:625–634. doi: 10.1121/1.1378344. [DOI] [PubMed] [Google Scholar]
- 4.Nightingale K, Soo M, Nightingale R, Trahey G. Acoustic radiation force impulse imaging: In vivo demonstration of clinical feasibility. Ultrasound Med Bio. 2002;28:227–235. doi: 10.1016/s0301-5629(01)00499-9. [DOI] [PubMed] [Google Scholar]
- 5.Palmeri M. PhD thesis. Duke University; 2005. Imaging the Mechanical Properties of tissue with Ultrasound: An Investigation of the Response of Soft Tissue to Acoustic Radiation Force. [Google Scholar]
- 6.Palmeri M, Frinkley K, Zhai L, et al. Acoustic radiation force impulse (ARFI) imaging of the gastrointestinal tract. Ultrasonic Imaging. 2005;27:75–88. doi: 10.1177/016173460502700202. [DOI] [PubMed] [Google Scholar]
- 7.Pinton G, Dahl J, Trahey G. Rapid tracking of small displacements with ultrasound. IEEE Trans Ultrason Ferroelec Freq Contr. 2006;53:1103–1117. doi: 10.1109/tuffc.2006.1642509. [DOI] [PubMed] [Google Scholar]
- 8.Palmeri M, Congdon A, Bouchard R, Nightingale R, Nightingale K. A finite element method model of soft tissue response to impulsive acoustic radiation force. IEEE Trans Ultrason, Ferroelec, Freq Contr. 2005;52:1688–1712. doi: 10.1109/tuffc.2005.1561624. [DOI] [PMC free article] [PubMed] [Google Scholar]
- 9.Palmeri M, McAleavey S, Fong K, Trahey G, Nightingale K. Dynamic mechanical response of elastic spherical inclusions to impulsive acoustic radiation force excitation. IEEE Trans Ultrason Ferroelec Freq Contr. 2006;53:2065–2079. doi: 10.1109/tuffc.2006.146. [DOI] [PMC free article] [PubMed] [Google Scholar]
- 10.Fahey B, Nightingale K, McAleavey S, et al. Acoustic radiation force impulse imaging of myocardial radio frequency ablation: initial in vivo results. IEEE Trans Ultrason Ferroelec Freq Contr. 2005;52:631–641. doi: 10.1109/tuffc.2005.1428046. [DOI] [PubMed] [Google Scholar]
- 11.Fahey B, Nightingale K, Nelson R, Palmeri M, Trahey G. Acoustic radiation force impulse imaging of the abdomen: demonstration of feasibility and utility. Ultrasound Med Biol. 2005;31:1185–1198. doi: 10.1016/j.ultrasmedbio.2005.05.004. [DOI] [PubMed] [Google Scholar]
- 12.Zheng Y, Mak A. An ultrasound indentation system for biomechanical properties assessment of soft tissues in vivo. IEEE Trans Biomed Engin. 1996;43:912–918. doi: 10.1109/10.532125. [DOI] [PubMed] [Google Scholar]
- 13.Erkamp R, Skovoroda A, Emelianov S, O'Donnell M. Measuring the elastic modulus of small tissue samples. Ultrasonic Imaging. 1998;20:17–28. doi: 10.1177/016173469802000102. [DOI] [PubMed] [Google Scholar]
- 14.Toyras J, Niinimaki M, Lindgren R, et al. Estimation of the young's modulus of articular cartilage using an arthroscopic indentation instrument and ultrasonic measurement of tissue thickness. J Biomech. 2001;34:251–256. doi: 10.1016/s0021-9290(00)00189-5. [DOI] [PubMed] [Google Scholar]
- 15.Geyer M, Brienza D, Chib V, Wang J. Quantifying fibrosis in venous disease: Mechanical properties of lipodermatosclerotic and healthy tissue. Adv Skin Wound Care. 2004;17:131–142. doi: 10.1097/00129334-200404000-00014. [DOI] [PubMed] [Google Scholar]
- 16.Korhonen R, Saarakkala S, Toyras J, et al. Experimental and numerical validation for the novel configuration of an arthroscopic indentation instrument. Phys Med Biol. 2003;48:1565–1576. doi: 10.1088/0031-9155/48/11/306. [DOI] [PubMed] [Google Scholar]
- 17.Samani A, Bishop J, Luginbuhl C, Plewes D. Measuring the elastic modulus of ex vivo small tissue samples. Phys Med Biol. 2003;48:2183–2198. doi: 10.1088/0031-9155/48/14/310. [DOI] [PubMed] [Google Scholar]
- 18.Samani A, Plewes D. A method to measure the hyperelastic parameters of ex vivo breast tissue samples. Phys Med Biol. 2004;49:4395–4405. doi: 10.1088/0031-9155/49/18/014. [DOI] [PubMed] [Google Scholar]
- 19.Arokosiki J, Surakka J, Ojala T, Kolari P, Jurvelin J. Feasibility of the use of a novel soft tissue stiffness meter. Physiol Meas. 2005;26:215–228. doi: 10.1088/0967-3334/26/3/007. [DOI] [PubMed] [Google Scholar]
- 20.Han L, Burcher M, Noble J. Non-invasive measurement of biomechanical properties of in vivo soft tissues. Lecture Notes Comp Sci. 2002;2488:208–215. [Google Scholar]
- 21.Timoshenko S, Goodier JN. Theory of elasticity. McGraw-Hill; New York: 1971. [Google Scholar]
- 22.Water N. The indentation of thin rubber sheets by spherical indenters. Br J Appl Phys. 1965;16:557–563. [Google Scholar]
- 23.Hayes W, Herrmann G, Mockros L, Keer L. A mathematical analysis for indentation tests of articular cartilage. J Biomech. 1972;5:541–551. doi: 10.1016/0021-9290(72)90010-3. [DOI] [PubMed] [Google Scholar]
- 24.Mak AF, Lai W, Mow V. Biphasic indentation of articular-cartilage: 1. theoretical analysis. J Biomech. 1989;20:703–714. doi: 10.1016/0021-9290(87)90036-4. [DOI] [PubMed] [Google Scholar]
- 25.Zhang M, Zheng Y, Mak AF. Estimating the effective young's modulus of soft tissues from indentation tests—nonlinear finite element analysis of effects of friction and large deformation. Medical Engin Phys. 1997;19:512–517. doi: 10.1016/s1350-4533(97)00017-9. [DOI] [PubMed] [Google Scholar]
- 26.Liu Y, Kerdok A, Howel R. A nonlinear finite element model of soft tissue indentation. Lecture Notes Comp Scie. 2004;3078:67–76. [Google Scholar]
- 27.Hall T, Bilgen M, Insana M, Krouskop T. Phantom materials for elastography. IEEE Trans Ultrason Ferroelec Freq Contr. 1997;44:1355–65. [Google Scholar]
- 28.Bushberg J, Seibert J, Leidholdt E, Boone J. The Essential Physics of Medical Imaging. Lippincott Williams & Wilkins; 2002. [Google Scholar]
- 29.Krouskop T, Wheeler T, Kallel F, Garra B, Hall T. Elastic moduli of breast and prostate tissues under compression. Ultrasonic Imaging. 1998;20:260–274. doi: 10.1177/016173469802000403. [DOI] [PubMed] [Google Scholar]
- 30.Wellman P, Howe R, Dalton E, Kern K. Breast tissue stiffness in compression is correlated to histological diagnosis, Technical report. Harvard Biorobotics Laboratory; 1999. [Google Scholar]
- 31.Dall F, Jorgensen C, Houe D, Gregersen H, Djurhuus J. Biomechanical wall properties of the human rectum: a study with impedance planimetry. Gut. 1993;34:1581–1585. doi: 10.1136/gut.34.11.1581. [DOI] [PMC free article] [PubMed] [Google Scholar]
- 32.Sarvazyan A. Handbook of Elastic Properties of Solids, Liquids and Gases. Academic Press Inc.; New York: 2000. Elastic properties of soft tissue; pp. 107–125. [Google Scholar]


