Abstract
Background:
We have developed and tested a method for printing protein microarrays and using these microarrays in a comparative fluorescence assay to measure the abundance of many specific proteins in complex solutions. A robotic device was used to print hundreds of specific antibody or antigen solutions in an array on the surface of derivatized microscope slides. Two complex protein samples, one serving as a standard for comparative quantitation, the other representing an experimental sample in which the protein quantities were to be measured, were labeled by covalent attachment of spectrally resolvable fluorescent dyes.
Results:
Specific antibody-antigen interactions localized specific components of the complex mixtures to defined cognate spots in the array, where the relative intensity of the fluorescent signal representing the experimental sample and the reference standard provided a measure of each protein's abundance in the experimental sample. To test the specificity, sensitivity and accuracy of this assay, we analyzed the performance of 115 antibody/antigen pairs. 50% of the arrayed antigens and 20% of the arrayed antibodies provided specific and accurate measurements of their cognate ligands at or below concentrations of 0.34 μg/ml and 1.6 μg/ml, respectively. Some of the antibody/antigen pairs allowed detection of the cognate ligands at absolute concentrations below 1 ng/ml, and partial concentrations of 1 part in 106, sensitivities sufficient for measurement of many clinically important proteins in patient blood samples.
Conclusions:
These results suggest that protein microarrays can provide a practical means to characterize patterns of variation in hundreds of thousands of different proteins in clinical or research applications.
Background
The need for technologies that allow highly parallel quantitation of specific proteins in a rapid, low-cost and low-sample-volume format has become increasingly apparent with the growing recognition of the importance of global approaches to molecular characterization of physiology, development, and disease [1,2]. The ability to quantitate multiple proteins simultaneously has applications in basic biological research, molecular classification and diagnosis of disease, identification of therapeutic markers and targets, and profiling of response to toxins and pharmaceuticals. Many standard assays are amenable to parallel analysis in microtiter plates, but sample and reagent consumption can be prohibitive in large-scale studies. Two-dimensional gels are now widely used for large-scale protein analysis in cancer research [3] and other areas of biology [4]. Two-dimensional gels have been used to separate and visualize 2,000-10,000 proteins in a single experiment [5], and subsequent excision of protein bands and detection by mass spectrometry can enable identification of the proteins [6].
Ordered arrays of peptides and proteins provide the basis of another strategy for parallel protein analysis. DNA microarrays have demonstrated the effectiveness of this approach in many areas of biological research (see [7,8,9] for reviews). Protein assays using ordered arrays have been explored since the development of multipin synthesis [10] and spot synthesis [11] of peptides on cellulose supports. Protein arrays on membranes have been used to screen binding specificities of a protein expression library [12,13,14] and to detect DNA-, RNA-, and protein-binding targets [15]. Arrays of clones from phage-display libraries can be probed with an antigen-coated filter for high-throughput antibody screening [16]. Antibodies bound to glass can be used as a flow-cell array immunosensor [17], and antibodies spotted into glass-bottom microwells have been used for miniaturized, high-throughput ELISA [18]. Multiple antigens and antibodies have been patterned onto polystyrene using a desktop jet printer [19] and onto glass by covalent attachment to polyacrylamide gel pads [20] for parallel immunoassays. Proteins covalently attached to glass slides through aldehyde-containing silane reagents have been used to detect protein-protein interactions, enzymatic targets, and protein-small molecule interactions [21].
We explored the use of protein microarrays for the highly parallel quantitation of proteins in complex mixtures. A robotic arrayer was used to print protein solutions onto the surface of a coated microscope slide in an ordered array. This array provides specific binding sites for proteins that we wish to measure in complex samples. Protein solutions to be measured are labeled by covalent linkage of a fluorescent dye to the amino groups on the proteins. The labeled solutions are placed on arrays, and specific binding interactions (for example, antibody-antigen interactions) result in localizing specific individual components of the complex mixtures to the corresponding specific spots in the array. To maximize the robustness and quantitative accuracy of the array, comparative fluorescence measurements are made, using an internal standard for each protein to be assayed. Two differentially labeled protein solutions are mixed together and then incubated with the array so that the fluorescence ratio at each spot corresponds to the concentration ratio of each protein in the two protein solutions. We characterized the performance of the protein microarrays with approximately 115 antibody/antigen pairs, using both printed arrays of antibodies to detect antigens and printed arrays of antigens to detect antibodies. To assess the applicability of this method to real-world samples, we examined protein microarray detection in various concentration ranges and background conditions.
Results
Using antibody and antigen arrays to measure variation in protein concentrations
We assembled a set of 115 antibody/antigen pairs to evaluate the use of protein microarrays for specific detection and quantitation of multiple proteins in complex mixtures. Microarrays were constructed by printing microscopic spots of either antibodies (to detect antigens) or antigens (to detect antibodies) onto a modified glass surface. The microarrays contained six to twelve spots of each antibody or antigen, about 1,100 spots all together. We performed controlled experiments to measure the specificity of binding, the accuracy and precision of quantitation, and the detection limits. Six different mixtures of the 115 antibodies and six different mixtures of 115 antigens were prepared so that the concentration of each species varied in a unique pattern across the protein mixtures over a range of three orders of magnitude. Each of the six protein mixtures was labeled with the dye Cy5 (red fluorescence) and then mixed with a Cy3-labeled (green fluorescence) 'reference' mixture containing each of the same 115 proteins at a constant concentration. The variation across the six microarrays in the red-to-green (R/G) ratio measured for each antibody or antigen spot should reflect the variation in the concentration of the corresponding binding partner in the set of mixes. By comparing the observed variation in the concentration ratios with the known variation in the concentration ratios, we could assay the performance of each antibody/antigen pair.
Six antibody arrays were used to analyze a set of six unique antigen mixes (Figure 1). Each antigen ranged in concentration from 1.6 μg/ml to 1.6 ng/ml. The concentration of each antigen in the reference mixture was 0.17 μg/ml. The inset in each panel highlights anti-Flag and anti-IgG spots, and the labels indicate the concentration of the antigen applied to each array. The images were produced by merging an image taken with the Cy3-selective filter, represented as green, with an image taken with a Cy5-selective filter, represented as red. At the highest concentration (1.6 μg/ml), the Cy5-labeled antigen was ten-fold more abundant than the Cy3-labeled antigen, and both the anti-Flag (Figure 1; panel 4) and anti-IgG (Figure 1; panel 3) spots appeared red. At progressively lower concentrations, the color of the spots appeared more yellow, and at the lowest concentration of 1.6 ng/ml (Figure 1 panel 3 for anti-Flag and Figure 1 panel 6 for anti-IgG), the spots appeared green. These color changes provided visual confirmation that the spotted antibodies specifically detected variation in concentration of their respective antigens.
Figure 1.
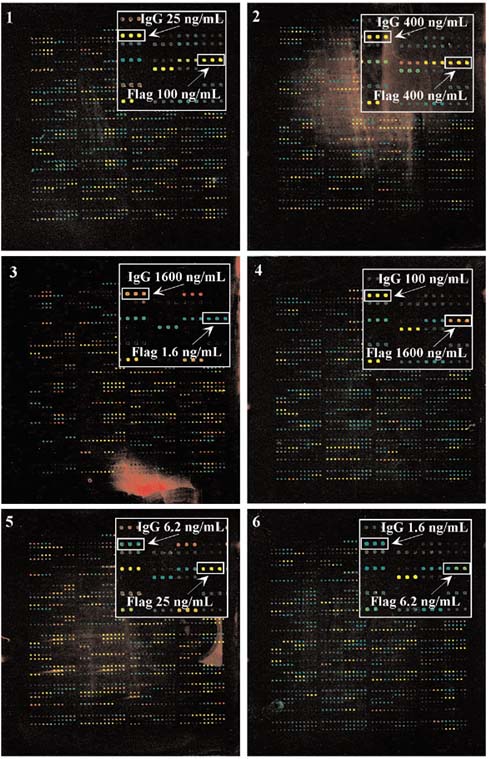
Antibody array detection of labeled antigens. 114 different antibodies were spotted onto poly-L-lysine coated slides 6-12 times each at a 375 μm spacing. Six protein mixes were labeled and detected according to the Materials and methods section. The inset in each panel highlights anti-Flag and anti-IgG spots, and the labels indicate the concentration of the antigen applied to each array. The images were normalized (see the Materials and methods section) and contrast adjusted to better show bright features.
In a complementary experiment, six different Cy5-labeled antibody mixes were compared to a constant Cy3-labeled reference antibody mix using six antigen arrays (Figure 2). The inset in each panel highlights AIM1 and Kalanin B1 spots detecting the indicated concentrations of corresponding antibody. Like the antibody spots, the color of the antigen spots varied appropriately with variation in the concentration of the corresponding binding partner, providing evidence that these spotted antigens specifically detected their respective antibodies.
Figure 2.
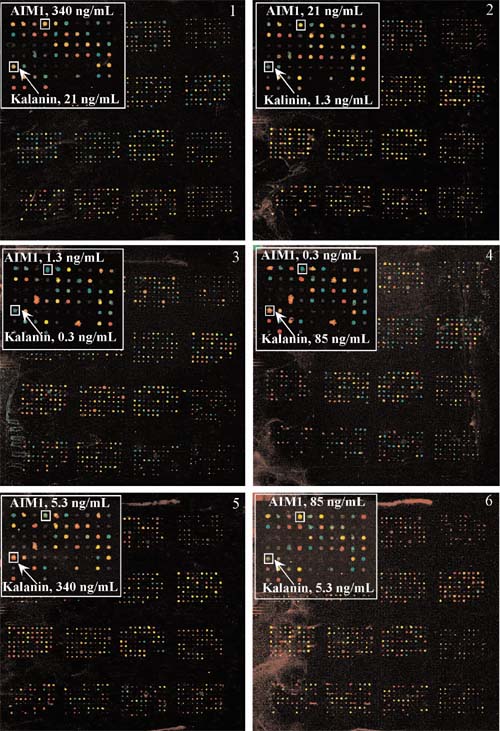
Antigen array detection of labeled antibodies. 116 different antigens were spotted with 6-12 replicates at a 375 μm spacing. Labeling, detection, and image processing were as described in Materials and methods section. The inset in each panel highlights AIM1 and Kalanin B1 spots detecting the indicated concentrations of corresponding antibody.
To assess performance more quantitatively, the log10 of the red-to-green ratio (log10(R/G)) for each antibody spot was analyzed as a function of the concentration of the cognate antigen (Figure 3). For each of the 12 antibodies depicted, the median log10(R/G) of the nine to twelve replicate spots is plotted. The error bars represent the standard deviation in the log10(R/G). The dashed lines represent the log10 of the true ratios of the antigen concentrations in the two mixes. For several of the antibodies, for example, anti-MEKK3 and anti-HCG, the results closely paralleled the ideal (dashed line) over the entire range of concentrations. Several antibodies, for example, SOD and MAP4, showed a nearly ideal response at high concentrations, but deviated from linearity at low concentrations. The plateau at low concentrations corresponds to the fluorescence signal in the Cy5 (red) channel approaching the background, indicating a detection limit of about 5 ng/ml for SOD and MAP4. For each antibody depicted in Figure 3, the R/G ratio was very similar among the replicate spots, evidenced by the small error bars. At low concentrations of cognate antigen, the ratio measured for replicate spots typically showed increased dispersion, as with anti-MEKK3 and anti-SIN, and in some cases the ratio could not be measured (that is, the Cy5 signal was below background). The complete data set, including primary images and quantitative data for all the antibodies and antigens tested, can be found at [22] and as Additional data files available with the online version of this article.
Figure 3.
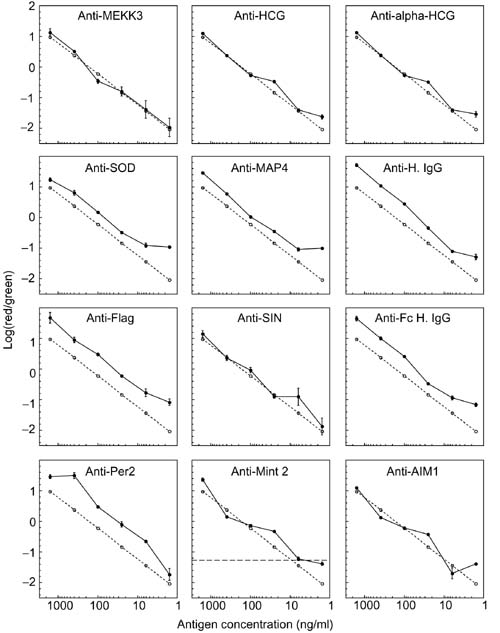
Relationship between the Cy5/Cy3 fluorescence ratios measured with antibody microarrays and the concentration ratios of the cognate antigens. The log10 of the Cy5/Cy3 fluorescence ratio was calculated for each antibody spot shown in Figure 1. The median values of the replicate measurements from 12 antibodies were plotted as a function of the concentrations of the corresponding antigens. The error bars represent the standard deviation between the replicate spots. The dashed line represents the known concentration ratio of the cognate antigen. The horizontal dashed line in the Anti-Mint2 panel represents a threshold to assess the reliability of detecting large oncentration changes (see text). It is determined by adding two standard deviations to the value measured at the final dilution.
The deviations from linearity were usually consistent among all the replicate spots. For example, all of the anti-HCG spots showed a slight positive deviation at the 25 ng/ml dilution, and all of the anti-Per2 spots showed a slight positive deviation at the 400 ng/ml dilution. For two of the antigens, HCG and Human IgG, two independent antibodies were printed, and in both cases, the deviations from linearity were highly consistent between the antibodies with the same specificity. These close ratios suggest that the errors reflect deficiencies in the preparation of the antigen solutions, such as pipetting errors or inconsistencies in the dye-labeling reaction. Additional results pointed to variation in the labeling reactions as the most likely source of variation; when we repeated an experiment using the same labeling reaction, the shape of the curve relating fluorescence ratio to concentration remained the same for each antibody/antigen pair. However, when the same antigen mixes were relabeled under slightly different conditions, the curve shape changed (data not shown). Thus variation in labeling appears to be a more important source of imprecision in the measurements than cross-reactivity of antigen/antibody pairs or dilution errors, which would be expected to be consistent among all experiments using the same antigen mix. As the protein labeling reaction is sensitive to changes in pH, local environment of reactive amines, and the concentrations of other reactive species, the efficiency of the conjugation of the dye to each protein may be variable among the proteins in each mixture in a way that varies from one labeling reaction to another. Including a diverse set of internal control proteins in the protein mixture to be labeled could provide a way to correct for this source of measurement error. Modification and careful control of the labeling reaction should lead to improvement in performance.
Many of the antibody spots that showed significant deviations from ideal performance still provided reliable qualitative or semi-quantitative measurements. For example, although the slope of the Mint2 response curve between 1,600 ng/ml and 400 ng/ml was three-fold greater than the slope of the ideal line, the fluorescence ratio varied monotonically with the concentration ratio over the entire range tested. The horizontal dashed line in the graph of the Mint2 response represents a R/G ratio two standard deviations above the value measured at the final dilution. Such a threshold is useful for defining a fluorescence ratio that would signify the presence of an antigen. All of the fluorescence ratios measured at the Mint2 spots exceeded this detection threshold when the cognate antigen was present at concentrations of 30 ng/ml or higher. Thus, this antibody could be used in a microarray format for detection and approximate quantitation of Mint2 levels above this threshold.
The performance of antigen microarrays in detecting and measuring the cognate antibodies was analyzed in a similar way (Figure 4). For many of the antigens, the experimental data very closely follow the ideal response (represented by the dashed line). For antigens such as P38 delta, Numb, and AIM-1, we obtained reproducible and accurate measurements over the entire concentration range (Figure 4). These antigens have detection limits of less than 1 ng/ml for their respective antibodies. An upward deviation from ideal was occasionally observed at the lower concentrations, as the detection limit was approached. The ratios measured at replicate spots were highly consistent and exhibited coordinated deviations from linearity, except in some cases at low concentrations where the dispersion appeared more random (for example, G3BP and ARNT1).
Figure 4.
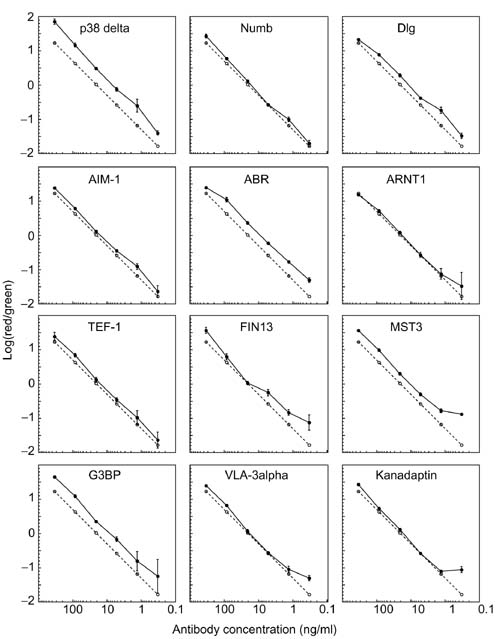
Relationship between the Cy5/Cy3 fluorescence ratios measured using antigen microarrays and the concentration ratio of the cognate antibodies. The median of the log10 transformed Cy5/Cy3 fluorescence ratios of the indicated antigens from Figure 2 were plotted as a function of concentration ratio, as in Figure 3. Median values from the replicate spots are presented along with the concentration ratio of the cognate antibody, represented by the dashed line. The error bars represent the standard deviation between the replicate spots.
To summarize the overall performance of the protein arrays for the 115 antibody/antigen pairs used in this study, the number of antibodies and antigens that met certain criteria for qualitative and quantitative performance are represented in Figure 5 as a function of the concentration of the target protein in a complex solution. The standard for qualitative measurement accuracy was defined as described above for the example of Mint2. An antibody or antigen was considered to perform satisfactorily for qualitative measurement at a specified concentration if the R/G ratio measured at 100% of the replicate spots exceeded the threshold whenever the target protein was present at or above the specified concentration. The fraction of the 115 antibodies and antigens that satisfied this standard for qualitative measurement was plotted as a function of analyte concentration (Figure 5a). Over 60% of the arrayed antibodies and over 80% of the arrayed antigens met the criteria at the highest analyte concentration tested (1.6 μg/ml and 340 ng/ml, respectively), and both percentages decreased with decreasing analyte concentration. The performance of the antigen microarrays was better than that of the antibody microarrays over the entire concentration range.
Figure 5.
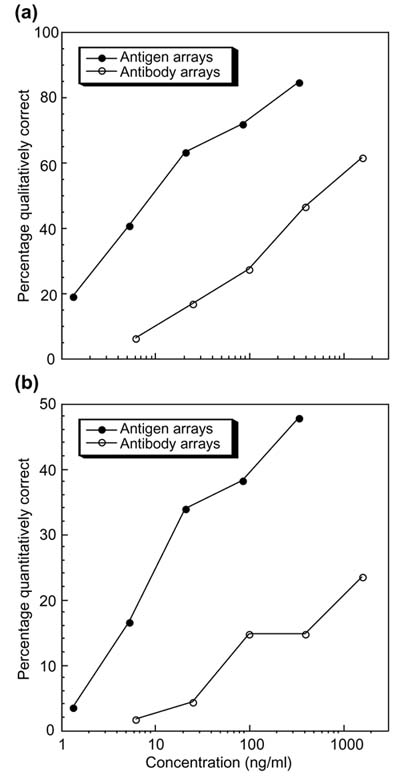
(a) Percentage of antibodies and antigens yielding qualitatively correct results as a function of analyte concentration. An antibody or antigen was determined to yield qualitatively correct results if 100% of the replicate spots at or above a given concentration segregated above a low concentration threshold. The low concentration threshold was calculated by averaging the Cy5/Cy3 fluorescence ratio measured at the lowest tested concentration of the target antibody or antigen and adding two times the standard deviation of the ratio measured at the cognate spots. (T = X + 2S, where T = the threshold, X = the average, and S = the standard deviation.) (b) Percentage of antibodies or antigens yielding quantitatively correct results versus concentration. An antibody or antigen measurement was considered quantitatively accurate if it both fulfilled the criteria for qualitative accuracy in (a) and in addition, the measured R/G ratio fell within a factor of two of the known concentration ratio.
Similarly, we plotted the percentage of antibodies and antigens that provided satisfactory quantitative accuracy as a function of analyte concentration (Figure 5b). Detection was considered quantitatively accurate if the above criterion for qualitative accuracy was fulfilled and the median R/G ratio was within a factor of two of the known concentration ratio. Nearly half of the antigens provided quantitatively accurate measurements at concentrations above 100 ng/ml, and the percentage decreased with decreasing antibody concentration. A smaller fraction of the tested antibodies gave accurate quantitation of soluble antigen. (See the web supplement [22] and Additional data files available with this article for quantitative data on the entire antibody/antigen set.)
We believe that the differences in the performance of the antibody and antigen arrays are likely to be explained by differences in dye labeling and protein stability. Antibodies of varying specificities all have very similar overall structures, and all antibodies irrespective of specificity can be labeled with the NHS-activated dyes at lysine residues in the Fc region. In contrast, many antigen proteins do not have easily accessible amines. Inefficient, highly variable, or non-existent labeling may explain the 30-40% fewer antigen-antibody pairs that performed satisfactorily in qualitative detection in the antibody microarray format, as compared to the antigen microarray format. Antibodies are also relatively stable proteins, and their greater stability in solution, relative to their cognate antigens, may also contribute to the better performance of the antigen arrays.
Background effects and detection limits
Because the background signal from non-specific adsorption of labeled protein increases with increasing protein concentration, the detection of a specific target protein is limited not only by its concentration, but also by the concentration of the non-cognate proteins in the mixture. We therefore investigated the effect of protein background on quantitation, by adding varying concentrations of fetal calf serum (FCS) to the set of six antigen mixes, increasing the overall protein concentrations by 10-fold and 100-fold before labeling and detection (Figure 6). The images at the top of Figure 6 show details from one array in each set. The background fluorescence was about ten-fold higher at the higher protein concentration. The spots in the right image are much less clear against the high background, but the fluorescent signals are still measurable. Higher overall protein concentrations significantly reduced the precision of the measurements of specific proteins, presumably because of either the increased complexity of the mixture or the higher background. For example, the anti-Flag spots showed good quantitation of Flag-tagged Bacterial Alkaline Phosphatase (Flag-BAP) down to an absolute concentration of 1 ng/ml and a partial concentration of 10-6, when measured in solution at a total protein concentration of 600 μg/ml. In a 6,000 μg/ml protein solution the data were very noisy below approximately 100 ng/ml Flag-BAP. Likewise, anti-SOD and anti-HCG showed increased dispersion and decreased linearity when measured in a higher total protein concentration. Higher background at higher protein concentrations is probably the major cause of the diminished performance, since at equivalent partial concentrations the measurements were noisier at higher absolute protein concentrations. For example, at a partial concentration of 4 × 10⁻⁵ the measurements of SOD were very noisy in the high-serum samples, but remained closely correlated with the ideal response in the lower-serum samples. We conclude from this experiment that antibody microarrays can allow detection of a specific target protein at concentrations below 1 ng/ml and partial concentrations below 10-6. At least for the present, however, the total protein concentration in a sample to be analyzed using this system should be less than 1 mg/ml for optimal performance. A reduction in background through improved blocking of non-specific adsorption should further lower the detection limits.
Figure 6.
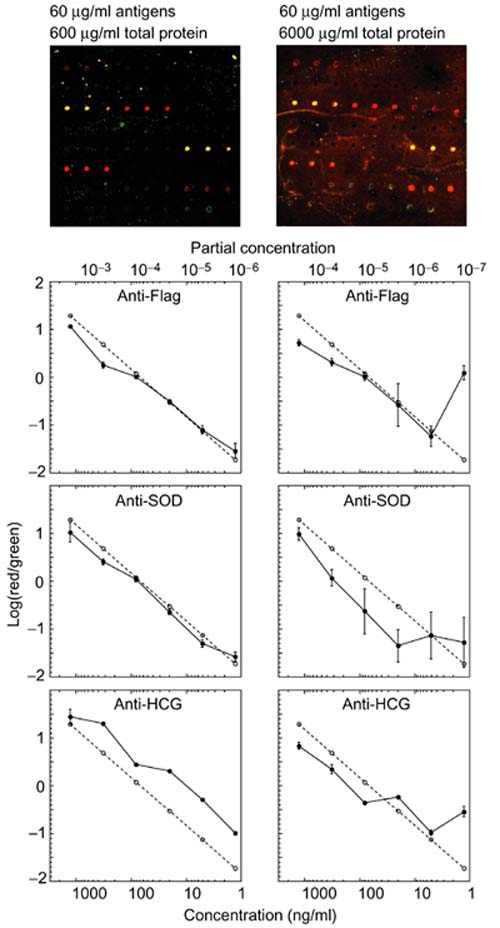
The effect of protein concentration on background and detection limits. Six antigen mixes were added to fetal calf serum (FCS) solutions to produce a 10-fold and 100-fold increase in total protein concentration and a corresponding decrease in partial concentration of the antigens. After labeling, the mixes were analyzed with antibody microarrays. The images at the top of the figure present a detail from one of the arrays in each set. The median log10 of the Cy5/Cy3 fluorescence ratio is plotted as a function of the concentration ratio of the cognate antigen of the three indicated antibodies. The dashed line represents the log10 of the true ratio of antigen concentrations in the Cy5-labeled and Cy3-labeled solutions.
We also investigated the detection limits using the antigen arrays (Figure 7). The six antibody mixes were added to either a 10-fold or a 100-fold excess (by total protein mass) of FCS. The high-concentration set was diluted 10-fold, so that the total protein concentration was equivalent in the two sets of protein mixtures. The images at the top of Figure 7 show a detail of a microarray from the analysis of each set. The background is very similar between the images, but the fluorescence intensity of the spots is greatly reduced as the partial and absolute concentration of the cognate antibodies decreases. The graphs below the left image all show good linearity down to 0.3 ng/ml and a 3 × 10⁻⁶ partial concentration. The graphs on the right of Figure 7 show similar performance at similar partial concentrations, but more noise at the lowest concentration, where the specific fluorescence signals were low. The level of performance depicted here is representative of about 20 (18%) of the antibody/antigen pairs tested. We conclude from this experiment that detection down to concentrations of 0.1 ng/ml and partial concentrations of 10-6 is possible using antigen arrays. Reduction of total protein concentration below approximately 100 μg/ml did not improve the signal-to-noise ratio.
Figure 7.
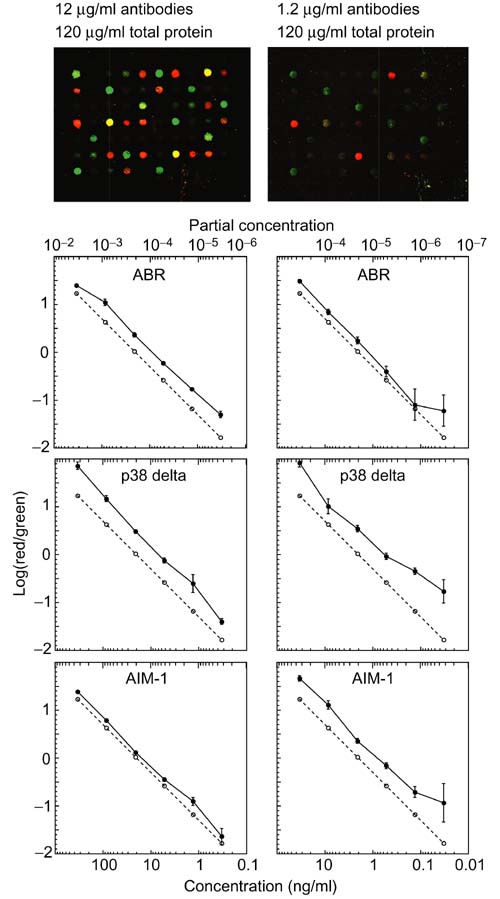
Investigation of partial concentration and absolute concentration detection limits. Six antibody mixes were added to FCS solutions to produce a 10-fold and 100-fold increase in total protein concentration and a corresponding decrease in partial concentration. The high protein solution was diluted 10-fold, so that the total protein concentration was equivalent between the mixes. The images at the top of the figure present a detail from one of the arrays in each set. The median log10 Cy5/Cy3 fluorescence ratio is plotted as a function of cognate antibody for the three indicated antigens. The dashed line represents the log10 of the true ratio of antigen concentrations in the Cy5-labeled and Cy3-labeled solutions.
Discussion
We have shown that a simple microarray assay, using comparative fluorescence, allows simultaneous detection and quantitation of multiple proteins in a miniaturized, low-sample consumption format. Microarrays of antigens allowed detection and quantitation of specific antibodies down to partial concentrations of less than 10-6 and absolute concentrations of 100 pg/ml. Microarrays of antibodies allowed detection and quantitation of cognate antigens at concentrations as low as 1 ng/ml and partial concentrations of 10-6. In comparison to other high-throughput protein detection methods, particularly two-dimensional gel electrophoresis, the detection limit of protein microarrays compares favorably. Around 1 ng of any protein is required for detection on a two-dimensional gel [1]. Several antibodies on the microarray had detection limits around 1 ng/ml, corresponding to an absolute detection limit of only 20 pg of protein, in the 20 μl probe volume.
Our results suggest directions for further improvement of the accuracy in quantitation, such as the inclusion of internal calibration proteins to control for variation in fluorescent labeling, and the adjustment of dye labeling conditions to reduce the variation. The detection limits are likely to be improved by better passivation of the array surface, by using antibodies with higher affinities, and by reducing the complexity of the protein solution through fractionation. The antibodies we used in this analysis were not optimized for affinity and specificity. Antibodies used in clinical diagnostic applications are commonly selected for affinities orders of magnitude higher than those of the research-grade antibodies we used in this pilot study. The use of clinical-grade high-affinity antibodies in this format would presumably allow a corresponding increase in sensitivity.
Many of the tested antibody/antigen pairs allowed parallel detection of proteins in a microarray format at concentrations suitable for measurement of clinically important proteins in patient samples. For example, concentrations of 15 μg/ml, 5 μg/ml, and 35 μg/ml are routinely used as threshold prognostic values for the breast cancer markers c-erbB-2, CEA, and CA 15.3, respectively [23]. The partial concentration of a protein at 20 μg/ml in the blood serum, using an average total protein concentration of 60 mg/ml, is 3 × 10⁻⁴, within the range of 25% of the antibodies tested and 70% of the antigens tested. The prostate cancer marker prostate specific antigen (PSA) is clinically useful in the 10-20 ng/ml range [24], or a partial concentration of 3 × 10⁻⁷. The best antibody/antigen pairs tested had detection limits in this range. The prospects for clinical application of antigen microarrays in monitoring antibody response to immunization, infection, or other disorders, are extremely promising. A natural immune response typically yields specific IgG concentrations ranging from approximately 10 ng/ml [25] to over 3 μg/ml, [26] well within the detection limits most of the antigens tested.
In conclusion, these experiments demonstrate that a comparative fluorescence assay using microarrays of antibodies and antigens can provide a practical approach to specific, quantitative, and highly parallel detection of proteins at physiologically relevant concentrations.
Materials and methods
Preparation of arrays
Ninety-four antibody/antigen pairs were provided by BD Transduction Laboratories (Cincinnati, OH), six pairs were provided by Research Genetics (Huntsville, AL), and 15 pairs were purchased from Sigma Chemical. Antibodies and antigens that were provided in glycerol solutions were transferred to a glycerol-free, phosphate-buffered saline (PBS) solution (137 mM NaCl, 2.7 mM KCl, 4.3 mM Na2HPO4, 1.4 mM KH2PO4, pH 7.4) using a BioRad Biospin P6 column. Antibody and antigen solutions were prepared at 0.1-0.3 mg/ml in 384-well plates, using approximately 4 μl per well. A robotic arrayer spotted the protein solutions in an ordered array onto poly-L-lysine coated microscope slides at a 375 μm spacing using 16 steel tips. The coated slides were prepared as previously reported [27] or purchased from CEL Associates (Houston, TX). Briefly, glass microscope slides were cleaned in 2.5 M NaOH for 2 h, rinsed thoroughly in ultra-pure H2O, soaked for 1 hour in a 3% poly-L-lysine solution in PBS, rinsed in ultra-pure H2O, spun dry, and further dried for 1 h at 80°C in a vacuum oven. The resulting microarrays were sealed in a slide box and stored at 4°C. The location of the array of spots was delineated on the back sides of the arrays with a diamond scribe (the spots disappear after washing). The arrays were rinsed briefly in a 3% non-fat milk/PBS/0.1% Tween-20 solution to remove unbound protein. They were transferred immediately to a 3% non-fat milk/PBS/0.02% sodium azide blocking solution and allowed to sit overnight at 4°C. The milk solution had been first spun for 10 min at 10,000 × g to remove particulate matter. Excess milk was removed in three room temperature PBS washes of 1 min each, and the arrays remained in the final wash until application of the probe solution (see below).
Preparation of protein solutions
Protein solutions and NHS-ester activated Cy3 and Cy5 solutions (Amersham PA23001 and PA25001) were prepared in a 0.1 M pH 8.0 sodium carbonate buffer. The protein and dye solutions were mixed together so that the final protein concentration was 0.2-2 mg/ml and the final dye concentration was 100-300 μM. Normally approximately 15 μg protein was labeled per array. The reactions were allowed to sit in the dark for 45 min and then quenched by the addition of a tenth volume 1 M pH 8 Tris base (a 500-fold molar excess of quencher). The reaction solutions were brought to 0.5 ml with PBS and then loaded into microconcentrator spin columns (Amicon Microcon 10) with a 10,000 Da molecular weight cutoff. After centrifugation to reduce the volume to approximately 10 μl (approximately 20 min), a 3% non-fat milk blocking solution was added to each Cy5-labeled solution such that 25 μl milk was added for each array to be generated from the mix. (The milk had been first spun down as above.) The volume was again brought to 0.5 ml with PBS and the sample again centrifuged to ~10 μl. The Cy3-labeled reference mix was divided equally among the Cy5-labeled mixes, and PBS was added to each to achieve 25 μl for each array. Finally, the mixes were filtered with a 0.45 μm spin filter (Millipore) by centrifugation at 10,000 × g for 2 min.
Detection
Each microarray was removed individually from the PBS wash (see above), and excess liquid was shaken off. Without allowing the array to dry, 25 μl dye-labeled protein solution was applied to the surface within the marked boundaries. A 24 × 30 mm cover slip was placed over the solution. The arrays were sealed in a chamber with an under-layer of PBS to provide humidification, after which they sat at 4°C for 2 h. The arrays were dunked briefly in PBS to remove the protein solution and the cover slip, and they were then allowed to rock gently in PBS/0.1% Tween-20 solution for 20 min. The arrays were then washed twice in PBS for 5-10 min each and twice in H2O for 5-10 min each. All washes were at room temperature. After spinning to dryness in a clinical centrifuge equipped with plate carriers (Beckman), the arrays were scanned in an Axon Laboratories (Palo Alto, CA) scanner using 532 nm and 635 nm lasers.
Analysis
The relative concentration of each protein in two separate dye-labeled pools was determined by comparing the fluorescence intensities in the Cy3- and Cy5-specific channels at each spot. The location of each analyte spot on the array was outlined using the gridding software GenePix (Axon Laboratories, Palo Alto, CA) and ScanAlyze [28]. The background, calculated as the median of pixel intensities from the local area around each spot, was subtracted from the average pixel intensity within each spot. The background-subtracted values in the red channel were multiplied by a normalization factor to correct for detection differences in the two channels. The normalization factor was found by comparing the red/green ratios of three to four well-behaved antibodies or antigens, which served as internal standards, to the ratio of the known concentrations. A factor was calculated which, when multiplied with the signal in the red channel, minimized the difference between the ideal and observed red/green ratios. A separate normalization factor was calculated for each array. To normalize the ratios for the antigens or antibodies that were used in calculating the factor, a separate factor was used in which that particular antibody or antigen was dropped from the calculation (that is, a spot was never used to normalize itself). Finally, the ratios of the background-subtracted, normalized signal intensities were calculated to estimate the relative concentrations between proteins in the separately labeled pools.
Additional data
Additional data files available with the online version of this article include Excel files of quantitative data of the whole antibody/antigen data set [22].
The following data are available:
Normalization factors and protein concentrations used
Raw data and analysis for antibody arrays in figures 1, 3, and 5
Raw data and analysis for antigen arrays in figures 2, 4, 5, and 7
Accuracy tabulations for figure 5
Raw data and analysis for figure 6
Raw data and analysis for figure 6 (continued)
Antibody information from Transduction Labs, including catalog numbers, performance in other assays, and subcellular location of antigens
Supplementary Material
Normalization factors and protein concentrations used.
Raw data and analysis for antibody arrays in figures 1, 3, and 5.
Raw data and analysis for antibody arrays in figures 2, 4, 5, and 7.
Accuracy tabulations for figure 5.
Raw data and analysis for figure 6.
Raw data and analysis for figure 6 (continued).
Additional data for figure 7.
Antibody information from Transduction Labs, including catalog numbers, performance in other assays, and subcellular location of antigens.
Acknowledgments
Acknowledgements
We thank B.D. Transduction Labs and Research Genetics for the gifts of the antibodies and antigens. We thank the members of the Brown and Botstein labs for helpful interactions and advice. B.H. was supported by a postdoctoral research grant from the Van Andel Institute. M.D. is a Howard Hughes Medical Institute Predoctoral Fellow and a Stanford Graduate Fellow. P.O.B. is an associate investigator of the Howard Hughes Medical Institute. This work was supported by grant CA85129 from the NCI, grant N65236-99-1-5428 from DARPA, and by the Howard Hughes Medical Institute.
References
- Abbott A. A post-genomic challenge: learning to read patterns of protein synthesis. Nature. 1999;402:715–720. doi: 10.1038/45350. [DOI] [PubMed] [Google Scholar]
- Humphery-Smith I, Blackstock W. Proteome analysis: genomics via the output rather than the input code. J Protein Chem. 1997;16:537–544. doi: 10.1023/a:1026330015280. [DOI] [PubMed] [Google Scholar]
- Emmert-Buck MR, Gillespie JW, Paweletz CP, Ornstein DK, Basrur V, Appella E, Quan-Hong W, Huang J, Hu N, Taylor P, et al. An approach to proteomic analysis of human tumors. Mol Carcinog. 2000;27:158–165. [PubMed] [Google Scholar]
- Pandey A, Mann M. Proteomics to study genes and genomes. Nature. 2000;405:837–846. doi: 10.1038/35015709. [DOI] [PubMed] [Google Scholar]
- Rabilloud T. Detecting proteins separated by 2-D gel electrophoresis. Anal Chem. 2000;72:48A–55A. doi: 10.1021/ac002709u. [DOI] [PubMed] [Google Scholar]
- Patterson SD, Aebersold R. Mass spectrometric approaches for the identfication of gel-separated proteins. Electrophoresis. 1995;16:1791–1814. doi: 10.1002/elps.11501601299. [DOI] [PubMed] [Google Scholar]
- Khan J, Bittner ML, Chen Y, Meltzer PS, Trent JM. DNA microarray technology: the anticipated impact on the study of human disease. Biochim Biophys Acta. 1999;1423:M17–M28. doi: 10.1016/s0304-419x(99)00004-9. [DOI] [PubMed] [Google Scholar]
- DeRisi J, Penland L, Brown PO, Bittner ML, Meltzer PS, Ray M, Chen Y, Su YA, Trent JM. Use of a cDNA microarray to analyse gene expression patterns in human cancer. Nat Genet. 1996;14:457–460. doi: 10.1038/ng1296-457. [DOI] [PubMed] [Google Scholar]
- Debouck C, Goodfellow PN. DNA microarrays in drug discovery and development. Nat Genet. 1999;21:48–50. doi: 10.1038/4475. [DOI] [PubMed] [Google Scholar]
- Geysen HM, Meloen RH, Barteling SJ. Use of peptide synthesis to probe viral antigens for epitopes to a resolution of a single amino acid. Proc Natl Acad Sci USA. 1984;81:3998–4002. doi: 10.1073/pnas.81.13.3998. [DOI] [PMC free article] [PubMed] [Google Scholar]
- Frank R. Spot synthesis: an easy technique for the positionally addressable, parallel chemical synthesis on a membrane support. Tetrahedron. 1992;48:217–9232. [Google Scholar]
- Buessow K, Cahill D, Nietfeld W, Bancroft D, Scherzinger E, Lehrach H, Walter G. A method for global protein expression and antibody screening on high-density filters of an arrayed cDNA library. Nucleic Acids Res. 1998;26:5007–5008. doi: 10.1093/nar/26.21.5007. [DOI] [PMC free article] [PubMed] [Google Scholar]
- Lueking A, Horn M, Eickhoff H, Buessow K, Lehrach H, Walter G. Protein microarrays for gene expression and antibody screening. Anal Biochem. 1999;270:103–111. doi: 10.1006/abio.1999.4063. [DOI] [PubMed] [Google Scholar]
- Buessow K, Nordhoff E, Luebbert C, Lehrach H, Walter G. A human cDNA library for high-throughput protein expression screening. Genomics. 2000;65:1–8. doi: 10.1006/geno.2000.6141. [DOI] [PubMed] [Google Scholar]
- Ge H. UPA, a universal protein array system for quantitative detection of protein-protein, protein-DNA, protein-RNA and protein-ligand interactions. Nucleic Acids Res. 2000;28:e3. doi: 10.1093/nar/28.2.e3. [DOI] [PMC free article] [PubMed] [Google Scholar]
- de Wildt RMT, Mundy CR, Gorick BD, Tomlinson IM. Antibody arrays for high-throughput screening of antibody-antigen interactions. Nat Biotech. 2000;18:989–994. doi: 10.1038/79494. [DOI] [PubMed] [Google Scholar]
- Rowe CA, Scruggs SB, Feldstein MJ, Golden JP, Ligler FS. An array immunosensor for simultaneous detection of clinical analytes. Anal Chem. 1999;71:433–439. doi: 10.1021/ac980798t. [DOI] [PubMed] [Google Scholar]
- Mendoza LG, McQuary P, Mongan A, Gangadharan R, Brignac S, Eggers M. High-throughput microarray-based enzyme-linked immunosorbent assay (ELISA). Biotechniques. 1999;27:778–788. doi: 10.2144/99274rr01. [DOI] [PubMed] [Google Scholar]
- Silzel JW, Cercek B, Dodson C, Tsay T, Obremski RJ. Mass-sensing, multianalyte microarray immunoassay with imaging detection. Clin Chem. 1998;44:2036–2043. [PubMed] [Google Scholar]
- Arenkov P, Kukhtin A, Gemmell A, Voloshchuk S, Chupeeva V, Mirzabekov A. Protein microchips: use for immunoassay and enzymatic reactions. Anal Biochem. 2000;278:123–131. doi: 10.1006/abio.1999.4363. [DOI] [PubMed] [Google Scholar]
- MacBeath G, Schreiber SL. Printing proteins as microarrays for high-throughput function determination. Science. 2000;289:1760–1763. doi: 10.1126/science.289.5485.1760. [DOI] [PubMed] [Google Scholar]
- Protein microarrays for highly parallel detection and quantitation of specific proteins and antibodies in complex solutions http://genome-www.stanford.edu/proteinarrays/ [DOI] [PMC free article] [PubMed]
- Molina R, Jo J, Filella X, Zanon G, Pahisa J, Munoz M, Farrus B, Latre ML, Escriche C, Estape J, Ballesta AM. c-erbB-2 oncoprotein, CEA, and CA 15.3 in patients with breast cancer: prognostic value. Breast Cancer Res Treat. 1998;51:109–119. doi: 10.1023/a:1005734429304. [DOI] [PubMed] [Google Scholar]
- Kardamakis D. Tumour serum markers: clinical and economical aspects. Anticancer Res. 1996;16:2285–2288. [PubMed] [Google Scholar]
- Anthony BJ, Concepcion IE, Concepcion NF, Vadheim CM, Tiwari J. Relation between maternal age and serum concentration of IgG antibody to type III group B streptococci. J Infect Dis. 1994;170:717–720. doi: 10.1093/infdis/170.3.717. [DOI] [PubMed] [Google Scholar]
- Granoff dM, Shackelford PG, Suarez BK, Nahm MH, Cates KL, Murphy TV, Karasic R, Osterholm MT, Pandey JP, Daum RS. Hemophilus influenzae type B disease in children vaccinated with type B polysaccharide vaccine. New Engl J Med. 1986;315:1584–1590. doi: 10.1056/NEJM198612183152505. [DOI] [PubMed] [Google Scholar]
- Eisen MB, Brown PO. DNA arrays for analysis of gene expression. Methods Enzymol. 1999;303:179–205. doi: 10.1016/s0076-6879(99)03014-1. [DOI] [PubMed] [Google Scholar]
- Stanford Microarray Database http://genome-www4.stanford.edu/MicroArray/SMD/
Associated Data
This section collects any data citations, data availability statements, or supplementary materials included in this article.
Supplementary Materials
Normalization factors and protein concentrations used.
Raw data and analysis for antibody arrays in figures 1, 3, and 5.
Raw data and analysis for antibody arrays in figures 2, 4, 5, and 7.
Accuracy tabulations for figure 5.
Raw data and analysis for figure 6.
Raw data and analysis for figure 6 (continued).
Additional data for figure 7.
Antibody information from Transduction Labs, including catalog numbers, performance in other assays, and subcellular location of antigens.


