Abstract
Introduction: Thousands of people work and perform everyday in high altitude environment, either as pilots, or shift workers, or mountaineers.
The problem is that most of the accidents in this environment have been attributed to human error. The objective of this study was to assess complex cognitive performance as it interacts with respiratory insufficiency at altitudes of 8000 feet and identify the potential effect of hypoxia on safe performance.
Methods: Twenty subjects participated in the study, divided in two groups: Group I with mild asymptomatic chronic obstructive pulmonary disease (COPD), and Group II with normal respiratory function. Altitude was simulated at 8000 ft. using gas mixtures.
Results: Individuals with mild COPD experienced notable hypoxemia with significant performance decrements and increased number of errors at cabin altitude, compared to normal subjects, whereas their blood pressure significantly increased.
Keywords: Chronic obstructive pulmonary disease (COPD), Cognitive Performance, Hypoxia, Blood pressure, Human error
A considerable number of adult populations are affected by chronic obstructive pulmonary disease (COPD) and as it is known with significant effects on cognitive performance1,2. More precisely it has been estimated that 16 million patients in the U.S. have been diagnosed with some form of COPD and as many as 16 million more are undiagnosed3. Chronic obstructive pulmonary disease (COPD) is the fourth leading cause of death in the United States and nearly 112,584 Americans died of COPD in 19984. For the healthy individuals, Crow and Kelman noted that relatively small reductions in arterial oxygen saturation could significantly impair mental and motor coordination, personality, and judgment5. The degree of impairment due to hypoxia increases with altitude6. This is of special concern when a person is in a potential dangerous situation (e.g. pilots in general aviation, workers in altitude) especially when lives continue to be lost disproportionately in aviation crashes when compared to other causes of accidental death7. Hypoxia-induced irritability can potentially cause some passengers also to become combative and interfere with flight crew. Healthy individuals are capable to tolerate the decrease of pO2 at 2,438m (8,000 ft), similar to the commercial flight altitude8 without difficulty, because of the oxyhemoglobin curve and their compensatory mechanisms such as an increase in respiratory and heart rate. Individuals though with compromised circulatory and/or pulmonary function may experience hypoxemia5,8,9.
COPD and altitude hypoxia especially for general aviation could be part of the factors, which are not well understood so far (NTSB reported, that between 1980 and 1989, 80% of fatalities were attributed to general aviation activities). Human error is the largest single cause of accidental deaths in general aviation10 and has been found to cause or contribute to most aviation accidents with various authors estimating that between 50% and 80% of mishaps involving pilot error11,12.
Our study was based on the hypothesis that COPD patients are more prone to errors in flight altitude during demanding performance tasks.
The objective of this study was to extend our current understanding of hypoxic effects in healthy population to those with compromised physiological systems by directly comparing healthy and diseased population and continuous monitoring all peripheral measurements, which might reflect the response of compensatory mechanisms to hypoxia, and enable us to detect and early recognize the aviator at risk.
Material and Methods
Subjects and criteria
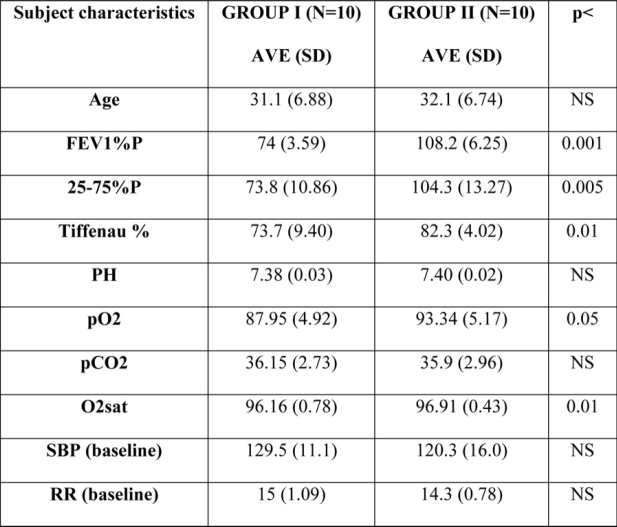
Twenty right handed volunteers, regular computer and joystick users, aged between 20 and 40 years, men and women, most of them private pilots, participated in this study. The subjects were medically screened. They had normal or corrected to normal vision. The requirements for the subjects to be included in the study were the following: right-handed, regular computer and joystick users, aged between 20 and 40 years, healthy with normal or corrected to normal vision. The criteria for exclusion from the study were any other pulmonary disease or history of cardiovascular or cerebrovascular diseases, metabolic diseases or any other derangement to influence cognitive performance. After they signed the consent forms and were evaluated according to the participation requirements, they were divided in two groups: the first group (Group I) consisted of ten subjects with mild asymptomatic chronic obstructive pulmonary disease (COPD), with FEV1: 65% to 79%, and the second group (Group II) also consisted of ten subjects of approximately the same age and sex, but with normal respiratory function (Table 1).
Table 1: All relevant subject characteristics, including t-tests for both groups.
Altitude simulation procedure
The study was performed in three different environmental conditions: under ambient air (21% oxygen and 78% nitrogen), under hypoxia, while breathing a hypoxic breathing gas mixture (17.2% oxygen and 82.8% nitrogen), and under recovery with 100% oxygen. Oxygen and hypoxic breathing gas mixture were administered through a special well sealed mask connected to a flight helmet and placed on the face of the subject to prevent oxygen leakage.
Performance task
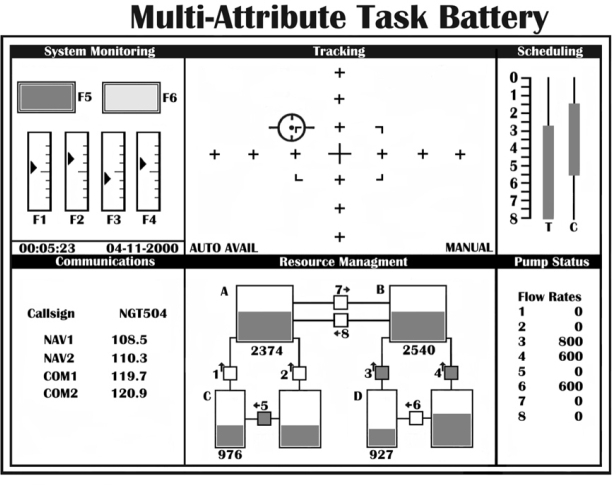
For the assessment of performance, an electronic flight simulation program (MATB – a PC based Multiple Attribute Task Battery) was used developed by Comstock and Arnegard (1992) at NASA Langley Research Center (Figure 1). It is a multitask flight simulation package with components monitoring, tracking, communications and fuel management tasks. The battery incorporates tasks analogous to activities that aircraft crewmembers perform in flight, while providing a high degree of experimenter control, performance data on each subtask, and freedom to use non-pilot test subjects. Each performance session lasted 16 minutes.
Figure 1: Multi-attribute Task Battery (MATB) screenshot.
The demands of manual control were simulated by the tracking task located in the upper middle window (Figure 1). Using the joystick, the subjects task was to keep the target in the center of the window, within the dotted lines, which form a rectangle. If no control input was applied, the aircraft symbol drifted away from the center toward the edges of the window. This task has been proven to be sensitive to hypoxia13
The second task that subjects were asked to perform simultaneously with tracking was the system monitoring presented at the upper-left window of figure 1. This was consisted of two different subsystems, that of the lights and the subsystem of the gauges.
The subsystem of the lights represented aircraft functioning as well as emergencies and consisted of two type of lights; green light for "OK" and red light for "WARNING . The light on the left was normally "on" as indicated by a green area. The subject was required to detect the absence of this light and press the "F5" key when the light went out. The light on the right was normally "off". When this became red the subject's task was to respond by pressing the "F6" key. If the subject did not detect either abnormality, the situation reverted to normal status after a selected timeout period.
The second subsystem of monitoring consisted of four vertical gauges with moving pointers. The scales for the gauges were marked to indicate the temperature (TEMP1, TEMP2) and pressure (PRES1, PRES2) of the two aircraft engines and the pointers were moving around the center of the gauge within a fixed range (one line below and one line above the center). When a system malfunction occurred, the pointer on one of the four engine gauges went "off limits". That is, independently and at random intervals the pointer shifted its center position away from the middle of the vertical gauge regardless of direction. The operator was responsible for detecting the pointer shifts and responds by pressing one of the corresponding function keys (T1, T2, P1, or P2). If the subject failed to detect a malfunction, the fault was automatically corrected 10 sec after the malfunction occurred and the response data was scored as miss.
During the performance task, MATB scores were recorded at text files as well as the Root Mean Square Error (RMSE), which indicated the distance of the target from the center of the window.
Phases of the study
Phase 1: The study was carried out in three phases: During the first phase, the subjects were undergoing a series of laboratory tests and spent time becoming familiar with the PC-based flight simulator and the joystick.
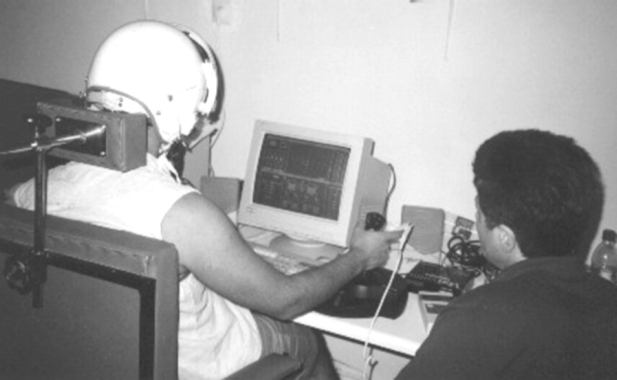
Phase 2: During the second phase, the two-week training of the subjects was completed with a minimum of 20 sessions, required to achieve asymptotic performance (i.e. their performance plateau) establishing thus their personal comparative basis (baseline). During the sessions, the mask was applied to familiarize subjects with instrumentation procedure. While training, subjects were seated in a shielded testing booth containing a response keypad and a tracking control joystick (Figure 2). Written instructions explaining to the subject how to initialize the task in the computer were also provided.
Figure 2: The subject, performing the cognitive task, connected to the recording equipment, with the electro-Cap for EEG measurements.
Phase 3: In the third phase, the subjects were executing the flight simulation program (MATB), while all the parameters were recorded.
Recordings
1) Root mean square error for the tracking task, as well as number of errors in dials and lights made by the subjects under stress conditions (cognitive performance) in the multitask environment of the flight simulation, 2) blood gas analysis, using an IRMA portable blood gas analyzer, Philips Medical Systems, MA, and transcutaneous oxygen and carbon dioxide partial pressure by using non invasive monitoring system TINATM TCM III, Radiometer America, Inc, OH, 3) their heart rate by using MP 100, Biopack Systems, Inc., CA, 4) their arterial blood pressure by using a wall model mercurial manometer, American Diagnostic Corporation (ADC), and 5) their respiratory rate and amplitude by using Respitrace (Non- Invasive Monitoring Systems, Inc., FL).
For the recording of heart rate electrodes were attached to the upper and lower part of the sternum. Interelectrode impedance of less than 5,000 ohms was achieved to reduce extraneous noise.
Statistics
All the data were averaged in 16 min means. The effect of time within the 16 minutes was also determined by averaging 4 minutes epochs for the duration of 16-minute run at each environmental condition.
The statistical tests employed were 2 groups by 3 conditions mixed models analysis of Variance with groups and condition as factor, with Tuckey's / Bonferroni post hoc analysis for homogenous subsets. In order to examine the time effect we averaged the 30 sec means into 4-minute epochs and we performed 2 conditions by 4 epochs ANOVA using Greenhouse-Geyser and Huyn-Feldt corrections. These tests used an error a=0.05 to help control for the experiment wise error. Paired t-test as well as oneway analysis of variance was also performed to compare oxygen with hypoxic and recovery conditions within the individuals in the same group. A one way ANOVA was conducted on the epoch data We also calculated change scores by subtracting sea level performance from hypoxic gas exposure performance and then we conducted unpaired t test between COPD and normal groups.
Results
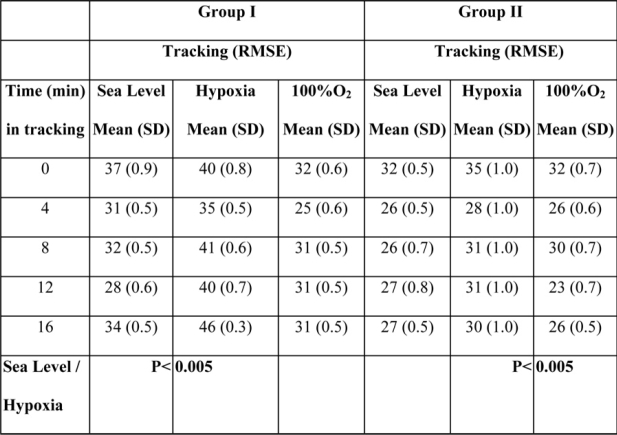
Paired t-test as well as one-way analysis of variance was performed to compare oxygen with hypoxic and recovery conditions within the individuals in the same group. A statistically significant decrease in performance was revealed in both groups, in tracking and number of errors in dials and lights under hypoxic conditions when compared to those that occurred at sea level. Particularly comparing oxygen to hypoxic condition in group I, there was a statistically significant increase of RMSE and consequently decrease in performance in hypoxic conditions (p<0.005, SD=0.41, SEM=0.13, t=-62.51, df=9). Comparing RMSE of hypoxic to recovery conditions there was also a statistically significant decrease with an increase of performance in recovery conditions (p<0.005, SD=0.36, SEM=0.11, t=86.60, df=9). There was no statistically significant difference between oxygen and recovery conditions for tracking (Figure 3). For group II, there was also a statistically significant increase in RMSE comparing oxygen to hypoxic ((p<0.005, SD=0.48, SEM=0.15, t=19.69, df=9) and hypoxic to recovery conditions (p<0.05, SD=0.51, SEM=0.16, t=22.36, df=9), with no significant difference comparing oxygen to recovery (Table 2). The number of errors was different between the two groups with regard to the subjects' distraction of attention due to abrupt changes in the indications appearing on monitoring panel of instruments.
Table 2: Root mean square error in tracking for both groups in all conditions. There is a statistically significant increase of RMSE in hypoxia as compared with the other conditions in both groups (p<0.005).
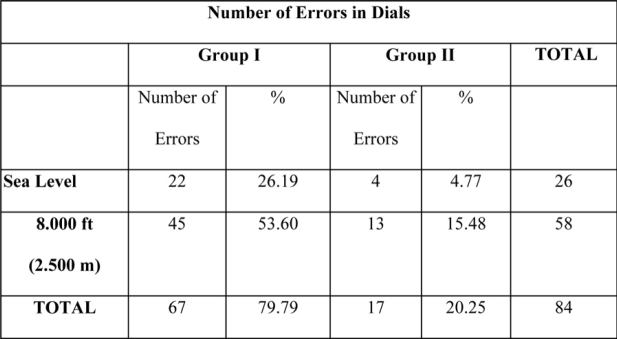
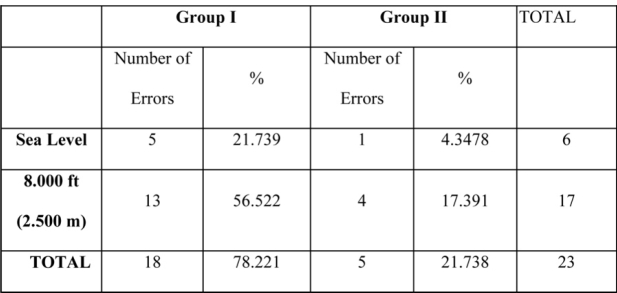
When we compared errors in lights and dials between the two groups under hypoxic conditions, the majority of errors were observed in group I. More specifically, eight-four (84) as a total number of errors in dials were recorded, out of which 79% were observed in the subjects of group I, under hypoxic conditions (Table 3). For lights twenty three (23) total number of errors were recorded, out of which 56% were observed in group I subjects (Table 4).
Table 3: Number of errors in dials for both groups at sea level and in 8000 ft. There is a statistically significant increase of errors in hypoxia as compared with the number of errors at sea level in both groups.
Table 4: Number of errors in lights for both groups at sea level and in 8000 ft. There is a statistically significant difference of errors in hypoxia as compared with the number of errors at sea level in both groups.
In order to compare tracking performance between the two groups a 2 by 3 conditions mixed models analysis of Variance with post hoc tests of Tuckey's / Bonferroni for homogenous subsets was performed. From this test we concluded that there is statistically significant differences between the two groups in the three conditions with F (1,27) 476184,3 and p=0,000<0.05 (from the intercept between the groups and conditions). Calculating the mean values of the three conditions we can also see a difference between the two groups with a higher mean in group I (Figure 3). The analysis was followed up by posthoc tests such as Tuckey's HSD/Bonferroni and the three conditions were displayed in three separate homogenous subsets suggesting that performance (RMSE) variations were different in the three conditions.
Figure 3: Root mean square error in tracking for group I in all conditions.
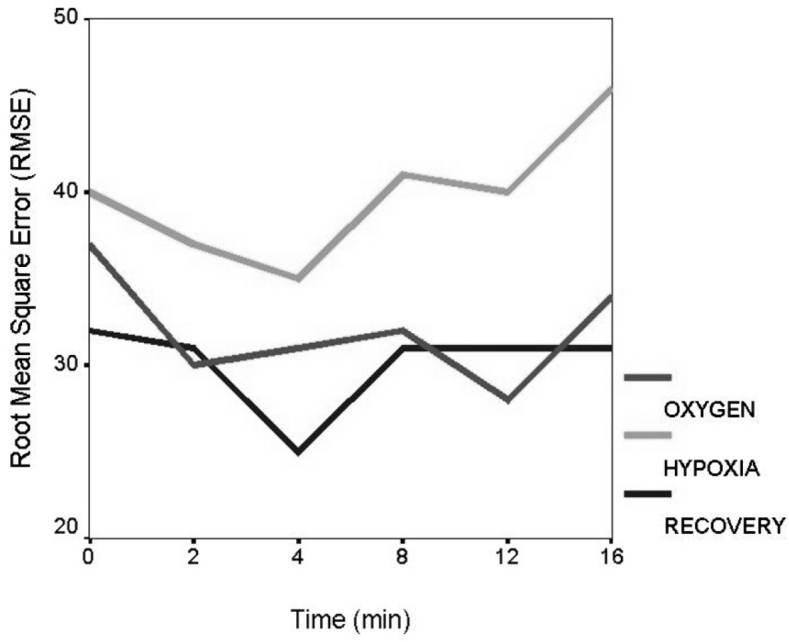
In order to examine the time effect we averaged the 30 sec means into 4-minute epochs and we performed 2 conditions by 4 epochs ANOVA using Greenhouse-Geyser and Huyn-Feldt corrections. These tests used an error a=0.05 to help control for the experiment wise error. RMSE means of 2 min each during the 16 min period of three conditions were displayed for group I (figure 4). For the hypoxic condition we follow a learning effect at the beginning with their best performance at the 4th min, which was followed by a gradual decrease in performance during the last period of 8-16 minutes, which could be attributed to hypoxia and fatigue.
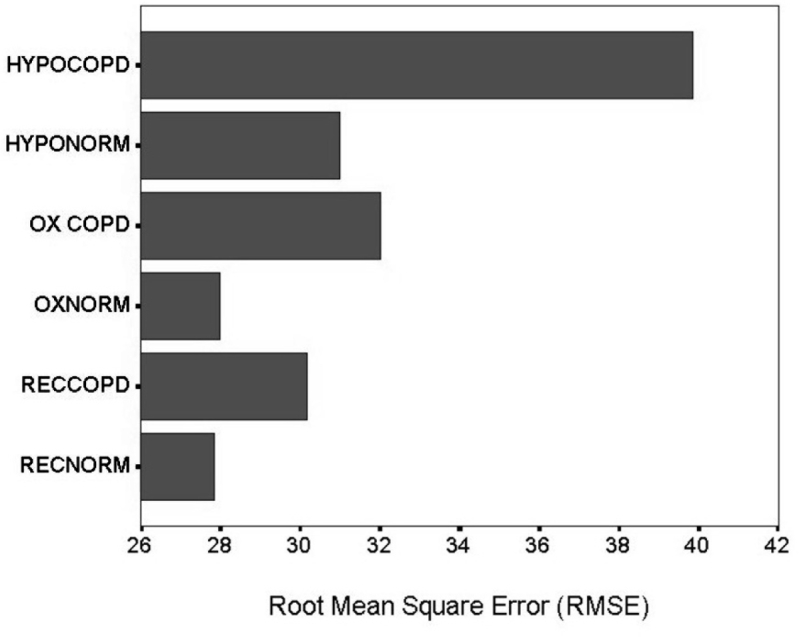
Figure 4: Comparing Root mean square error in tracking for group I and II in all conditions. HYPOCOPD: group I in hypoxia, HYPONORM: group II in hypoxia, OXCOPD: group I at sea level (21% O2), OXNORM: group II at sea level, RECOPD: group I in recovery (100% O2), RENORM: group II in recovery.
For group II, post-hoc analysis revealed two subsets of means and the values that caused the difference were displayed during 4-8 min (RMSE =28.50), which could be attributed to learning and during 12-16 min (RMSE =29.50), which could be due to hypoxic effect. There was an equal distribution of performance variations in all other epochs of this group.
We also calculated change scores by subtracting sea level performance from hypoxic gas exposure performance and then we conducted unpaired t test between COPD and normal groups. This test revealed statistically significant increase of RMSE (decrease in performance) in group I compared to group II (t=25,47,df=18,p<0.05).
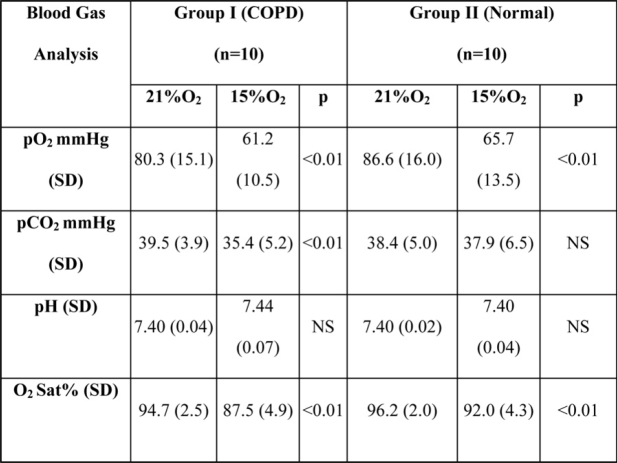
Partial pressure of oxygen (pO2), as well as partial pressure of carbon dioxide (pCO2) of group I, considerably dropped in hypoxic conditions (p<0.01). In group II pO2 decreased (p<0.01) but pCO2 did not have statistically significant differences (Table V). The haemoglobin oxygen saturation (O2 sat%) decreased in both groups with statistically significant differences (p<0.01).
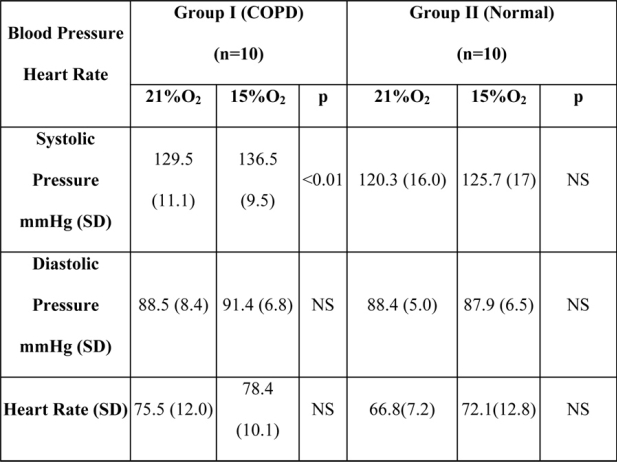
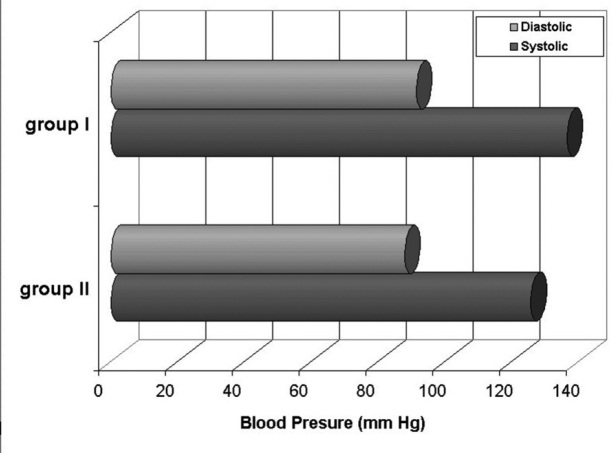
A statistically significant increase (p<0.01) was observed in the systolic arterial blood pressure of group I subjects when under hypoxic conditions, as compared to their pressure at sea level. In all other measurements the differences between the two groups were not statistically significant (Table VI, Figure 5).
Table 6: Systolic and diastolic Blood Pressure of two groups in hypoxia and sea level. There is a statistically significant increase of systolic blood pressure in hypoxia compared to sea level of group I.
Figure 5: Systolic and diastolic blood pressure of both groups in hypoxic conditions.
There was an increase of heart rate, respiratory rate and breath amplitude of group I and II in hypoxia, but not statistically significant.
Discussion
There is controversial data between researchers on the effect of hypoxia on cognitive performance below 10000 ft. in healthy individuals10,12,14–17. Considering that healthy individuals do not present significant cognitive impairment in the altitude of 8000 ft. our target population in our study was pilots or shift workers in high altitudes, as well as mountaineers with asymptomatic mild COPD subjected to two main factors influencing cognitive performance such as hypoxia and performance stress. We studied the subjects of each group separately and then we compared the two groups together. When we compared performance of the subjects within the same group in three different conditions we revealed a statistically significant increase of RMSE and consequently decrease in performance in hypoxic conditions compared to normoxic and hyperoxic conditions in group I and group II. Both the groups had performance decrements at 8000 ft simulated flight. But still there was a difference between the groups in the level of decrement. From the statistical analysis we concluded that there were significant differences between the two groups in the three conditions with a higher mean in group I and three separate homogenous subsets were displayed from post-hoc analysis, suggesting that performance (RMSE) variations were different in the three conditions. The condition that made the difference between the two groups was hypoxia. We also calculated change scores by subtracting sea level performance from hypoxic gas exposure performance and then we compared the two groups. This test also revealed statistically significant increase of RMSE in group I compared to group II.
The number of errors was different between the two groups with regard to the subjects distraction of attention due to abrupt changes in the indications appearing on monitoring panel of instruments. When we compared errors in lights and dials between the two groups under hypoxic conditions, the majority of errors were noted in group I. Peripheral measurements were recorded to elucidate the cause of those differences. More precisely from the pO2 measurements we observed a higher degree of hypoxia in Group I than group II. We also observed slight increase of heart rate and a significant increase of blood pressure level to those subjects (group I) suggesting a higher degree of stress and most probably an increase in catecholamines levels18. During flight both low barometric pressure and low blood volume, because of dehydration, could aggravate more the cardiovascular activity and catecholamines levels by increasing heart rate, blood pressure and venous tone19. From the compensatory mechanisms responding to the altitude hypoxia we can see that although group I subjects increased their respiration rate, which is also shown by the decrease in pCO2 they did not achieve to keep the same level of pO2 as the normal subjects did. We could assume that this was due to the difference in time constant and delayed expiration time was due to the mild obstruction of group I subjects. Hypoxia also increases the contractility of pulmonary vessels, thereby increasing pulmonary artery pressure and cerebral blood flow. Hypocapnia balances this change by decreasing the cerebral blood flow19, which also might influence cognitive performance as well as vision.
The subjects of group II had normal blood pressure, a slight increase in respiratory rate and they could better compensate for hypoxia.
From the time effect statistical analysis of performance we noted increasing performance for group I at the beginning of the task compared to their asymptotic level and we attributed this to learning effect. Specifically group I subjects appeared to have improvement in performance during the 8-12 min epoch, which was followed by a decrease in performance during the last epoch of 12-16 minutes, which could be attributed to fatigue of the subjects. We can see in this group a gradual effect of performance stress with differences of variations in all epochs. For group II, from post-hoc analysis we revealed two subsets of means and the values that caused the difference were displayed during 4-8 min, with improvement of performance, which could be attributed to learning and during 12-16 min a decrease in performance, which could be due to fatigue effect. Normal subjects presented an equal distribution of performance variations in all other epochs of this group. In both groups learning effect was present in the beginning of the task. At the end of 16 min task both groups presented a decrease in performance due to fatigue, with more intense changes of group I.
No significant correlation was found between performance (tracking) and physiological measurements.
The impairment of performance produced by lack of oxygen at altitude is of great practical significance in aviation, although there is a great variability between individuals, in the quantitative aspects of the performance of subjects exposed to hypoxia. Individual differences was one of the main confounding factors in this type of research, such as different strategies used by subjects to solve the same problem, subject-determined weighing of task priorities, the effects of individual subject experience, motivation, and many more variables. Although we noted performance decrements in both groups, group I subjects were more aggravated in hypoxia, with higher performance decrements, elevated blood pressure and significant increase in frontal brain activity compared to group II subjects. Those results suggest that spirometric evaluation should be one among the other parameters to be evaluated during the medical examination of candidate pilots or workers in high altitude.
Finally, the conclusions of this study constitute a basis for the prevention of accidents at work caused by healthy individuals working at high altitudes, often under performance stress, or by subjects suffering from mild asymptomatic COPD, which are more prone to errors and perform tasks that require concentration and attention.
Table 5: Blood gas analysis for both groups in hypoxia and sea level. There is a statistically significant difference of pO2 and pCO2 from oxygen to hypoxic in group I and pO2 only for group II.
Acknowledgments
Support sources from the Aristotle University of Thessaloniki, School of Medicine, Laboratory of Experimental Physiology, Thessaloniki, Greece are gratefully acknowledged.
References
- 1.Grant I, Heaton RK, McSweeny J, Adams KM, Timms RM. Neuropsychologic findings in hypoxemic chronic obstructive pulmonary disease. Arch Intern Med. 1982;142:1470–1476. [PubMed] [Google Scholar]
- 2.Guyton AC. Textbook of Medical Physiology. 7th edition. Philadelphia: WB Saunders Co; 1986. [Google Scholar]
- 3.Petty TL. A new national strategy for COPD. J Resp Dis. 1997;18:365–369. [Google Scholar]
- 4.National Center for Health Statistics. Report of Final Morbidity Statistics. 1998
- 5.Crow TJ, Kelman GR. Psychological effects of mild acute hypoxia. Brit J Anaesth. 1973;45:335–337. doi: 10.1093/bja/45.4.335. [DOI] [PubMed] [Google Scholar]
- 6.Johnson AO. Chronic obstructive pulmonary disease: Fitness to fly with COPD. Thorax. 2003;58:729–732. doi: 10.1136/thorax.58.8.729. [DOI] [PMC free article] [PubMed] [Google Scholar]
- 7.Wiant CJ, Baker SP, Marine WM, Vancil R, Keefer SM. Work-related aviation fatalities in Colorado 1982-1987. Aviat Space Envir Med. 1991;62:827–830. [PubMed] [Google Scholar]
- 8.Cottrell JJ. Altitude exposures during aircraft flight: flying higher. Chest. 1988;92:81–84. doi: 10.1378/chest.93.1.81. [DOI] [PubMed] [Google Scholar]
- 9.Gong H. Air travel and patients with pulmonary and allergic conditions. J Allergy Clin Immun. 1991;87:879–85. doi: 10.1016/0091-6749(91)90137-d. [DOI] [PubMed] [Google Scholar]
- 10.Denison DM, Ledwith F, Poulton EC. Complex reaction times at simulated cabin altitudes of 5000 ft and 8000 ft. Aerospace Medicine. 1966;37:1010–1013. [PubMed] [Google Scholar]
- 11.Billings CE, Reynard WD. Human factors in aircraft incidents: results of a 7-year study. Aviat Space Envir Med. 1984;55:960–965. [PubMed] [Google Scholar]
- 12.Trollip SR, Jensen RS. Human factors for general aviation. Englewood, CO: Jeppeson Sanderson Inc; 1991. pp. 7–21. [Google Scholar]
- 13.Nesthus TE. Fatigue and Performance: Contribution of Hypoxia (At and below 12,500 ft) in GA Pilots. CAMI, AM FORM 9950-1 (REV. 11-93) 1993
- 14.Crow TJ, Kelman GR. Effect of mild acute hypoxia on human short-term memory. Br J Anesth. 1971;43:548–552. doi: 10.1093/bja/43.6.548. [DOI] [PubMed] [Google Scholar]
- 15.Fowler B, Paul M, Poplier G, Elcombe DD, Taylor M. A re-evaluation of the minimum altitude at which hypoxic performance decrements can be detected. Ergonomics. 1985;28:781–791. doi: 10.1080/00140138508963198. [DOI] [PubMed] [Google Scholar]
- 16.Tune GS. Psychological effects of hypoxia: review of certain literature from the period 1950 to 1963. Percept Mot Skills. 1964;19:551–562. doi: 10.2466/pms.1964.19.2.551. [DOI] [PubMed] [Google Scholar]
- 17.Fowler B, Prlic H. A comparison of visual and auditory reaction time and P300 Latency thresholds to acute hypoxia. Aviat Space Environ Med. 1995;66:645–650. [PubMed] [Google Scholar]
- 18.AGARD-AR-324. Psychophysiological Assessment Methods. 1994.
- 19.Roach RC, Loeppky JA, Icenogle MV. Acute mountain sickness: increased severity during simulated altitude compared to normobaric hypoxia. J Appl Physiol. 1996;81:1908. doi: 10.1152/jappl.1996.81.5.1908. [DOI] [PubMed] [Google Scholar]


