

Abstract
Neuronal activity-induced changes in vascular tone and oxygen consumption result in a dynamic evolution of blood flow, volume, and oxygenation. Functional neuroimaging techniques, such as functional magnetic resonance imaging, optical imaging, and PET, provide indirect measures of the neural-induced vascular dynamics driving the blood parameters. Models connecting changes in vascular tone and oxygen consumption to observed changes in the blood parameters are needed to guide more quantitative physiological interpretation of these functional neuroimaging modalities. Effective lumped-parameter vascular balloon and Windkessel models have been developed for this purpose, but the lumping of the complex vascular network into a series of arterioles, capillaries, and venules allows only qualitative interpretation. We have therefore developed a parallel vascular anatomical network (VAN) model based on microscopically measurable properties to improve quantitative interpretation of the vascular response. The model, derived from measured physical properties, predicts baseline blood pressure and oxygen saturation distributions and dynamic responses consistent with literature. Furthermore, the VAN model allows investigation of spatial features of the dynamic vascular and oxygen response to neuronal activity. We find that a passive surround negative vascular response (“negative BOLD”) is predicted, but that it underestimates recently observed surround negativity suggesting that additional active surround vasoconstriction is required to explain the experimental data.
Introduction
The hemodynamic response to neuronal activation involves a complex interplay between processes, which leads to changes in cerebral perfusion and to changes in glycolytic metabolism and oxygen consumption. Vasoactive agents, released during neuroglial activation, interact with the vascular smooth muscle of arterioles, inducing changes in muscle tone and vascular diameter (Devor et al., 2007; Hamel, 2006; Iadecola, 2004; Toda and Okamura, 1998). Capillary diameter can also be controlled through activation of pericytes (Peppiatt et al., 2006). Arteriolar dilation, a common denominator in evoked hemodynamic response, alters the vascular resistance and results in an increased blood flow into the vascular network and increased pressure in the downstream vascular segments. The compliant capillaries and venules subsequently expand in response to this increased pressure with some debate as to whether dominant volume changes occur on the arteriole side (Hillman et al., 2007; Kim et al., 2007; Lee et al., 2001) or venous side (Buxton et al., 1998; Kong et al., 2004; Mandeville et al., 1999). Consequently, increased flow results in a greater delivery of oxygenated hemoglobin. This flow-induced dilution of deoxy-hemoglobin overbalances increases in oxygen consumption. Thus, oxygen extraction fraction is found to decrease (Buxton et al., 2004; Fox and Raichle, 1986; Hoge et al., 1999b).
Physiological interpretation of functional MRI (fMRI) or optical imaging measures of the hemodynamic response to brain activation requires a detailed understanding of the competing effects of increased perfusion and metabolism. Biologically plausible models of the cerebral vascular response have been described not only for determining functional changes in the cerebral metabolic rate of oxygen (CMRO2) (Boas et al., 2003; Hoge et al., 1999a; Kida et al., 2000; Zheng et al., 2002), but also for aiding in the interpretation of the characteristics of the fMRI blood oxygen level-dependent (BOLD) response (Mandeville et al., 1999; Obata et al., 2004) as reviewed in Buxton et al. (2004). The first such models to detail these interactions in the context of fMRI data were the vascular balloon (Buxton et al., 1998) and Windkessel (Mandeville et al., 1999) models, coupled with models of oxygen delivery including the diffusion limited delivery model (Buxton and Frank, 1997; Gjedde et al., 1999) and later extended to include the interstitial oxygen-buffered models (Herman et al., 2006; Zheng et al., 2002).
These initial models treated the cerebral vascular network as a serial pipe with a dilating arteriole and a passively responding venule. While this is a gross oversimplification, it does make predictions that agree reasonably well with experimental fMRI data (Deneux and Faugeras, 2006; Obata et al., 2004) and provides an interpretation of response characteristics such as the initial “dip” and post-stimulus under-shoot of the BOLD signal (Buxton et al., 2004) and the delayed recovery of blood volume (Mandeville et al., 1999). However, when compared to the immensely more complex biological vascular network, it is not surprising to find systematic biases in these oversimplifications, especially in the context of the rich information available from invasive functional imaging studies. Recent work by Zheng et al. (2005) has highlighted discrepancies between a simplified two-compartment model and experimental data acquired at high temporal resolution with invasive optical measurements of hemoglobin and blood flow changes. In order to better explain temporal differences observed between oxy- and deoxy-hemoglobin changes, Zheng et al. (2005) extended the earlier vascular and oxygen transport models by Mandeville et al. (1999) and Zheng et al. (2002) to a three-compartment model of an actively dilating arteriole and a passively responding capillary and venule. The compartmentalized model was reported to predict the oxygenation response as measured by optical imaging data (Zheng et al., 2005) and more recently was confirmed by Huppert et al. (2007), who showed that a three-compartment model statistically improved the fit to experimental data and provided more robust estimates of CMRO2 changes. These models provide predictions of the hemodynamic response to brain activation and, inversely, precise estimates of the oxygen consumption response from experimental data (Huppert et al., 2007; Zheng et al., 2005) and offer opportunities for better analysis of multimodal datasets (Riera et al., 2005).
While the goal is to develop the simplest model that effectively and accurately captures the correct behavior of the complex system, care must be taken in interpreting the lumped parameters of the simplistic model that describe the effective properties of the brain’s vasculature. The relation between these effective parameters and the true physical properties of the hemodynamic response is unknown, and thus the accuracy of any estimates obtained by these models is uncertain. In addition, the serial pipe models may not fully describe spatial characteristics of the hemodynamic response, such as the surround negativity response observed in whisker barrel cortex with optical imaging (Cox et al., 1993; Devor et al., 2007; Devor et al., 2005; Woolsey et al., 1996) and negative BOLD signals in the visual cortex (Harel et al., 2002; Shmuel et al., 2002). Although the recent development of multi-compartment models has improved the interpretation of the temporal dynamics of hemodynamic changes, the spatial characteristics of signals have not been explored.
In order to obtain a more detailed understanding of the spatio-temporal characteristics of the hemodynamic response to brain activation, and ultimately to obtain more accurate estimates of the underlying physiological factors driving the hemodynamic response, we have developed a parallel vascular anatomical network (VAN) model based on the physically measurable properties of the vessels, hemoglobin, and oxygen. Our VAN model is an extension of our previous three-compartment serial pipe Windkessel model (Huppert et al., 2007) to now include parallel arterioles, capillaries, and venules and enable model parameters to derive from physical properties of the vascular network including vessel segment diameters, lengths, and viscosity. Given this VAN model, we then predict baseline blood pressure and hemoglobin oxygen saturation consistent with literature values. Examining the dynamic response to local arteriole dilation, we observe a hemodynamic response consistent with experiments and the serial pipe models. Finally, we find that spatial surround negativity in the hemodynamic response (i.e., decreased blood flow, volume, and oxy-hemoglobin with increased deoxy-hemoglobin) arises naturally from the passive redistribution of pressure gradients in the vascular network, but does not fully account for surround negativity recently reported in the literature (Devor et al., 2007; Devor et al., 2005), suggesting a combination of passive and active processes.
Vascular anatomical network model
This section describes our model of the microscopic vascular anatomy including the blood flow and volume dynamics and the oxygen delivery. We first cover the flow and volume aspects of the model, including parameter selection, and then address the oxygen delivery aspects of the model, including parameter selection.
Flow–volume dynamics
The vascular anatomical network (VAN) model is built up from a branching series of individual arterioles, through the capillaries, and then on to a converging series of venules, each with its own characteristic properties. The simplest version of this is a series of a single arteriole, capillary, and venule as depicted in Fig. 1. This simple serial vascular pipe model has been developed and described by the Balloon (Buxton et al., 1998) and Windkessel (Mandeville et al., 1999) models and more recently extended to multiple vascular compartments (Huppert et al., 2007; Zheng et al., 2005).
Fig. 1.
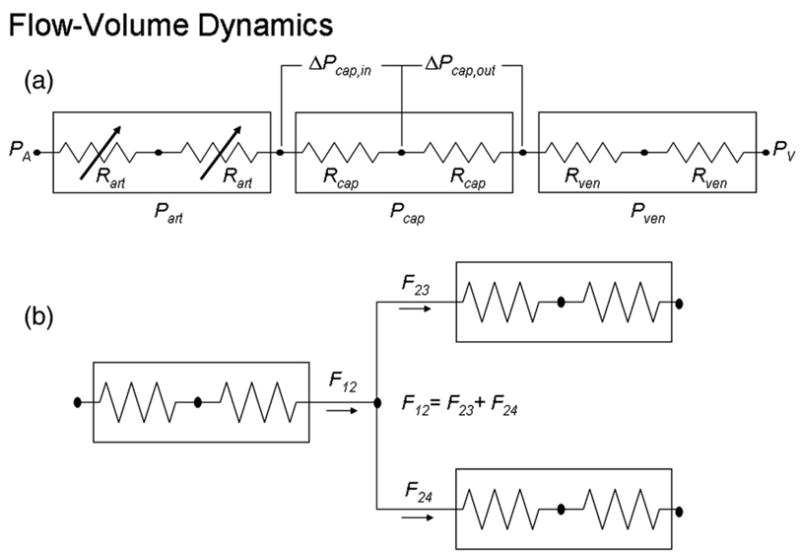
Diagram of the resistor network representing the vascular network.
As stated in the works of Huppert et al. (2007), Mandeville et al. (1999), and Zheng et al. (2005) for the serial pipe Windkessel models, the resistance of each vascular segment is related to the vessel diameter, d, length, l, and fluid viscosity, η, according to Poiseuille’s law (Washburn, 1921)
| (1) |
The arterial and venous pressures are fixed at the boundaries as PA and PV, respectively. Given the resistance of each vascular segment, the pressure and flow along the vascular network can be determined using the flow–pressure circuit relationship
| (2) |
where P1 is the pressure at the first segment, P2 is the pressure at the second segment, F12 is the flow from the first to the second segment, and R12 is the resistance between the two segments.
Neuronal activation gives rise to arteriolar dilation. Dilation results in decreased arteriolar resistance, as determined by Eq. (1), and increased flow, as determined by solving the circuit equations. The change in blood volume within a vessel segment per unit time is the differential of blood flow into and out of the vessel segment
| (3) |
where the subscript ‘i’ refers to the ith vessel segment.
Vessels generally have a non-linear compliance that decreases with increasing pressure. Following the example of Mandeville et al. (1999), this non-linear compliance produces a pressure–volume relationship of the form
| (4) |
for the arterioles, capillaries, and veins and the subscript ‘i’ refers to the ith vessel segment. PIC is the intra-cranial pressure, which we assume is constant. The non-linearity in the pressure–volume relationship is given by compliance parameter β ≥ 1 for diminished volume reserve at higher pressures. The constant Ao is given by the initial volume, Vo, and pressure, Po, of the ith segment
| (5) |
Extension of the serial pipe model to a network model requires adding branch nodes in which vessel segments diverge or converge. These branch nodes have no blood volume and are simply modeled by a conservation of flow equation, i.e., net flow out must equal net flow in, as illustrated in Fig. 1.
Initial conditions related to blood flow and volume
We are modeling the network of cortical vessels from the pial arterioles through the capillaries to the pial venules. We choose parameters to resemble the rat’s cerebral cortex. We use a simple balanced branching network from a single arteriole through 2N capillaries back to a single venule, with N =6 branches of arterioles and venules and a single branch of capillaries. The length of each arteriole and venule segment is fixed at 100 μm, and the capillaries have a length of 250 μm (Turner, 2002; Vovenko, 1999).
The capillary diameter is set to 8 μm (Kleinfeld et al., 1998; Lipowsky, 2005; Villringer et al., 1994). Arteriole diameter decreases by 20% at each branch, starting at 30.5 μm and decreasing to 10.0 μm just before the capillaries. While this is a simplistic model of the distribution of arteriole diameters, it was chosen to match the literature on the reduction of velocity from arteriole to capillary. Red blood cell velocity decreases from ~13 mm/s in 30 μm arterioles to ~2.5 mm/s in the capillaries, to a minimum of ~2 mm/s in the post-capillary venule, as measured in cat mesentery (Lipowsky, 2005; Zweifach, 1974). This requires that the net cross-sectional area of the capillaries be greater than the net cross-sectional area of the initial feeding arteriole. The velocity at each branch will decrease only if the diameter decreases by no more than 30%, otherwise the net cross sectional area decreases, leading to a velocity increase. A decrease from 13 mm/s to 2 mm/s over 6 branches requires an average diameter reduction of 20% per branch.
Venule diameters are set to increase by 20% per branch, with the post-capillary venules given a diameter of 12.0 μm, resulting in a final venule diameter of 36.6 μm, as venules are typically larger than arterioles (Vovenko, 1999).
The resistance of each vascular segment is dependent on its diameter, length, and apparent viscosity, as indicated by Poiseuille’s law (Eq. (1)). Viscosity increases monotonically with increasing vessel diameter and linearly with hematocrit, as summarized by Pries et al. (1992), and we assume a plasma viscosity of 2 cP (Haidekker et al., 2002). Microvessel hematocrit decreases with vessel diameter and ranges from ~14% in 30 μm arterioles to ~8% in capillaries (Lipowsky et al., 1980). All of these vascular segment-dependent values are summarized in Table 1.
Table 1.
Model vascular segment parameters
| Branch - # segments | Input
|
Function of input
|
From model
|
||||||
|---|---|---|---|---|---|---|---|---|---|
| Length (μm) | Diameter (μm) | Volume (pl) | Hct (%) | Viscosity (cP) | Resistance (mmHg s/μl) | Velocity (mm/s) | Transit Time (ms) | SO2 (%) | |
| A1-1 | 100 | 30.5 | 73 | 14.1 | 2.49 | 88 | 13.5 | 7.4 | 94 |
| A2-2 | 100 | 24.4 | 94 | 11.5 | 2.34 | 200 | 10.5 | 9.5 | 93 |
| A3-4 | 100 | 19.5 | 120 | 9.8 | 2.25 | 480 | 8.2 | 12 | 92 |
| A4-8 | 100 | 15.6 | 153 | 9.4 | 2.20 | 1100 | 6.4 | 15 | 89 |
| A5-16 | 100 | 12.5 | 196 | 9.1 | 2.16 | 2700 | 5.0 | 20 | 84 |
| A6-32 | 100 | 10 | 251 | 8.8 | 2.12 | 6500 | 3.9 | 26 | 77 |
| C-64 | 250 | 8 | 804 | 8.5 | 2.10 | 39,000 | 3.0 | 82 | 66 |
| V6-32 | 100 | 12 | 362 | 8.8 | 2.15 | 3,200 | 2.7 | 37 | 61 |
| V5-16 | 100 | 15 | 283 | 8.8 | 2.18 | 1,300 | 3.4 | 29 | 59 |
| V4-8 | 100 | 18.7 | 221 | 8.8 | 2.22 | 560 | 4.5 | 22 | 58 |
| V3-4 | 100 | 23.4 | 173 | 11.1 | 2.32 | 240 | 5.7 | 18 | 58 |
| V2-2 | 100 | 29.3 | 135 | 15.1 | 2.51 | 100 | 7.3 | 14 | 58 |
| V1-1 | 100 | 36.6 | 105 | 18 | 2.70 | 46 | 9.3 | 11 | 58 |
This is a table of parameters used in the vascular model. The lengths and diameters of each branch are provided as inputs. Arteriole, capillary, and venule branches are indicated by A, C, and V, respectively, followed by the branch level and the number of vessel segments at that branch level. The volume, hematocrit, viscosity, and resistance are all functions of the length and diameter. The velocity and transit time are derived from the steady state solution of the vascular model given these input parameters. The SO2 is derived from the coupled vascular and oxygen delivery models. Additional model parameters are given in Table 2.
The baseline parameters not associated with individual vascular segments are summarized in Table 2. The non-linear vascular compliance is given by β = 2 as representative of the range 1 < β <3 given in the literature (Dunn et al., 2005; Jones et al., 2001, 2002; Mandeville et al., 1999; Sheth et al., 2004b). Finally, PA=60 mmHg for the 30-μm arteriole blood pressure, PV =25 mmHg for the 35-μm venule blood pressure (Lipowsky, 2005), and the intracranial pressure, PIC =10 mmHg (Albeck et al., 1991; Alperin et al., 2000).
Table 2.
Additional parameters related to the vasculature and the diffusion of oxygen
| Vascular parameters | |||
| ρA | arteriole pressure | 60 mmHg | Lipowsky (2005) |
| ρV | venule pressure | 25 mmHg | Lipowsky (2005) |
| ρIC | intra-cranial pressure | 10 mmHg | (Albeck et al., 1991; Alperin et al., 2000) |
| β | vascular compliance parameter | 2.0 | 1 ≤ b ≤ 3 (Dunn et al., 2005; Jones et al., 2001, 2002; Mandeville et al., 1999; Sheth et al., 2004b) |
| Oxygen parameters | |||
| SaO2 | arteriole oxygen saturation | 94% | Vovenko (1999) |
| α | Bunsen solubility coefficient for oxygen | 1.275 × 10⁻¹² mol/μl/mmHg | Popel et al. (1989) |
| ρCMRO2 | effective oxygen consumption radius | 30 μm | (Hudetz, 1997; Turner, 2002) |
| Kw | oxygen permeability of vascular wall | 5 × 10⁻⁸ μl/mm/s/mmHg | Popel et al. (1989) |
| PO2,tis | partial pressure of oxygen in tissue | 15 mmHg | Vovenko (1999) |
Oxygen dynamics
As illustrated in Fig. 2, the oxygen content in a vascular segment is a balance between oxygen flow into a segment via blood flow and out of the segment via blood flow and oxygen diffusion into the tissue. That is,
Fig. 2.

Diagram of oxygen dynamics.
| (6) |
where SO2,in and SO2,out is the hemoglobin oxygen saturation flowing in and out of the segment, respectively, OE is the rate of oxygen extraction from the segment into the tissue in units of mol/s, and NHbO2 is the moles of oxygenated hemoglobin in the segment. The factor γB converts from microliters of blood to moles of hemoglobin, while the factor of 0.25 accounts for the fact that each molecule of hemoglobin can carry 4 molecules of oxygen. The molecular weight of hemoglobin is 64,500 g/mol. With a typical blood hemoglobin concentration of 150 g/l (Habler and Messmer, 1997), γB = 2.3 × 10⁻⁹ mol/μl. We assume the average oxygen saturation of each segment as
| (7) |
The quantity of oxygenated hemoglobin is related to the blood volume (units of μl) by
| (8) |
where NHbT is the amount of hemoglobin (oxygenated and deoxygenated) in the segment. Note that
| (9) |
Substituting Eqs. (6–8), into Eq. (9), we arrive at the differential equation describing the variation in SO2
| (10) |
The oxygen flux across the vessel wall can be expressed using Fick’s Law (Popel et al., 1989)
| (11) |
where PO2,tis,i and PO2,i are the partial pressure of oxygen in the tissue around and in the ith vascular segment, respectively; w is the thickness of the vascular wall; and KW is the oxygen permeability of the vascular wall. The oxygen extraction is just the flux times the surface area of the vessel wall
| (12) |
where the last term on the right converts the volume of consumed oxygen (at standard pressure and temperature of 1 atm and 273 K, respectively) to moles. Note that the relationship between PO2 and SO2 is given by the oxygen disassociation curve. For our modeling, we use the empirical fit given by Kelman (1966) and Severinghaus (1979). We combine Eqs. (11) and (12) to lump all of the coefficients into a single parameter that we call an oxygen extraction coefficient kw,i with units of mol/mmHg/s.
| (13) |
Finally, changes in the tissue partial pressure of oxygen are caused by differences in the delivery of oxygen to the tissue by OE and extraction by the cerebral metabolic rate of oxygen CMRO2, i.e.,
| (14) |
where α is the Bunsen solubility coefficient for oxygen, and VCMRO2 = πliρ2cmro2 is the volume in which the extracted oxygen is consumed.
Initial conditions related to oxygenation
Vovenko (1999) has made detailed measurements of the hemoglobin oxygenation in arterioles, capillaries, and venules of the rat cortex. We use Vovenko’s numbers to guide the initial condition for our model. Vovenko’s results show a significant drop in SO2 from the systemic arterial oxygen saturation of 94% to a pre-capillary oxygen saturation of 84%, indicating significant oxygen flux from the arterioles. A drop of ~25% is observed across the capillaries. Negligible change is observed throughout the venules.
Hemoglobin oxygenation in each vascular branch is a function of the blood flow, blood volume, and oxygen extraction. The flow and volume of each branch are set as described above. We thus must define the initial oxygen extraction from each segment to obtain the initial hemoglobin oxygenation. This is achieved by adjusting the effective oxygen extraction coefficient kw(Eq. (13)). To simplify, we use the same kw for all vessel segments independent of vessel diameter, length, and thickness. Given a vessel length of 250 μm, diameter of 8 μm, wall thickness of 2 μm, and permeability Kw = 5 × 10⁻⁸ μl/mm/s/mmHg (Popel et al., 1989), we find kw = 7 × 10⁻¹⁵ mol/mmHg/s. We use this value for all vessel segments.
The oxygen solubility coefficient and radial extent of oxygen consumption are defined in Table 2. As described in the works of Hudetz (1997) and Turner (2002), the volume fraction of capillaries is approximately 2% and thus each capillary supplies about 50 × its cross-sectional area with nutrients. Thus, for an 8-μm-diameter capillary, oxygen is delivered radially outward to a distance of approximately 30 μm.
Solution of the equations
Given the initial resistance of each vascular segment and the input and output pressure, the steady-state pressure distribution throughout the parallel vascular network is obtained by simultaneously solving the coupled linear equations arising from Eq. (2) with the boundary condition that flow in and out of a node point must be conserved. The steady-state flow is then calculated from Eq. (2). The steady-state solution for oxygen saturation is obtained from Eqs. (10) and (13) given the steady-state flow, input oxygen saturation, and partial pressure of oxygen in the tissue. These coupled differential equations are solved iteratively until convergence. Specifically, the time derivatives in Eq. (10) are set to 0. The oxygen saturation is set to the arteriole oxygen saturation at the input node and to 0 everywhere else. The partial pressure of oxygen is estimated at each node point—Eq. (10) is solved for SO2,out at each node point, SO2,in is estimated from flow conservation—and this process was iterated until convergence.
The solution with arteriole resistance and oxygen consumption varying in time is similar. At each time step, the arteriole diameter at specific nodes can vary, causing a variation in resistance. The pressure distribution is recalculated at each time point, considering the incremental arteriole volume increase and further considering compliant volume changes in capillaries and venules given the pressure at the previous time instance. Flow in and out of each node point is then calculated from the pressure distribution and used to calculate the time derivate in SO2 utilizing Eqs. (10–14) with the possibility of changes in CMRO2. We ran with a time step of 0.1 ms to ensure stability. Stability was tested by running with smaller time steps and obtaining the same solution. More efficient adaptive time step solvers could be implemented in the future.
Results
Baseline conditions
Given the vessel lengths and diameters summarized in Table 1, we find blood volumes of 887, 804, and 1279 pl in the arterioles, capillaries, and venules, respectively. This is consistent with the volume fraction partitioning given in Duong and Kim (2000).
The resistance of each vascular segment derives from length, diameter, and viscosity. These values are summarized in Table 1 and result in cumulative resistances of 11,000, 39,000, and 5400 mmHg s/μl in the arterioles, capillaries, and venules, respectively, placing 20% and 70% of the resistance in the arterioles and capillaries, respectively.
Given the pressure drop from 60 mmHg to 25 mmHg from feeding arteriole to draining venule, we obtain an estimate of the pressure and red blood cell velocity in each segment (flow divided by cross-sectional area, see Table 1). These pressures and velocities in each vascular segment are consistent with those given in Lipowsky (2005), as compared in Fig. 3. The volume divided by flow gives the vascular transit time τflow. This transit time is given for each segment in Table 1, and sums to 0.090, 0.082, and 0.131 s in the arterioles, capillaries, and venules, respectively, for a total of 0.303 s. We note that the apparently short transit time arises from the fact that we are only considering the transit of blood over a distance of ~1.5 mm from a 30-μm arteriole to a 40-μm venule, and not the transit time of blood through a localized volume of tissue, which has the longer transit time of 1.5 to 3 s.
Fig. 3.
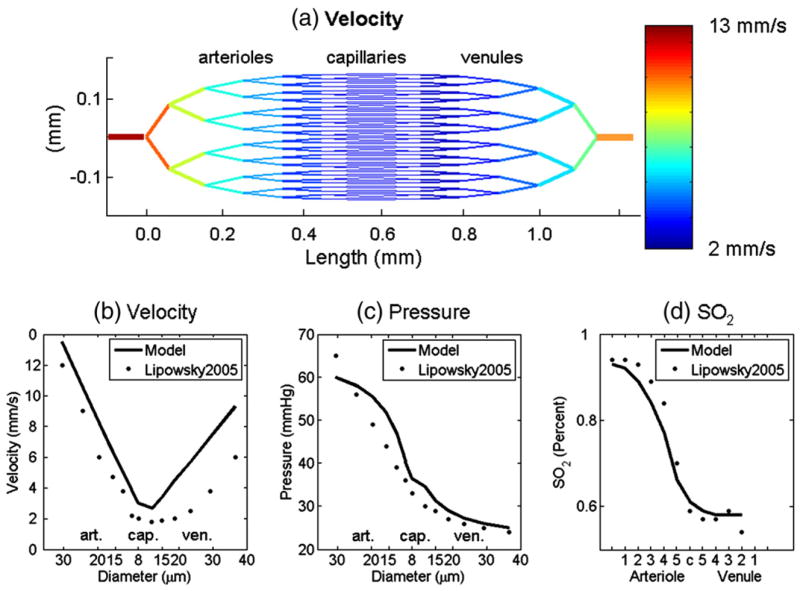
(a) Our 2D vascular network model and the velocity in each segment calculated from the arterial–venial pressure difference and the resistance of each vascular segment. (b) Velocity, (c) pressure in different diameter segments, and (d) hemoglobin oxygen saturation in different vascular branches agree well with experimental measurements from Lipowsky (2005) and Vovenko (1999). From left to right are arterioles, capillaries, and venules.
The hemoglobin oxygen saturation, SO2, in each branch is determined by the blood flow and the flux of oxygen across the vascular membrane as driven by the oxygen pressure gradient (Eq. (13)). The baseline SO2 distribution is given in Table 1 and is in qualitative agreement with Vovenko (1999) with SO2 dropping to ~75% just before the capillaries and to ~55% just after the capillaries, and slowly decreasing a few percent thereafter (see Fig. 3d).
The sensitivity of baseline velocity, pressure, and SO2 to vascular segment length and diameter is explored in Fig. 4. Increasing the lengths increases resistance and thus leads to a reduced velocity. This also results in an increased transit time, enabling a greater extraction of oxygen as evidenced by the decrease in SO2. Decreasing the diameter of the vascular segments increases resistance and decreases flow. Velocity is flow divided by the cross-sectional area. Both flow and cross-sectional area decrease with a smaller vascular diameter, with the result of an increase in velocity for our network. The increased velocity with constant vascular length indicates a smaller vascular transit time, suggesting less extraction of oxygen. There is also less oxygen in the blood because of the reduced diameter, with the result that there is an increased oxygen extraction fraction evidenced by the significant reduction in SO2. Increasing the vascular diameter significantly decreases velocity with a small increase in SO2. Taken together, we observe that our model is in agreement with literature values for velocity, pressure, and SO2, and is good for vascular lengths ranging ± 50% and vascular diameters ranging less than ± 20%.
Fig. 4.

We plot (a, d) velocity and (b, e) pressure in different diameter segments, and (c, f) hemoglobin oxygen saturation in different vascular branches. In the first row, results are shown for increasing the length of the arterioles by 50% (blue line), the length of the venules by 50% (red line), and the length of both by 50% (green line). In the second row, results are shown for decreasing (red line) and increasing (blue line) the diameter of the arterioles and venules. For the blue (red) line the vessel diameter is increased by 25% (10%) at each branch level away from the capillaries compared with the black line in which the diameter increases by 20% at each branch level. In both rows, the black line shows the result for the original lengths and diameters (same as Fig. 3).
Steady-state response to localized arterial dilation
To examine the dynamic response to arteriolar dilation, pre-capillary arteriolar resistance was locally decreased as
for two neighboring 4° arterioles and their downstream 5° and 6° branches with ΔRa =0.05. Recall that resistance is proportional to the diameter as d−4, and thus the 5% resistance decrease corresponds to a 1.3% increase in arteriole diameter. This results in a rapid local increase in flow (2.3%) and volume and a slower local increase in oxygen saturation as indicated by the red lines in Fig. 5. The surround flow is seen to decrease as flow prefers to follow the path of least resistance through the dilated arterioles. Surround volume initially decreases in the compliant capillaries and venules, but subsequently increases downstream due to backpressure as the venules downstream from the dilating arterioles increase in volume. Oxygen saturation is decreased in the surround as reduced flow results in increased oxygen extraction fraction. Note that oxygen consumption remained constant for these simulations.
Fig. 5.
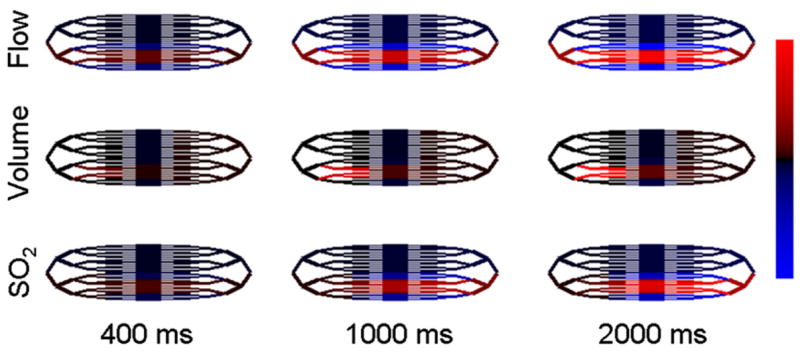
We graph the relative changes in flow, volume, and SO2 in response to localized arteriole dilation. Red indicates an increase and blue indicates a decrease. Flow changes range from −0.22% to 2.2%. Volume changes range from −0.26% to 2.6%. SO2 changes range from −0.11% to 1.1%.
To verify that our model is not limited to small changes only, we also simulated diameter changes of 5.5%, 16%, and 44%, which produced flow responses of 9.6%, 28%, and 65%, respectively. No convergence or stability issues were observed for these larger changes. The only notable difference in the relative response of the different vascular compartments was that the fractional changes in total hemoglobin are weighted higher in the arteriolar compartment as the driving arteriolar diameter changes are increased.
Surround negativity
As observed in Fig. 5, there is a surround negativity in flow, volume, and oxygen saturation. The surround behavior of these hemo-dynamic parameters compared to the center region of interest is compared for the arterioles, capillaries, and venules in Fig. 6. Flow exhibits a surround decrease that is approximately 15% of the center increase. Blood volume does not exhibit a noteworthy increase or decrease. Upon closer inspection, we observe that surround volume decreases in the capillaries due to reduced pressure, but increases in the venules due to increased backpressure. Deoxy-hemoglobin, however, exhibits a noticeable increase in the surround in the capillaries and venules, while oxy-hemoglobin exhibits a modest decrease. The magnitude of the surround negativity relative to the center response is only weakly diminished as the absolute magnitude of the center response increases.
Fig. 6.

Plotted are the relative hemodynamic responses to arteriole dilation in the arterioles, capillaries, and venules in the center ROI (solid lines) and the surround ROI (dashed lines), as absolute (top row) and relative changes (bottom row). The regions of interest (ROIs) are defined in Fig. 7. Note the surround decrease in flow in all vascular compartments and the surround negativity in oxy- and deoxy-hemoglobin in the capillaries and venules. The surround (dashed lines) has been magnified by a factor of 10.
Steady-state response to localized increases in CMRO2 and arteriole dilation
In Fig. 8, we plot the modulation of the hemoglobin concentration response by changes in the rate of oxygen consumption. The change in oxygen consumption was given the same dynamics as the arteriole dilation, i.e.,
Fig. 8.

These plots show the modulation of oxy- and deoxy-hemoglobin in each vascular compartment by increases in the rate of oxygen consumption. The solid, dashed, dot-dashed, and dotted lines represent the responses to 0, 0.5%, 1%, and 1.5% increases in oxygen consumption. In all cases, there is a 1.3% increase in arteriole diameter.
Results were compared for 0%, 0.5%, 1%, and 1.5% increases in CMRO2. Note that, as the percent change in CMRO2 approaches the percent change in blood flow, the deoxy-hemoglobin response goes from negative towards positive as the increase in oxygen consumption exceeds the increase in oxygen delivery.
Response to transient arterial dilation and oxygen consumption
No change in oxygen consumption
We created a transient arteriole dilation to explore the relative time-to-peaks and magnitudes of the different hemodynamic parameters. The form of the dilation was given by (recall that resistance is proportional to diameter−4)
| (15) |
where Rao is the initial arteriole resistance, ΔRa is the magnitude of the resistance change caused by the dilation, Toffset is the temporal offset to the onset of the dilation, σwid is the temporal width of the dilation, H(t) is a Heaviside step function equal to 0 when t < 0 and 1 when t > 0, and the denominator normalizes the numerator to a maximum of 1. The hemodynamic responses to this transient arteriole dilation are shown in Fig. 9 for ΔRa =0.05, Toffset =0.1 s, and σwid = 1.0 s. All other baseline parameters are given in Tables 1 and 2.
Fig. 9.

The first row shows hemoglobin responses to a transient arteriole dilation (solid lines) and a transient increase in CMRO2 (dashed lines) for each vascular compartment. The second row shows the hemoglobin responses to combined arteriole dilation and CMRO2 increase (dot-dashed lines) compared to an arteriole dilation only (solid line).
The fourth column shows the results of summing over the arteriole, capillary, and venule compartments represented in the first 3 columns. Units are in micromolars.
Transient increase in oxygen consumption
We created a transient increase in CMRO2 in addition to the arteriole dilation depicted above. The form of the increased oxygen consumption was given by
| (16) |
where CMRO2,o is the initial oxygen consumption, ΔCMRO2 is the magnitude of the resistance change caused by the dilation, Tc,offset is the temporal offset to the onset of the dilation, σc,wid is the temporal width of the dilation, H(t) is a Heaviside step function equal to 0 when t < 0 and 1 when t > 0, and the denominator normalizes the numerator to a maximum of 1. The hemodynamic responses to this transient increase in CMRO2 without and with accompanying arteriole dilation are shown in Fig. 9 compared with the case of arteriole dilation only. Parameters are ΔCMRO2 = 0.008, Tc,offset =0.05 s, σc,wid =0.2 s, and ΔRa =0.05, Toffset =0.1 s, σwid =1.0 s. All other baseline parameters are given in Tables 1 and 2. The magnitude of the CMRO2 change was chosen to be half of the flow response to agree with literature observations of a flow:consumption ratio of 2 (Hoge et al., 1999b, 2005; Kastrup et al., 2002; Leontiev and Buxton, 2007). Under the assumption that major metabolic costs are associated with oxidative phosphorylation and Na/K ATPase operation in the neuronal compartment, the time course of CMRO2 might follow that of the local field potential. Based on the work of Devor et al. (2005) on a single whisker, we chose a brief 200-ms width of the CMRO2 response to coincide with the brief electrophysiological response. Note that an early HbR increase arises from the early CMRO2 increase but that the peak HbR decrease is not altered because it occurs 1 s later, allowing the vascular transit time of 0.3 s to attenuate any HbR modulation.
Comparison with spatio-temporal response in rat whisker barrel cortex
In Fig. 10, the transient hemoglobin responses from the model are compared with experimental measurements from the rat whisker barrel cortex published previously in Devor et al. (2005). The model results were obtained with ΔCMRO2 = 0.10, Tc,offset =0.05 s, σc,wid =0.2, ΔRa =0.45, Toffset =0.1 s, σwid =1.7 s, and the remaining parameters are the same as used for Fig. 9. We observe good qualitative agreement in the center with the relative magnitudes of HbO, HbR, and HbT in agreement between the model and experiment. The relative magnitude of the early HbR increase and the later decrease is also in agreement between model and experiment. The experiment does differ in exhibiting a greater delay in time-to-peak for HbO and HbR relative to the model. This likely arises from the experiment being sensitive to more downstream veins having a longer transit time, which our model does not include. Both the model and the experiment show that the HbR time-to-peak is delayed with respect to HbO. In the surround, the time-to-peak of HbO and HbR is about the same in both the model and the experiment. However, in the surround, the relative magnitudes of HbO, HbR, and HbT are not in agreement between the model and the experiment. This suggests that the experimental observation of a surround decrease in HbO and increase in HbR does not arise solely from a passive redistribution of blood flow, but is actively controlled by vasoconstrictive mediators (Hamel, 2006).
Fig. 10.

The model (solid lines) is compared with the experimentally measured (dots) changes in hemoglobin concentrations in the center (a) and surround (b) of the rat barrel cortex. The model responses are averaged over the arteriole, capillary, and venule compartments. The dashed lines in (b) are the model responses from the capillary compartment only.
Discussion
Baseline properties of vascular network
The velocity in different branches of the vascular network depends on the topology of the network, the resistance of each vascular segment, and the pressure difference between the feeding input arteriole and the draining output venule. The resistance of each vascular segment depends on the diameter, length, and blood viscosity. The capillary diameter was set to 8 μm, consistent with a range of observations (Kleinfeld et al., 1998; Lipowsky, 2005; Villringer et al., 1994; Vovenko, 1999). The diameters of upstream arterioles and downstream venules were increased to decrease the integrated cross-sectional area at each branch level to result in a greater velocity in the larger vessels, consistent with the review of Lipowsky (2005). Furthermore, venous diameters were made larger to be more consistent with the observations of venous versus arteriole diameters (Vovenko, 1999) and to provide a greater volume fraction of blood in the veins versus the arteries, roughly 40% versus 30% with the remaining 30% in the capillaries (consistent with Duong and Kim, 2000). The capillary length was set to 250 μm, consistent with that of Vovenko (1999). Lacking literature support for the lengths of different arterioles and venules, these lengths were set to 100 μm. Blood viscosity depends on plasma viscosity and hematocrit as reviewed in Pries et al. (1992). Hematocrit varies with vessel diameter as reviewed in Lipowsky et al. (1980). These values taken together give the resistance of each vascular segment, and with the vascular topology and pressure drop allow the circuit equation calculation of flow, velocity, and transit time within each segment. While our balanced network of branching arterioles, capillaries, and converging venules is a simplistic representation of a true vascular network, the calculated velocity and blood pressure at each branch level agreed well with literature values (Fig. 3). Increasing the lengths of the arterioles and venules by 50% produces a moderate increase in resistance and only a small decrease in the velocity at each branch level, while changing the diameters at each branch level has a dramatic effect owing to the fourth power dependence on diameter.
Oxygenated hemoglobin is delivered by the feeding arteriole and flows through the vascular network. Oxygen bound to hemoglobin is in equilibrium with the plasma blood concentration and diffuses by the plasma, through the vascular wall, down an oxygen concentration gradient to the mitochondria, where it is metabolized. Increasing blood transit time or decreasing blood flow results in a greater fraction of oxygen extracted from the blood, thus decreasing the hemoglobin oxygen saturation. Increasing vascular length increases transit time and results in a modest decrease in oxygen saturation. Decreasing vessel diameters significantly reduces blood flow and oxygen saturation.
Comparing our VAN model predictions of velocity and oxygen saturation with literature values indicates strong model sensitivity to vascular diameters and weaker sensitivity to vascular lengths. Closer inspection of the data reveals differences in the venous velocity, arteriole pressure drop, and arteriole oxygen saturation. The model venous velocity is greater than literature values. This can be brought into better agreement by further increasing the diameter of the venules with little consequence on the oxygen saturation (data not shown) or considering venous topology giving rise to more ascending venules per descending arteriole. The literature arteriole pressure drops more rapidly than the model, suggesting greater resistance in the arterioles than is captured by our model. Obtaining better model agreement on the pressure will require exploration of more realistic vascular topologies and consideration of the resistance arising from deformation of red blood cells entering the capillaries (Lipowsky, 2005). Our model arteriole oxygen saturation drops more rapidly than literature values. Given our good agreement on the arteriole velocities, this suggests that our model of oxygen flux from arterioles to tissue needs modification. Modifications include properly accounting for the vascular wall thickness in Eqs. (11) and (13), and considering that tissue oxygen content may be greater near arterioles than near capillaries and venules. Our model currently uses the same oxygen extraction coefficient (Eq. (13)) for all vascular segments and assumes that tissue oxygen content is the same around every vascular segment. The former is an important issue considered by Herman et al. (2006). The latter is known to be false as Vovenko (1999) has measured increased oxygen content around arterioles than around capillaries and venules.
Dynamic response to dilation and oxygen consumption
Our VAN model response to a transient arteriole dilation and oxygen consumption produced results consistent with literature in terms of relative times-to-peak and relative amplitudes for the hemodynamic variables. Blood volume (i.e., total hemoglobin concentration) and blood flow peak was followed first by a delayed peak in oxygenated hemoglobin and then by a delayed peak in deoxygenated hemoglobin. Blood volume and flow peak closely following the peak in arteriole dilation. Oxy- and deoxy-hemoglobin exhibit delayed peaks due to the venous washout of deoxy-hemoglobin. The peak for oxygenated hemoglobin is not as delayed as for deoxy-hemoglobin because of the differing relative contributions of arteriolar and venous contributions to each.
As shown in Fig. 5, the spatial extent of the blood volume response is better localized than for the flow and oxy- and deoxy-hemoglobin responses. This is consistent with the findings of Culver et al. (2005), Gautama et al. (2003), Leite et al. (2002), Mandeville et al. (2001), Sheth et al. (2004a), and Vanzetta et al. (2004). Oxy- and deoxy- hemoglobin are more spatially extended because of washout down the veins. Flow might be expected to have spatial localization comparable to that of blood volume, depending on the compliant blood volume response of the capillaries and veins, but our results indicate that the arteriolar blood volume change comprises the major portion of the blood volume change. This results in a strong localization of the blood volume response in the arterioles, whereas the blood flow response is uniform across arterioles, capillaries, and venules. The significant contribution of arteriolar dilation to the blood volume response and relatively insignificant venous contribution has been recently observed experimentally (Hillman et al., 2007; Kim et al., 2007; Lee et al., 2001). This is an important issue to be explored further as interpretation of the BOLD signal in functional MRI, particularly post-stimulus behavior, has relied on venous volume changes (Buxton et al., 1998; Kong et al., 2004; Mandeville et al., 1999).
Center-surround negativity
Our VAN model showed that localized arterial dilation induced a chain of passive events in both a center ROI and in the surrounding vessels such that, concurrent with increases in flow and oxy-hemoglobin in the center, there was a smaller decrease in flow and oxy-hemoglobin in the surround (Figs. 5 and 6). Center-surround hemodynamic activity patterns have been measured previously in response to stimuli that activate localized areas of cortex (Devor et al., 2007; Devor et al., 2005; Sheth et al., 2005; Takashima et al., 2001), as have center-surround patterns of blood flow (Cox et al., 1993; Woolsey et al., 1996) and arterial dilation (Devor et al., 2007; Liang et al., 1995). Our model predicted that the observed surround decreases are at least partially due to passive vessel properties that create a local redistribution of blood. However, a comparison with experimental data suggested that the incorporated vessel properties are not sufficient to account for the magnitudes of decrease in the surround (Fig. 10). Several factors may contribute to this discrepancy. The first of these is the active vasoconstriction of arteries and arterioles through activation of the smooth muscles that line them (Devor et al., 2007; Hamel, 2006; Iadecola, 2004; Lauritzen, 2005), or the active changes in the diameter of capillaries (Peppiatt et al., 2006). Active vasoconstriction could be induced by the release of neurotransmitters or neuropeptides, and may be associated with center-surround electrophysiological patterns of activity consisting of center excitation and surround inhibition (Cauli et al., 2004; Derdikman et al., 2003; Devor et al., 2007; Faraci and Breese, 1993; Faraci and Sobey, 1998; Hamel, 2006; Takashima et al., 2001). The second possible factor is the simplicity in our VAN model architecture, which does not fully represent the three-dimensional (3D) asymmetric structure of a branched vascular network. In particular, inclusion of additional draining vessels for each feeding arteriole could increase the magnitude of the surround decreases in oxy-hemoglobin and blood flow. Third is arterial compliance, which is another passive mechanism that has been reported to be coupled to the regulation of blood flow (Behzadi and Liu, 2005). The relative contributions of each of these mechanisms to the timing and magnitude of the observed center-surround activity patterns are likely to be tied to the degree of center activation. A future investigation of the influence of these mechanisms with our VAN model will likely prove its further value as a non-invasive tool to study spatial–temporal neural–vascular coupling.
Future improvements to VAN Model
Despite being a simplified branching network of diverging arterioles and converging venules, the model produced spatio-temporal hemodynamic responses that agree well with experimental observations. Future improvements are needed to better account for the true 3D structure of the vessels from the pial arteries, through the descending arterioles, capillary networks, and ascending veins, up to the pial veins. This will provide information for the lengths of each vascular branch and branching details, including a number of branches and diameter change at each branch. Detailed statistics of these parameters are not provided in the literature, and are likely to vary between brain areas and even within an area (Harrison et al., 2002).
Calculation of the oxygen diffusion into the tissue will be improved by considering the true 3D structure of the vessels, allowing oxygen to diffuse to a given point in the tissue from multiple vascular segments. Our VAN model presently considers an independent tissue compartment for each vascular segment. As such, oxygen is delivered to each tissue compartment from only a single vascular segment. In addition, we fixed the initial tissue PO2 in these compartments with the result that the baseline oxygen delivery (and thus oxygen consumption) of each compartment is different. The 3D structure will allow us to specify baseline oxygen consumption as a function of spatial coordinate to, for instance, account for laminar differences. Measures of the vessel wall thickness will also be important to better model the oxygen flux from vessels to tissue (Eq. (11)). Further insight into the delivery of oxygen to the tissue will come from the comparison of these model predictions with direct experimental observation of vascular and tissue oxygen content as afforded by oxygen-quenched phosphorescent dyes (Dunphy et al., 2002), as utilized by Ances et al. (2001) and Vanzetta and Grinvald (1999).
Finally, Piechnik et al. (2008) have recently published a model of 19 vascular compartments from feeding large arteries to draining large veins based on the statistics of the vascular tree topology. Their model was developed to explore the relationship between cerebral blood flow and volume during CO2 manipulation and thus considers the CO2 reactivity of individual vascular compartments as derived from a review of the literature. The details of this flow–volume relationship is important for calibration of the fMRI BOLD signal to enable quantitative estimate of evoked changes in CMRO2 (Buxton et al., 2004; Davis et al., 1998; Hoge et al., 1999a). While their model is topologically similar to ours, it does not explore the spatio-temporal response of the vessels and oxygenation to the localized modulation of arteriolar diameter and oxygen consumption. Further vascular modeling improvements will follow from combining our spatio-temporal modeling of individual vascular segments with details of the vascular reactivity at different branch levels from Piechnik et al. (2008), and with explicit modeling of the neuronal modulation of arteriole compliance to induce arteriolar diameter changes (Behzadi and Liu, 2005).
Summary
We have developed a vascular anatomical network (VAN) model of blood flow and oxygen delivery based on physically measurable parameters. This model accurately predicts the blood pressure and hemoglobin oxygen saturation at different branch levels of the arterioles, capillaries, and venules. Further, localized arteriole dilation produces a dynamic evolution of blood flow, volume, and oxygenation consistent with experimental studies. The model-predicted spatial characteristics of the blood flow, volume, and oxygenation response reveal a passive surround decrease in flow and oxygenation. This model observation underestimates recent experimental observations of surround negativity suggesting the active role of vasoconstrictive mediators. Interpretation of experimental studies of the neurovascular unit and its response to stimuli will be improved when analyzed within the framework of a VAN model. In particular, we expect to derive a more comprehensive understanding of oxygen delivery to the tissue. Finally, simplistic lumped parameter vascular models, like the balloon and Windkessel models, are providing precise interpretation of the physiological factors driving the hemodynamic response to brain activation, i.e., arteriole dilation and oxygen consumption. This VAN model can be used to help determine the quantitative accuracy of the inferences from these lumped parameter models.
Fig. 7.
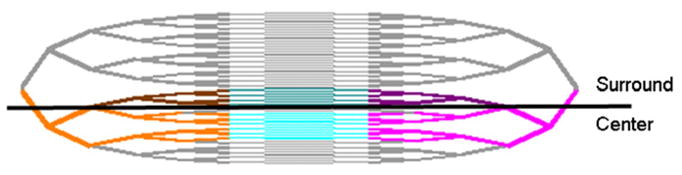
This figure indicates the different regions of interest over which the hemodynamic parameters were averaged. The bright orange, cyan, and magenta indicate the vessel segments averaged for the arterioles, capillaries, and venules, respectively, in the center of the activated region. The darker orange, cyan, and magenta indicate the regions averaged for the surrounding arterioles, capillaries, and venules, respectively.
Acknowledgments
This work was supported by NIH R01EB002482, R01NS051188, R01NS057476, and R01EB000790.
References
- Albeck MJ, Borgesen SE, Gjerris F, Schmidt JF, Sorensen PS. Intracranial pressure and cerebrospinal fluid outflow conductance in healthy subjects. J Neurosurg. 1991;74:597–600. doi: 10.3171/jns.1991.74.4.0597. [DOI] [PubMed] [Google Scholar]
- Alperin NJ, Lee SH, Loth F, Raksin PB, Lichtor T. MR-intracranial pressure (ICP): a method to measure intracranial elastance and pressure noninvasively by means of MR imaging: baboon and human study. Radiology. 2000;217:877–885. doi: 10.1148/radiology.217.3.r00dc42877. [DOI] [PubMed] [Google Scholar]
- Ances BM, Wilson DF, Greenberg JH, Detre JA. Dynamic changes in cerebral blood flow, O2 tension, and calculated cerebral metabolic rate of O2 during functional activation using oxygen phosphorescence quenching. J Cereb Blood Flow Metab. 2001;21:511–516. doi: 10.1097/00004647-200105000-00005. [DOI] [PubMed] [Google Scholar]
- Behzadi Y, Liu TT. An arteriolar compliance model of the cerebral blood flow response to neural stimulus. Neuroimage. 2005;25:1100–1111. doi: 10.1016/j.neuroimage.2004.12.057. [DOI] [PubMed] [Google Scholar]
- Boas DA, Strangman G, Culver JP, Hoge RD, Jasdzewski G, Poldrack RA, Rosen BR, Mandeville JB. Can the cerebral metabolic rate of oxygen be estimated with near-infrared spectroscopy? Phys Med Biol. 2003;48:2405–2418. doi: 10.1088/0031-9155/48/15/311. [DOI] [PubMed] [Google Scholar]
- Buxton RB, Frank LR. A model for the coupling between cerebral blood flow and oxygen metabolism during neural stimulation. J Cereb Blood Flow Metab. 1997;17:64–72. doi: 10.1097/00004647-199701000-00009. [DOI] [PubMed] [Google Scholar]
- Buxton RB, Wong EC, Frank LR. Dynamics of blood flow and oxygenation changes during brain activation: the balloon model. Magn Reson Med. 1998;39:855–864. doi: 10.1002/mrm.1910390602. [DOI] [PubMed] [Google Scholar]
- Buxton RB, Uludag K, Dubowitz DJ, Liu TT. Modeling the hemodynamic response to brain activation. Neuroimage. 2004;23(Suppl 1):S220–S233. doi: 10.1016/j.neuroimage.2004.07.013. [DOI] [PubMed] [Google Scholar]
- Cauli B, Tong XK, Rancillac A, Serluca N, Lambolez B, Rossier J, Hamel E. Cortical GABA interneurons in neurovascular coupling: relays for subcortical vasoactive pathways. J Neurosci. 2004:8940–8949. doi: 10.1523/JNEUROSCI.3065-04.2004. [DOI] [PMC free article] [PubMed] [Google Scholar]
- Cox SB, Woolsey TA, Rovainen CM. J Cereb Blood Flow Metab. 1993. Localized dynamic changes in cortical blood flow with whisker stimulation corresponds to matched vascular and neuronal architecture of rat barrels; pp. 899–913. [DOI] [PubMed] [Google Scholar]
- Culver JP, Siegel AM, Franceschini MA, Mandeville JB, Boas DA. Evidence that cerebral blood volume can provide brain activation maps with better spatial resolution than deoxygenated hemoglobin. Neuroimage. 2005;27:947–959. doi: 10.1016/j.neuroimage.2005.05.052. [DOI] [PubMed] [Google Scholar]
- Davis TL, Kwong KK, Weisskoff RM, Rosen BR. Calibrated functional MRI: mapping the dynamics of oxidative metabolism. Proc Natl Acad Sci U S A. 1998;95:1834–1839. doi: 10.1073/pnas.95.4.1834. [DOI] [PMC free article] [PubMed] [Google Scholar]
- Deneux T, Faugeras O. Using nonlinear models in fMRI data analysis: model selection and activation detection. Neuroimage. 2006;32:1669–1689. doi: 10.1016/j.neuroimage.2006.03.006. [DOI] [PubMed] [Google Scholar]
- Derdikman D, Hildesheim R, Ahissar E, Arieli A, Grinvald A. J Neurosci. 2003. Imaging spatiotemporal dynamics of surround inhibition in the barrels somatosensory cortex; pp. 3100–3105. [DOI] [PMC free article] [PubMed] [Google Scholar]
- Devor A, Ulbert I, Dunn AK, Narayanan SN, Jones SR, Andermann ML, Boas DA, Dale AM. Coupling of the cortical hemodynamic response to cortical and thalamic neuronal activity. Proc Natl Acad Sci U S A. 2005;102:3822–3827. doi: 10.1073/pnas.0407789102. [DOI] [PMC free article] [PubMed] [Google Scholar]
- Devor A, Tian P, Nishimura N, Teng IC, Hillman EM, Narayanan SN, Ulbert I, Boas DA, Kleinfeld D, Dale AM. Suppressed neuronal activity and concurrent arteriolar vasoconstriction may explain negative blood oxygenation level-dependent signal. J Neurosci. 2007;27:4452–4459. doi: 10.1523/JNEUROSCI.0134-07.2007. [DOI] [PMC free article] [PubMed] [Google Scholar]
- Dunn AK, Devor A, Dale AM, Boas DA. Spatial extent of oxygen metabolism and hemodynamic changes during functional activation of the rat somatosensory cortex. Neuroimage. 2005;27:279–290. doi: 10.1016/j.neuroimage.2005.04.024. [DOI] [PubMed] [Google Scholar]
- Dunphy I, Vinogradov SA, Wilson DF. Oxyphor R2 and G2: phosphors for measuring oxygen by oxygen-dependent quenching of phosphorescence. Anal Biochem. 2002;310:191–198. doi: 10.1016/s0003-2697(02)00384-6. [DOI] [PubMed] [Google Scholar]
- Duong TQ, Kim SG. In vivo MR measurements of regional arterial and venous blood volume fractions in intact rat brain. Magn Reson Med. 2000;43:393–402. doi: 10.1002/(sici)1522-2594(200003)43:3<393::aid-mrm11>3.0.co;2-k. [DOI] [PubMed] [Google Scholar]
- Faraci FM, Sobey CG. Role of potassium channels in regulation of cerebral vascular tone. J Cereb Blood Flow Metab. 1998:1047–1063. doi: 10.1097/00004647-199810000-00001. [DOI] [PubMed] [Google Scholar]
- Faraci FM, Breese KR. Nitric oxide mediates vasodilatation in response to activation of N-methyl-D-aspartate receptors in brain. Circ Res. 1993:476–480. doi: 10.1161/01.res.72.2.476. [DOI] [PubMed] [Google Scholar]
- Fox PT, Raichle ME. Focal physiological uncoupling of cerebral blood flow and oxidative metabolism during somatosensory stimulation in human subjects. Proc Natl Acad Sci U S A. 1986;83:1140–1144. doi: 10.1073/pnas.83.4.1140. [DOI] [PMC free article] [PubMed] [Google Scholar]
- Gautama T, Mandic DP, Van Hulle MM. Signal nonlinearity in fMRI: a comparison between BOLD and MION. IEEE Trans Med Imag. 2003;22:636–644. doi: 10.1109/TMI.2003.812248. [DOI] [PubMed] [Google Scholar]
- Gjedde A, Poulsen PH, Ostergaard L. On the oxygenation of hemoglobin in the human brain. Adv Exp Med Biol. 1999;471:67–81. doi: 10.1007/978-1-4615-4717-4_9. [DOI] [PubMed] [Google Scholar]
- Habler OP, Messmer KF. The physiology of oxygen transport. Transfus Sci. 1997;18:425–435. doi: 10.1016/S0955-3886(97)00041-6. [DOI] [PubMed] [Google Scholar]
- Haidekker MA, Tsai AG, Brady T, Stevens HY, Frangos JA, Theodorakis E, Intaglietta M. A novel approach to blood plasma viscosity measurement using fluorescent molecular rotors. Am J Physiol Heart Circ Physiol. 2002;282:H1609–H1614. doi: 10.1152/ajpheart.00712.2001. [DOI] [PubMed] [Google Scholar]
- Hamel E. Perivascular nerves and the regulation of cerebrovascular tone. J Appl Physiol. 2006;100:1059–1064. doi: 10.1152/japplphysiol.00954.2005. [DOI] [PubMed] [Google Scholar]
- Harel N, Lee SP, Nagaoka T, Kim DS, Kim SG. Origin of negative blood oxygenation level-dependent fMRI signals. J Cereb Blood Flow Metab. 2002;22:908–917. doi: 10.1097/00004647-200208000-00002. [DOI] [PubMed] [Google Scholar]
- Harrison RV, Harel N, Panesar J, Mount RJ. Blood capillary distribution correlates with hemodynamic-based functional imaging in cerebral cortex. Cereb Cortex. 2002;12:225–233. doi: 10.1093/cercor/12.3.225. [DOI] [PubMed] [Google Scholar]
- Herman P, Trubel HK, Hyder F. A multiparametric assessment of oxygen efflux from the brain. J Cereb Blood Flow Metab. 2006;26:79–91. doi: 10.1038/sj.jcbfm.9600165. [DOI] [PubMed] [Google Scholar]
- Hillman EM, Devor A, Bouchard MB, Dunn AK, Krauss GW, Skoch J, Bacskai BJ, Dale AM, Boas DA. Depth-resolved optical imaging and microscopy of vascular compartment dynamics during somatosensory stimulation. Neuroimage. 2007;35:89–104. doi: 10.1016/j.neuroimage.2006.11.032. [DOI] [PMC free article] [PubMed] [Google Scholar]
- Hoge RD, Atkinson J, Gill B, Crelier GR, Marrett S, Pike GB. Investigation of BOLD signal dependence on cerebral blood flow and oxygen consumption: the deoxyhemoglobin dilution model. Magn Reson Med. 1999a;42:849–863. doi: 10.1002/(sici)1522-2594(199911)42:5<849::aid-mrm4>3.0.co;2-z. [DOI] [PubMed] [Google Scholar]
- Hoge RD, Atkinson J, Gill B, Crelier GR, Marrett S, Pike GB. Linear coupling between cerebral blood flow and oxygen consumption in activated human cortex. Proc Natl Acad Sci U S A. 1999b;96:9403–9408. doi: 10.1073/pnas.96.16.9403. [DOI] [PMC free article] [PubMed] [Google Scholar]
- Hoge RD, Franceschini MA, Covolan RJ, Huppert T, Mandeville JB, Boas DA. Simultaneous recording of task-induced changes in blood oxygenation, volume, and flow using diffuse optical imaging and arterial spin-labeling MRI. Neuroimage. 2005;25:701–707. doi: 10.1016/j.neuroimage.2004.12.032. [DOI] [PubMed] [Google Scholar]
- Hudetz AG. Blood flow in the cerebral capillary network: a review emphasizing observations with intravital microscopy. Microcirculation. 1997;4:233–252. doi: 10.3109/10739689709146787. [DOI] [PubMed] [Google Scholar]
- Huppert TJ, Allen MS, Benav H, Jones PB, Boas DA. A multicompartment vascular model for inferring baseline and functional changes in cerebral oxygen metabolism and arterial dilation. J Cereb Blood Flow Metab. 2007;27:1262–1279. doi: 10.1038/sj.jcbfm.9600435. [DOI] [PMC free article] [PubMed] [Google Scholar]
- Iadecola C. Neurovascular regulation in the normal brain and in Alzheimer’s disease. Nat Rev, Neurosci. 2004;5:347–360. doi: 10.1038/nrn1387. [DOI] [PubMed] [Google Scholar]
- Jones M, Berwick J, Johnston D, Mayhew J. Concurrent optical imaging spectroscopy and laser-Doppler flowmetry: the relationship between blood flow, oxygenation, and volume in rodent barrel cortex. Neuroimage. 2001;13:1002–1015. doi: 10.1006/nimg.2001.0808. [DOI] [PubMed] [Google Scholar]
- Jones M, Berwick J, Mayhew J. Changes in blood flow, oxygenation, and volume following extended stimulation of rodent barrel cortex. Neuroimage. 2002;15:474–487. doi: 10.1006/nimg.2001.1000. [DOI] [PubMed] [Google Scholar]
- Kastrup A, Kruger G, Neumann-Haefelin T, Glover GH, Moseley ME. Changes of cerebral blood flow, oxygenation, and oxidative metabolism during graded motor activation. Neuroimage. 2002;15:74–82. doi: 10.1006/nimg.2001.0916. [DOI] [PubMed] [Google Scholar]
- Kelman GR. Digital computer subroutine for the conversion of oxygen tension into saturation. J Appl Physiol. 1966;21:1375–1376. doi: 10.1152/jappl.1966.21.4.1375. [DOI] [PubMed] [Google Scholar]
- Kida I, Kennan RP, Rothman DL, Behar KL, Hyder F. High- resolution CMR(O2) mapping in rat cortex: a multiparametric approach to calibration of BOLD image contrast at 7 Tesla. J Cereb Blood Flow Metab. 2000;20:847–860. doi: 10.1097/00004647-200005000-00012. [DOI] [PubMed] [Google Scholar]
- Kim T, Hendrich KS, Masamoto K, Kim SG. Arterial versus total blood volume changes during neural activity-induced cerebral blood flow change: implication for BOLD fMRI. J Cereb Blood Flow Metab. 2007;27:1235–1247. doi: 10.1038/sj.jcbfm.9600429. [DOI] [PubMed] [Google Scholar]
- Kleinfeld D, Mitra PP, Helmchen F, Denk W. Fluctuations and stimulus-induced changes in blood flow observed in individual capillaries in layers 2 through 4 of rat neocortex. Proc Natl Acad Sci U S A. 1998;95:15741–15746. doi: 10.1073/pnas.95.26.15741. [DOI] [PMC free article] [PubMed] [Google Scholar]
- Kong Y, Zheng Y, Johnston D, Martindale J, Jones M, Billings S, Mayhew J. A model of the dynamic relationship between blood flow and volume changes during brain activation. J Cereb Blood Flow Metab. 2004;24:1382–1392. doi: 10.1097/01.WCB.0000141500.74439.53. [DOI] [PubMed] [Google Scholar]
- Lauritzen M. Nat Rev Neurosci. 2005. Reading vascular changes in brain imaging: is dendritic calcium the key? pp. 77–85. [DOI] [PubMed] [Google Scholar]
- Lee SP, Duong TQ, Yang G, Iadecola C, Kim SG. Relative changes of cerebral arterial and venous blood volumes during increased cerebral blood flow: implications for BOLD fMRI. Magn Reson Med. 2001;45:791–800. doi: 10.1002/mrm.1107. [DOI] [PubMed] [Google Scholar]
- Leite FP, Tsao D, Vanduffel W, Fize D, Sasaki Y, Wald LL, Dale AM, Kwong KK, Orban GA, Rosen BR, Tootell RB, Mandeville JB. Repeated fMRI using iron oxide contrast agent in awake, behaving macaques at 3 Tesla. Neuroimage. 2002;16:283–294. doi: 10.1006/nimg.2002.1110. [DOI] [PubMed] [Google Scholar]
- Leontiev O, Buxton RB. Reproducibility of BOLD, perfusion, and CMRO2 measurements with calibrated-BOLD fMRI. Neuroimage. 2007;35:175–184. doi: 10.1016/j.neuroimage.2006.10.044. [DOI] [PMC free article] [PubMed] [Google Scholar]
- Liang GE, Thompson BP, Erinjeri JP, Liu D, Rovainen CM, Woolsey TA. RBC flow and vessel diameter changes with stimulation of rat whisker barrel cortex. Microcirculation. 1995;96 [Google Scholar]
- Lipowsky HH. Microvascular rheology and hemodynamics. Microcirculation. 2005;12:5–15. doi: 10.1080/10739680590894966. [DOI] [PubMed] [Google Scholar]
- Lipowsky HH, Usami S, Chien S, Pittman RN. Hematocrit determination in small bowel bore tubes from optical density measurements under white light illumination. Microvasc Res. 1980;20:51–70. doi: 10.1016/0026-2862(80)90019-9. [DOI] [PubMed] [Google Scholar]
- Mandeville JB, Marota JJ, Ayata C, Zaharchuk G, Moskowitz MA, Rosen BR, Weisskoff RM. Evidence of a cerebrovascular postarteriole Windkessel with delayed compliance. J Cereb Blood Flow Metab. 1999;19:679–689. doi: 10.1097/00004647-199906000-00012. [DOI] [PubMed] [Google Scholar]
- Mandeville JB, Jenkins BG, Kosofsky BE, Moskowitz MA, Rosen BR, Marota JJ. Regional sensitivity and coupling of BOLD and CBV changes during stimulation of rat brain. Magn Reson Med. 2001;45:443–447. doi: 10.1002/1522-2594(200103)45:3<443::aid-mrm1058>3.0.co;2-3. [DOI] [PubMed] [Google Scholar]
- Obata T, Liu TT, Miller KL, Luh WM, Wong EC, Frank LR, Buxton RB. Discrepancies between BOLD and flow dynamics in primary and supplementary motor areas: application of the balloon model to the interpretation of BOLD transients. Neuroimage. 2004;21:144–153. doi: 10.1016/j.neuroimage.2003.08.040. [DOI] [PubMed] [Google Scholar]
- Peppiatt CM, Howarth C, Mobbs P, Attwell D. Bidirectional control of CNS capillary diameter by pericytes. Nature. 2006:700–704. doi: 10.1038/nature05193. [DOI] [PMC free article] [PubMed] [Google Scholar]
- Piechnik SK, Chiarelli PA, Jezzard P. Modelling vascular reactivity to investigate the basis of the relationship between cerebral blood volume and flow under CO(2) manipulation. Neuroimage. 2008;39:107–118. doi: 10.1016/j.neuroimage.2007.08.022. [DOI] [PubMed] [Google Scholar]
- Popel AS, Pittman RN, Ellsworth ML. Rate of oxygen loss from arterioles is an order of magnitude higher than expected. Am J Physiol. 1989;256:H921–H924. doi: 10.1152/ajpheart.1989.256.3.H921. [DOI] [PubMed] [Google Scholar]
- Pries AR, Neuhaus D, Gaehtgens P. Blood viscosity in tube flow: dependence on diameter and hematocrit. Am J Physiol. 1992;263:H1770–H1778. doi: 10.1152/ajpheart.1992.263.6.H1770. [DOI] [PubMed] [Google Scholar]
- Riera J, Aubert E, Iwata K, Kawashima R, Wan X, Ozaki T. Fusing EEG and fMRI based on a bottom-up model: inferring activation and effective connectivity in neural masses. Philos Trans R Soc Lond, B Biol Sci. 2005;360:1025–1041. doi: 10.1098/rstb.2005.1646. [DOI] [PMC free article] [PubMed] [Google Scholar]
- Severinghaus JW. Simple, accurate equations for human blood O2 dissociation computations. J Appl Physiol. 1979;46:599–602. doi: 10.1152/jappl.1979.46.3.599. [DOI] [PubMed] [Google Scholar]
- Sheth SA, Nemoto M, Guiou M, Walker M, Pouratian N, Hageman N, Toga AW. Columnar specificity of microvascular oxygenation and volume responses: implications for functional brain mapping. J Neurosci. 2004a;24:634–641. doi: 10.1523/JNEUROSCI.4526-03.2004. [DOI] [PMC free article] [PubMed] [Google Scholar]
- Sheth SA, Nemoto M, Guiou M, Walker M, Pouratian N, Toga AW. Linear and nonlinear relationships between neuronal activity, oxygen metabolism, and hemodynamic responses. Neuron. 2004b;42:347–355. doi: 10.1016/s0896-6273(04)00221-1. [DOI] [PubMed] [Google Scholar]
- Sheth SA, Nemoto M, Guiou MW, Walker MA, Toga AW. Spatiotemporal evolution of functional hemodynamic changes and their relationship to neuronal activity. J Cereb Blood Flow Metab. 2005:830–841. doi: 10.1038/sj.jcbfm.9600091. [DOI] [PubMed] [Google Scholar]
- Shmuel A, Yacoub E, Pfeuffer J, Van de Moortele PF, Adriany G, Hu X, Ugurbil K. Sustained negative BOLD, blood flow and oxygen consumption response and its coupling to the positive response in the human brain. Neuron. 2002;36:1195–1210. doi: 10.1016/s0896-6273(02)01061-9. [DOI] [PubMed] [Google Scholar]
- Takashima I, Kajiwara R, Iijima T. Voltage-sensitive dye versus intrinsic signal optical imaging: comparison of optically determined functional maps from rat barrel cortex. Neuroreport. 2001;12:2889–2894. doi: 10.1097/00001756-200109170-00027. [DOI] [PubMed] [Google Scholar]
- Toda N, Okamura T. Cerebral vasodilators. Jpn J Pharmacol. 1998;76:349–367. doi: 10.1254/jjp.76.349. [DOI] [PubMed] [Google Scholar]
- Turner R. How much cortex can a vein drain? Downstream dilution of activation-related cerebral blood oxygenation changes. Neuroimage. 2002;16:1062–1067. doi: 10.1006/nimg.2002.1082. [DOI] [PubMed] [Google Scholar]
- Vanzetta I, Grinvald A. Increased cortical oxidative metabolism due to sensory stimulation: implications for functional brain imaging. Science. 1999;286:1555–1558. doi: 10.1126/science.286.5444.1555. [DOI] [PubMed] [Google Scholar]
- Vanzetta I, Slovin H, Omer DB, Grinvald A. Columnar resolution of blood volume and oximetry functional maps in the behaving monkey; implications for FMRI. Neuron. 2004;42:843–854. doi: 10.1016/j.neuron.2004.04.004. [DOI] [PubMed] [Google Scholar]
- Villringer A, Them A, Lindauer U, Einhaupl K, Dirnagl U. Capillary perfusion of the rat brain cortex. Circ Res. 1994;75:55–62. doi: 10.1161/01.res.75.1.55. [DOI] [PubMed] [Google Scholar]
- Vovenko E. Distribution of oxygen tension on the surface of arterioles, capillaries and venules of brain cortex and in tissue in normoxia: an experimental study on rats. Pflugers Arch. 1999;437:617–623. doi: 10.1007/s004240050825. [DOI] [PubMed] [Google Scholar]
- Washburn EW. The dynamics of capillary flow. Phys Rev Lett. 1921;12:273–283. [Google Scholar]
- Woolsey TA, Rovainen CM, Cox SB, Henegar MH, Liang GE, Liu D, Moskalenko YE, Sui J, Wei L. Neuronal units linked to microvascular modules in cerebral cortex: response elements for imaging the brain. Cereb Cortex. 1996;6:647–660. doi: 10.1093/cercor/6.5.647. [DOI] [PubMed] [Google Scholar]
- Zheng Y, Martindale J, Johnston D, Jones M, Berwick J, Mayhew J. A model of the hemodynamic response and oxygen delivery to brain. Neuroimage. 2002;16:617–637. doi: 10.1006/nimg.2002.1078. [DOI] [PubMed] [Google Scholar]
- Zheng Y, Johnston D, Berwick J, Chen D, Billings S, Mayhew J. A three-compartment model of the hemodynamic response and oxygen delivery to brain. Neuroimage. 2005;28:925–939. doi: 10.1016/j.neuroimage.2005.06.042. [DOI] [PubMed] [Google Scholar]
- Zweifach BW. Quantitative studies of microcirculatory structure and function: I. Analysis of pressure distribution in the terminal vascular bed in cat mesentery. Circ Res. 1974;34:843–857. [PubMed] [Google Scholar]