Abstract
In a previous work, we found that liposome hydrophobicity could affect deoxyribonucleic acid (DNA) association efficiency. Now, we have focused on the possible correlation between liposome hydrophobicity and DNA conformation. DNA lyophilized with cationic vesicles with high hydrophobicity changes its conformation into a more condensed form, probably the C form. With noncharged vesicles, it changes its conformation from B to a partial A form. These results contribute to a better understanding of the interaction between DNA and lipids, suggesting there is direct relationship between hydrophobicity and DNA conformation changes: The higher the hydrophobicity factor, the more pronounced the changes in DNA form, to a more condensed form.
Keywords: Cationic liposomes, Circular dichroism, DNA conformation, Hydrophobicity, Noncharged liposomes
Introduction
Deoxyribonucleic acid (DNA) is made of two complementary polymer nucleotide chains held together by hydrogen bonds. The backbone is formed by ribose molecules linked together by phosphodiester bonds, and the bases are covalently bonded to the ribose. Due to its highly charged density, the DNA molecule shows different physical behaviors, mainly attributed to electrostatic, Van-der-Waals, and entropic forces [1–3].
The distance between the base pairs is larger than their thickness. However, since the backbone can rotate freely due to the connection between ribose and phosphodiester, the chains twist around each other to minimize the exposure of the hydrophobic base pairs and maximize the exposure of the hydrophilic phosphodiester bonds [4]. The most common conformation is the B form, a right-handed double helix with 10 bp per turn [5]. The A form is also right-handed, but it has 11 bp per turn and a slightly different disposition of base pairs around the helix axis [6]. A less common right-handed conformation is the C form, which is adopted by DNA in high salt and dehydration conditions; it has 28 bp in three full turns of the helix [7].
Lipid molecules are insoluble in water and soluble in organic solvents. When a highly concentrated lipid is immersed in water, it forms a bilayer or micelle to minimize the exposure of the hydrophobic tails. To protect also the borders of the bilayer, it can form a preserved compartment called a vesicle [4].
These vesicles can be combined with DNA and used to deliver DNA into cells. They are the starting point for any design in a gene therapy approach. The outstanding prospect of gene therapy led to a number of publications on experimental [2, 3, 8] and theoretical [9, 10] issues related to DNA–lipid complexes.
The main problem in gene therapy remains to find the most efficient way to deliver DNA into cells [11].
Viral systems have elaborate machinery for infection, which would make them very useful as DNA carriers. However, they can trigger a strong immune response, transport only a limited number of base pairs, and cause several safety problems. Conversely, DNA–lipid vector systems are unlimited in size, easy to produce, and safe from the point of view of construction since they can be made of natural lipids. On the other hand, they show expression during short periods of time and poor integration into the host chromosome. Several methods are being developed to overcome these problems and find the ideal combination of molecular vector design and lipid formulation composition.
Assays on the structure characterization of the complexes showed a wide variety of arrangements depending on DNA concentration and lipid charge. The distance between the two bilayers is equal to the diameter of the DNA rod plus a hydration shell. Light-scattering experiments showed that the largest complexes were found at the isoelectric point, in agreement with the notion of charge stabilization. In a solution of DNA with cationic and neutral lipids also containing lipids that confer a negative curvature at the water interface, an inverted hexagonal phase was observed. This structure proved to be very effective in gene therapy applications [3].
Circular dichroism (CD) is a very useful tool to analyze the conformation of molecules such as proteins and DNA. It is based on the difference of absorption between left-handed and right-handed circularly polarized light [12]. CD has been intensively used in lipid–DNA systems to study the changes adopted by DNA conformation in contact with lipids [13, 14].
The aim of this study was to find a correlation between DNA conformation and liposome hydrophobicity factor (HF). CD spectroscopy was performed to determine DNA conformation, and membrane hydration was measured to estimate the HF.
Materials and Methods
Materials
1,2-Dimyristoyl-sn-glycero-3-phosphoethanolamine (DMPE) and chicken egg yolk phosphocholine (EPC) were obtained from Avanti Polar Lipids, Alabaster, AL, USA. 2-Dioleoyl-3-trimethylammonium-propane (DOTAP) and 1,2-dioleoyl-sn-glycero-3-phosphoethanolamine (DOPE) were purchased from Northern Lipids, London, UK. Cholesterol (Chol) was from Riedel de Häen.
Products used in molecular biology assays were from Gibco. Enzymes used in cloning procedures were from Amersham. All other reagents were of analytical grade.
Liposome Preparation and Association of Plasmid DNA
The formulations used were: noncharged liposomes (EPC/DMPE/CHOL, 2:2:1 mol) and cationic liposomes (EPC/DOPE/DOTAP, 16:8:1 mol) [15]. Plasmid DNA PGEMT-VP7 (3,850 bp) used in this study was synthesized in our laboratory [16]. Liposome preparation and plasmid DNA association in small unilamellar vesicles (SUVs) were performed as previously described [16]. Briefly, DNA and liposomes are mixed together and then incubated overnight at −80°C. After incubation, the lyophilization process is carried out in order to improve DNA/lipid interaction. DNA used as control (without liposomes) is also lyophilized.
Normally, nonassociated DNA is separated by Ficoll gradient [16]; the samples used for CD did not come from a Ficoll gradient, due to scattering issues.
Determination of Hydrophobic Factor
The HF was determined as the ratio between absorbance at 570 and 500 nm of the probe Merocyanine 540 (MC540) as previously described [16].
Circular Dichroism Spectroscopy
In order to determine changes in DNA conformation, plasmid DNA pGEMT-VP7 was mixed with increasing concentrations of noncharged and cationic liposomes, and CD spectra were recorded.
Data Analysis
A mean of five independent assays were carried out for each concentration. Analyses were performed using Microcal Origin 7.0 software. Spectral smoothing was performed using the Savitsky–Golay function.
For band analysis, mean ± SD was calculated, and data with and without DNA were compared using analysis of variance and Tukey’s test. Differences were considered significant when p ≤ 0.05.
Results and Discussion
In order to analyze the effect of lipids on DNA conformation, the CD spectra of plasmid DNA associated with different lipid concentrations were recorded.
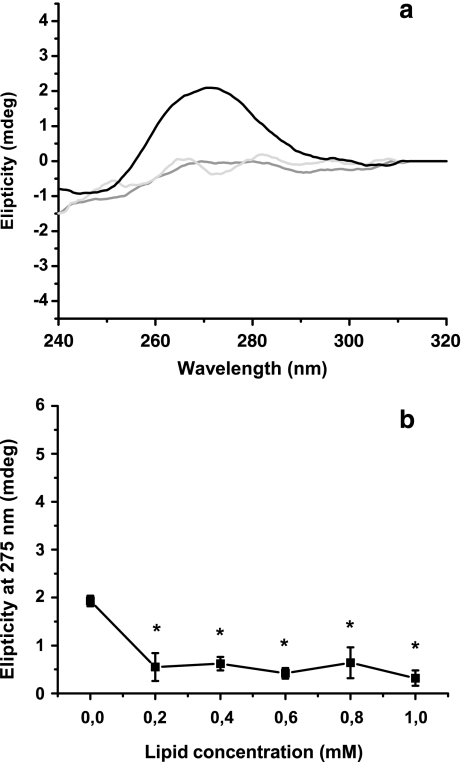
CD spectra for the B form were obtained in a low-salt aqueous buffer, whereas CD spectra for the A form were induced adding 20% ethanol. Spectra for control B and A forms were significantly different from spectra obtained for DNA/cationic liposome mixtures. DNA without lipids showed a 275-nm positive band, which disappeared when cationic liposomes were added (Fig. 1a). The final DNA conformation obtained could not be expressed as a linear combination of B and A forms, and it seemed to correspond to a more condensed conformation similar to C form. Zuidam et al. [13] characterized DNA conformation associated with cationic liposomes as the C form, which is more condensed than the B form. The C form has 28 bp in three full turns of the helix [7], whereas the A form has 11 bp per one turn of the double helix, and the B form has 10 bp per one turn of the double helix (Fig. 1b). Zuidam et al. [13] obtained the C form with human growth hormone expression vector, which is used in this paper for comparison. They also found a B to C change upon interaction of DNA with cationic liposomes, which is similar to our results, namely the absence of the 270-nm band as in Fig. 1.
Fig. 1.
Changes in circular dichroism spectra induced by cationic liposomes. Plasmid DNA pGEMT-VP7 was mixed with increasing concentrations of liposomes. The DNA/liposome systems obtained were lyophilized and then rehydrated in 10 mM Tris–HCl, pH 7.4, containing 154 mM NaF. CD spectra were recorded in a JASCO J-810 spectropolarimeter using a quartz cuvette with a 0.5-cm optic path. During the assay, the temperature was kept at 20°C. a CD spectroscopy between 220 and 320 nm was performed for 0.010 mg DNA mixed with 0 (black line), 0.2 (gray line), and 1.0 mM (light gray line) cationic lipids (0.4, 0.6, and 0.8 mM lipid concentrations were excluded from the graph in order to clarify observations) and b changes in the 275-nm band as a function of lipid concentration. Data were expressed as mean of five experiments ± SD, and differences between groups were tested using the hypothesis test. Data denoted with an asterisk were significantly different with respect to DNA without liposomes (p < 0.05)
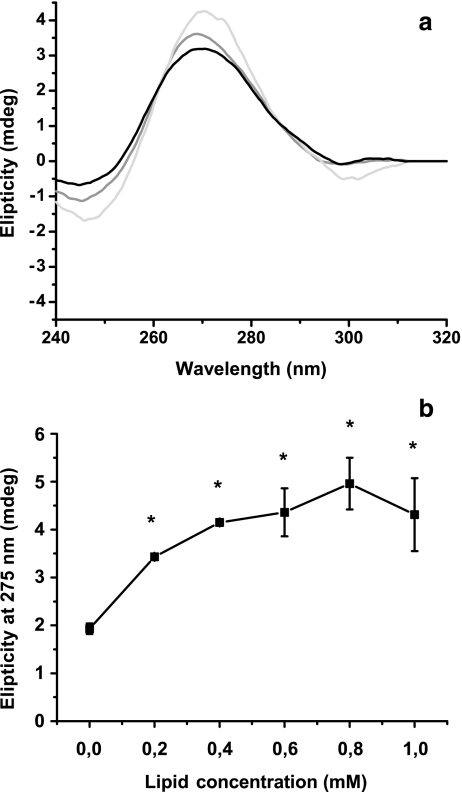
When DNA was lyophilized in the presence of noncharged liposomes, the 275-nm band increased (Fig. 2), probably due to a conformational transition from the B to A form [17]. Although this increase was different from the one observed in DNA without liposomes, it was lower than values reported by other authors [17]. The transition could be attributed to an intermediate state between B and A forms, or it is possible that part of the signal corresponding to the noncharged liposomes’ CD spectrum is due to nonassociated DNA, since this formulation can associate 38% of the DNA [16], but we note that the elipticity calculations are also significantly different from the control (lyophilized DNA without liposomes, as shown in Fig. 2b).
Fig. 2.
Changes in circular dichroism induced by noncharged liposomes. Experimental conditions are detailed in Fig. 1. a CD spectroscopy between 220 and 320 nm was performed for 0.010 mg DNA mixed with 0 (black line), 0.2 (gray line), and 1.0 mM (light gray line) noncharged lipids (0.4, 0.6, and 0.8 mM lipid concentrations were excluded from the graph in order to clarify observations) and b changes in the 275-nm band as a function of lipid concentration. Data were expressed as mean of five experiments ± SD, and differences between groups were tested using the hypothesis test. Data denoted with an asterisk were significantly different with respect to DNA without liposomes (p < 0.05)
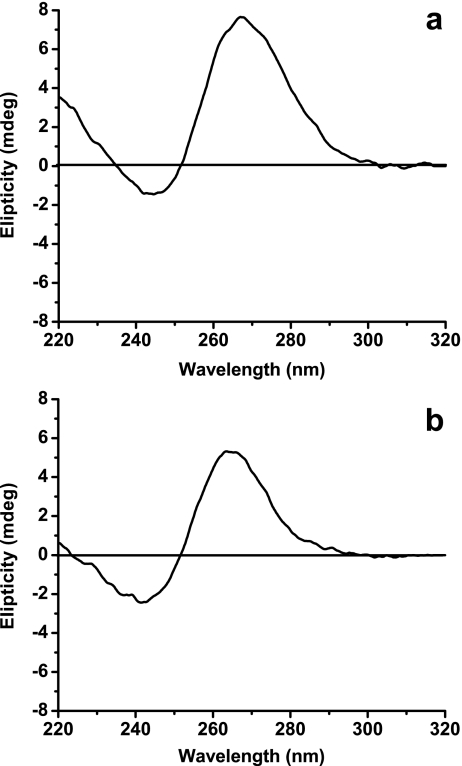
To analyze the percentage of DNA in the A form, singular value decomposition least square analysis was performed, according to Zhu et al. [18]. Results described in Table 1 showed that 20% of the DNA changed to the A form at the highest lipid concentration, while the rest remained in the B form. Spectra of the A form is shown in Fig. 3a, and that of the B form in is shown in Fig. 3b.
Table 1.
Analysis of DNA conformation
| Liposome concentration (mM) | A form percentage (%) |
|---|---|
| 0.2 | 9 |
| 0.4 | 2 |
| 0.6 | 10 |
| 0.8 | 18 |
| 1 | 20 |
Singular value decomposition least square analysis was performed with EXCEL Solver. The percentage of B and A forms were calculated in spectra from DNA associated with noncharged liposomes
Fig. 3.
CD spectra of A and B forms of plasmid DNA pGEMT-VP7. a The A form was obtained in buffer Tris–HCl 10 mM, with ethanol 20% v/v. b The B form was obtained in buffer Tris–HCl (10 mM) with NaF (154 mM)
Zuidam et al. [13] reported that DNA ellipticity did not change significantly in noncharged vesicles, which agrees with our results. They also demonstrated that when DNA interacts with DOTAP, liposomes suffer a transition from the B to C form. This also agrees with our results, since spectra obtained with cationic lipids were not the A or B form but could correspond to the C form.
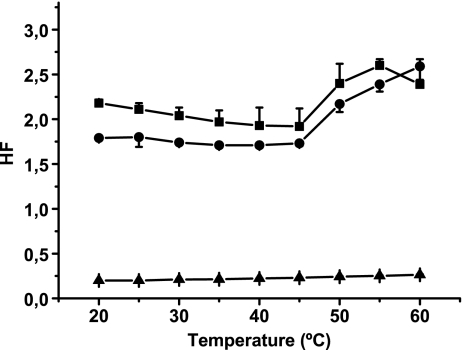
DNA condensation caused by the interaction with cationic liposomes could be expected since there was a high positive charge density and a reduced relative hydration near the vesicle interface. Akao et al. [19] reported that lipid fluidity in the bilayer is an important factor in changes related to DNA conformation: the higher the fluidity, the deeper the changes. These observations were partially confirmed and extended for temperature behavior through measurement of the hydrophobicity factor (HF). HF was determined to find if there was also a relation between DNA conformation and HF changes. We found that deeper DNA conformational changes, followed by CD, were observed in bilayers with higher HF.
From previous work [16], we know that the efficiency of DNA association with noncharged liposomes is 38%, while for cationic liposomes it is 66%; these results are in accordance with the results obtained by CD. There was less DNA condensation for noncharged compared with charged liposomes. According to Fig. 2a, the elipticity increased moderately, and changes are significantly different with respect to lyophilized DNA with no liposomes (Fig. 2b). This is consistent with a B to A passage for DNA associated with noncharged/charged liposomes.
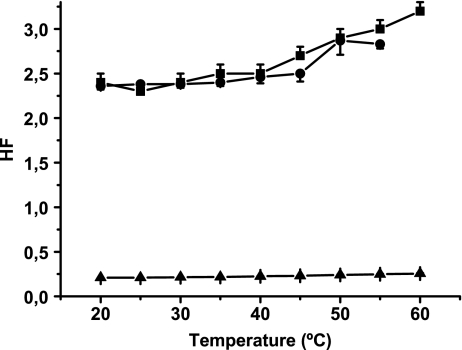
Membrane fluidity was studied spectrophotometrically using the fluorescent probe MC540. Data obtained showed that cationic liposomes were the most hydrophobic; that is, they showed the highest HF (Fig. 4). No differences were observed in the HF of cationic liposomes with and without DNA.
Fig. 4.
HF determination in cationic liposomes. MC540 stock concentration was approximately 0.5 mg/ml. The probe was added to a final lipid concentration of 0.1 mg/ml. The lipid/probe ratio was maintained at 160:1, and the sample was allowed to equilibrate for 10 min at a selected temperature (20°C to 60°C). The A570/A500 ratio (HF) was determined for liposomes (squares), liposomes mixed with DNA, 100:1 lipid/DNA mass ratio (circles), and DNA without liposomes (triangles). Lipid/MC540 molar ratio was 160:1, and lipid/DNA mass ratio was 100:1. Results are expressed as the mean of five experiments ± SD
When DNA was mixed with cationic liposomes, the HF showed no significant changes, possibly because the system was saturated with the probe and thus the interaction with DNA became a secondary choice.
Noncharged liposomes showed a relatively high HF (Fig. 5), probably due to EPC-unsaturated lipids. The interaction with DNA blocked the entrance of the probe, thus causing the decrease in HF during the gel phase. At temperatures higher than the transi-/break tion temperature of DMPE (50°C), however, DNA did not significantly change the membrane HF.
Fig. 5.
HF determination in noncharged liposomes. Experimental conditions were the same as described in Fig. 3. The A570/A500 ratio (HF) was determined for liposomes (squares), liposomes mixed with DNA, 100:1 lipid/DNA mass ratio (circles), and DNA without liposomes (triangles). Lipid/MC540 molar ratio was 160:1, and lipid/DNA mass ratio was 100:1. Results are expressed as the mean of five experiments ± SD
The results obtained are not surprising taking into account that cationic liposomes have lower transition temperatures. Since they have DOPE (transition temperature, Tt = 38°C) in their formulation, they present higher fluidity than noncharged vesicles, which contain DMPE (transition temperature, Tt = 50°C). Moreover, DOPE has insaturations that allowed water molecules to penetrate the bilayer. Bennett et al. [20] suggested that lipids containing oleoyl groups have more lipid-associated water than those containing myristoyl groups. This agrees with the decrease in HF found in noncharged liposomes when compared with cationic vesicles.
Savva et al. [21] found correlations between membrane hydration and transfection activity, demonstrating that lipid hydration is a very important parameter that affects transfection efficiency.
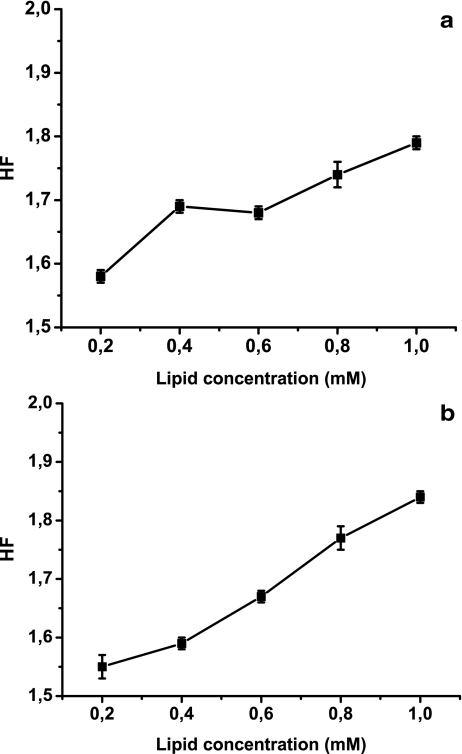
To confirm whether there is a direct influence of lipid concentration on DNA conformational changes, the HF of DNA/lipid mixtures was determined using variable amounts of lipids. Previous results from our laboratory [16] indicated that the hydrophobicity of liposome systems affects the efficiency of DNA association. To elucidate whether the changes were due to the interaction with DNA instead of reactions between lipids and probe excess, assays were carried out maintaining a constant ratio between lipids and MC540 (160:1, mol/mol). Results showed that HF increased at higher lipid concentrations (Fig. 6). This could be due to the fact that, as lipid concentration increases, the ratio between lipid and DNA also increases, and thus surface hydrophobic defects could not be blocked by DNA, allowing the probe to penetrate the bilayer deeper.
Fig. 6.
HF determination for different liposome concentrations. The lipid/probe ratio was maintained at 160:1, and samples were allowed to equilibrate at 20°C for 10 min. The A570/A500 ratio (HF) was determined at 20°C for different concentrations of cationic liposomes (a) and noncharged liposomes (b). DNA concentration was 0.010 mg, and liposome concentrations varied from 0.2 to 1 mM. Results are expressed as the mean of five experiments ± SD
Conclusions
A previous study carried out in or laboratory demonstrated that the increase in liposome hydrophobicity was related to higher DNA association efficiency [16]. This new study shows that there is a close relationship between DNA conformation and liposome hydrophobicity, since increases in hydrophobicity result in deeper changes in DNA form, from the B to C form, for mixtures with cationic liposomes.
These parameters are extremely important when considering the design of an efficient vehicle to deliver DNA in a gene therapy protocol.
Therefore, DNA association efficiency depends not only on lipid charge but also on liposome hydrophobicity, which may lead to different DNA conformations. It is worth mentioning that DNA conformation can determine the expression of the selected protein and ultimately the success of the gene therapy.
Acknowledgements
We thank Dr. Javier Santos and Lic. Valeria Risso for their helpful discussions of Circular Dichroism assays. This work was supported by grants from CIC (Comisión de Investigaciones Científicas), CONICET (Consejo Nacional de Investigaciones Científicas y Técnicas), and the Universidad Nacional de Quilmes (Buenos Aires, Argentina). Silvia del V. Alonso is a Scientific Research Career member of the CONICET, Argentina.
References
- 1.Gelbart, W., Bruinsma, R., Pincus, P., Parsegian, V.: DNA-inspired electrostatics. Phys. Today 53, 38–44 (2000). doi:10.1063/1.1325230 [DOI]
- 2.Lasic, D., Strey, H., Stuart, M., Podgornik, M., Frederik, P.: The structure of DNA–liposome complexes. J. Chem. Soc. 119, 826–832 (1997). doi:10.1021/ja962819b [DOI]
- 3.Rädler, J., Koltover, I., Salditt, T., Safinya, C.: Structure of DNA–cationic liposomes complexes: DNA interaction in multilamellar membranes in distinct interhelical packing regimes. Science 275, 810–814 (1997). doi:10.1126/science.275.5301.810 [DOI] [PubMed]
- 4.Robertson, M.: Small molecules, energy and biosynthesis. In: Robertson, M. (ed.) Molecular biology of the cell, 3rd edn. Garland, New York (1994)
- 5.Wing, R.M., Drew, H.R., Takano, T., Broka, C., Tanaka, S., Itakura, K., Dickerson, R.E.: Crystal structure analysis of a complete turn of B-DNA. Nature 287, 755–758 (1980). doi:10.1038/287755a0 [DOI] [PubMed]
- 6.Arnott, S., Hukins, D.W.L.: Optimized parameters for A-DNA and B-DNA. Biochem. Biophys. Res. Commun. 47, 1504–1509 (1972). doi:10.1016/0006-291X(72)90243-4 [DOI] [PubMed]
- 7.Zhang, Z., Huang, W., Tang, J., Wang, E., Dong, S.: Conformational transition of DNA induced by cationic lipid vesicle in acidic solution: spectroscopy investigation. Biophys. Chem. 97, 7–16 (2002). doi:10.1016/S0301-4622(02)00006-6 [DOI] [PubMed]
- 8.Gershon, H., Ghiraldo, R., Guttman, S., Minsky, A.: Mode of formation and structural features of DNA–cationic liposome complexes used for transfection. Biochem 32, 7143–7151 (1993). doi:10.1021/bi00079a011 [DOI] [PubMed]
- 9.Bruinsma, R., Mashl, J.: Long range electrostatic interaction in DNA–cationic lipid complexes. Europhys. Lett. 41, 165–170 (1998). doi:10.1209/epl/i1998-00125-0 [DOI]
- 10.Harries, D., May, S., Gelbart, W., Ben-Shaul, A.: Structure, stability, and thermodynamics of lamellar DNA–lipid complexes. Biophys. J. 75, 159–173 (1998) [DOI] [PMC free article] [PubMed]
- 11.Vermam, I., Somia, N.: Gene therapy—promises, problems and prospects. Nature 389, 239–242 (1997). doi:10.1038/38410 [DOI] [PubMed]
- 12.Fasman, G.D.: Determination of the conformation of nucleic acids by electronic CD (Chapter 12). In: Fasman, G.D. (ed.) Circular dichroism and the conformational analysis of biomolecules. Plenum, New York (1996)
- 13.Zuidam, N.J., Barenholz, Y., Minsky, A.: Chiral DNA packaging in DNA–cationic liposome assemblies. FEBS Lett. 457, 419–422 (1999). doi:10.1016/S0014-5793(99)01053-4 [DOI] [PubMed]
- 14.Zuidam, N.J., Hirsh-Lerner, D., Margulies, S., Barenholz, Y.: Lamellarity of cationic liposomes and mode of preparation of lipoplexes affect transfection efficiency. Biochim. Biophys. Acta 1419, 207–220 (1999). doi:10.1016/S0005-2736(99)00069-3 [DOI] [PubMed]
- 15.Gregoriadis, G., McCormack, B., Obrenovic, M., Saffie, R., Zadi, B., Perrie, Y.: Vaccine entrapment in liposomes. Methods 19, 156–162 (1999). doi:10.1006/meth.1999.0841 [DOI] [PubMed]
- 16.Chiaramoni, N.S., Speroni, L., Taira, M.C., Alonso, S.: Liposome/DNA systems: correlation between association, hydrophobicity and cell viability. Biotechnol. Lett. 29, 1637–1644 (2007). doi:10.1007/s10529-007-9454-y [DOI] [PubMed]
- 17.Hillen, W., Wells, R.D.: Circular dichroism studies of the B to A conformational transition in seven small DNA restriction fragments containing the Escherichia coli lactose control region. Nucleic Acids Res. 8, 5427–5443 (1980). doi:10.1093/nar/8.22.5427 [DOI] [PMC free article] [PubMed]
- 18.Zhu, Y., Cheng, G., Dong, S.: Confomational transition of DNA in electroreduction studied by in situ UV and CD thin layer spectroelectrochemistry. Biophys. Chem. 87, 103–110 (2000). doi:10.1016/S0301-4622(00)00170-8 [DOI] [PubMed]
- 19.Akao, T., Fukumoto, T., Ihara, H., Ito, A.: Conformational change in DNA induced by cationic bilayer membranes. FEBS Lett. 391, 215–218 (1996). doi:10.1016/0014-5793(96)00736-3 [DOI] [PubMed]
- 20.Bennett, M.J., Aberle, A.M., Balasubramaniam, R.P., Malone, J.G., Malone, R.W., Nantz, M.H.: Cationic lipid-mediated gene delivery to murine lung: correlation of lipid hydration with in vivo transfection activity. J. Med. Chem. 40, 4069–4078 (1997). doi:10.1021/jm970155q [DOI] [PubMed]
- 21.Savva, M., Aljaberi, A., Feigand, J., Beer Stolz, D.: Correlation of the physicochemical properties of symmetric 1,3-dialkoylamidopropane-based cationic lipids containing single primary and tertiary amine polar head groups with in vitro transfection activity. Colloids Surf. B Biointerfaces 43, 43–56 (2005). doi:10.1016/j.colsurfb.2005.03.008 [DOI] [PubMed]


