

Abstract
The DNA topoisomerase I (topo1) inhibitor topotecan (TPT) and topo2 inhibitor mitoxantrone (MXT) damage DNA inducing formation of DNA double-strand breaks (DSBs). We have recently examined the kinetics of ATM and Chk2 activation as well as histone H2AX phosphorylation, the reporters of DNA damage, in individual human lung adenocarcinoma A549 cells treated with these drugs. Using a phospho-specific Ab to tumor suppressor protein p53 phosphorylated on Ser15 (p53-Ser15P) combined with an Ab that detects p53 regardless of the phosphorylation status and multiparameter cytometry we correlated the TPT- and MXT- induced p53-Ser15P with ATM and Chk2 activation as well as with H2AX phosphorylation in relation to the cell cycle phase. In untreated interphase cells, p53-Ser15P had “patchy” localization throughout the nucleoplasm while mitotic cells showed strong p53-Ser15P cytoplasmic immunofluorescence (IF). The intense phosphorylation of p53-Ser15, combined with activation of ATM and Chk2 (involving centrioles) as well as phosphorylation of H2AX seen in the untreated mitotic cells, suggest mobilization of the DNA damage detection/repair machinery in controlling cytokinesis. In the nuclei of cells treated with TPT or MXT, the expression of p53-Ser15P appeared as closely packed foci of intense IF. Following TPT treatment, the induction of p53-Ser15P was most pronounced in S-phase cells while no significant cell cycle phase differences were seen in cells treated with MXT. The maximal increase in p53-Ser15P expression, rising up to 2.5-fold above the level of its constitutive expression, was observed in cells treated with TPT or MXT for 4–6 h. This maximum expression of p53-Ser15P coincided in time with the peak of Chk2 activation but not with ATM activation and H2AX phosphorylation, both of which crested 1–2 h after the treatment with TPT or MXT. The respective kinetics of p53-Ser15 phosphorylation versus ATM and Chk2 activation suggest that in response to DNA damage by TPT or MXT, Chk2 rather than ATM mediates p53 phosphorylation.
Keywords: novantrone, anthracyclines, cell cycle, apoptosis, DNA topoisomerase, DNA replication, cleavable complexes, double strand DNA breaks, DNA damage, DNA repair, mitosis
Introduction
Damage to DNA, particularly when it involves formation of DNA double strand breaks (DSBs) induces phosphorylation of histone H2AX on Ser 139.1,2 The phosphorylation can be mediated either by ATM-,3 ATR-,4 or DNA-dependent protein kinase.5 (reviewed in refs. 6 and 7). While phosphorylation by ATM is linked to the induction of DSBs7-9 H2AX phosphorylation by ATR occurs in response to other types of DNA damage, including replication stress.10 Sites of phosphorylated H2AX, named γH2AX, can be detected by a phospho-specific Ab; in the nucleus they are seen as immunofluorescent (IF) foci, each focus presumed to represent an individual DSB.2 Checkpoint and DNA repair proteins such as Rad50, Rad51, Brca1 and the p53 binding protein 1 (53BP1) co-localize with γH2AX.11,12 Activation of ATM occurs by phosphorylation of its Ser1981, an event that also can be detected immunocytochemically.9 ATM activation concurrent with H2AX phosphorylation in the same cells subjected to a genotoxic agent, especially when present in the form of IF foci, is considered to be a reliable marker of induction of DSBs.7-9
DNA damage also engages checkpoint pathways to arrest progression though the cell cycle until DNA integrity is restored during the repair process.13-15 Activation of Chk2 is mediated by ATM which directly phosphorylates Thr68 of this protein kinase leading to its dimerization.13,16,17 During replication stress, however, Thr68 phosphorylation of Chk2 is mediated by ATR.18 Dimerization of Chk2 leads to intermolecular phosphorylation on Thr383, Thr387 and Ser516 of this kinase followed by dissociation of the dimers. The enzymatically active monomers may move out from chromatin and undergo translocation to cytosolic substrates.19,20 Among numerous substrates of Chk2 are Cdc25C and Cdc25A whose phosphorylation leads to cell arrest at the G2 to M or G1 to S phase transitions, respectively.13 Activation of Chk1 is triggered by DNA damage involving formation of ssDNA lesions and can be carried out by ATM and ATR.21,22 Chk1 is implicated in several checkpoints of cell cycle progression23 and also phosphorylates hBRCA2, a protein involved in recombination-mediated DNA repair and maintenance of replication forks.24 p53-dependent Chk1 phosphorylation was shown to be required for maintenance of G2 arrest upon DNA damage.25
One of the key responders to DNA damage is the tumor suppressor protein p53 (reviewed in refs. 26 and 27). Among the multiplicity of p53 target genes are the genes mediating DNA repair, cell cycle arrest and regulation of apoptosis. Upon DNA damage p53 can be phosphorylated on multiple sites by ATM, DNA-PK and also by Chk2.26-29 Phosphorylation of p53 on Ser15 is crucial for its stabilization and essential for induction of cell cycle arrest mediated by this transcription factor. It also facilitate p53 binding to the sites of DNA base damage.30 While Ser15 phosphorylation of p53 stimulates its transactivation by facilitating binding to the p300 coactivator, it does not seem to directly alter p53 interaction with MDM2.31 Activation of p53 through phosphorylation on Ser15 in hapatocellular carcinoma cells treated with the topo1 inhibitor irinotecan was seen to precede apoptosis.32 Likewise, induction of p53 phosphorylation in neonatal cardiomyocytes by oxidative stress was also followed by apoptosis.33
DNA topoisomerase I (topo1) and topo2 inhibitors are widely used antitumor drugs. Their mode of action involves stabilization of otherwise transient “cleavable complexes” between topo1 or topo2 and DNA. During DNA replication, collisions of replication forks with the complexes convert these lesions into potentially lethal DNA double-strand breaks (DSBs).34,35 Collisions of the progressing RNA polymerase transcription machinery with the “cleavable complexes” also lead to formation of DSBs.36 Unlike topo1 inhibitors, the topo2 inhibitors additionally damage DNA by generating oxidative stress.37 Still another type of DNA lesion induced by topo2 inhibitors result from intercalation to- and condensation of- DNA that leads to nucleolar segregation followed by apoptosis.38,39
We recently reported that DNA damage caused by inhibitors of topo1 [camptothecin (CPT), topotecan (TPT)] and topo2 [mitoxantrone (MXT) and etoposide (ETP)] triggered phosphorylation of H2AX concurrently with activation of ATM40-43 and Chk2.44 Using multiparameter cytometry we correlated the DNA damage response with cell cycle position and with initiation of apoptosis. We observed that topo1 inhibitors induced activation of ATM and Chk2, phosphorylation of H2AX and subsequently apoptosis (cleavage of caspase-3) almost exclusively in S-phase cells. In contrast, the early events of the DNA damage response triggered by topo2 inhibitors were less cell cycle phase dependent although the induction of ATM and H2AX phosphorylation was the most pronounced in G1 cells whereas the S-phase cells, as with topo1 inhibitors, preferentially underwent apoptosis.40-43 With a comparable level of DNA damage response, thus, the proclivity to undergo apoptosis was distinctly greater in DNA replicating- than in G1- or G2-phase cells. In addition to the generation of “cleavable complexes”, our data implicated formation of reactive oxidants45-47 as a mechanism through which DNA damage was induced by the topo2 inhibitors MXT and ETP.37,40
In the present study we extended the analysis of DNA damage response to topo1 and topo2 inhibitors by exploring the effect of TPT and MXT on phosphorylation of the tumor suppressor protein p53 on Ser15. As mentioned, this modification is critical for stabilization of this transcription factor which among other functions arrests cell cycle progression. Based on our earlier observation44 and the current data, we have been able to correlate the kinetics of cell response to DNA damage by TPT and MXT in terms of ATM and Chk2 activation as well as H2AX and p53Ser15 phosphorylation. The data show a temporal correlation between the induction of Chk2 activation and p53-Ser15 phosphorylation in the cells treated either with TPT or MXT, and the lack of such correlation with activation of ATM. Thus, these data are consistent with the role of Chk2 rather than ATM as the protein kinase that phosphorylates p53 on Ser15 in response to DNA damage by topo1 or topo2 inhibitors.
Results
Untreated cells showed the presence of the constitutively expressed p53Ser15P in interphase nuclei in the form of rounded granular chromatin structures of irregular size and of modest IF intensity (Fig. 1). Mitotic cells, however, had very intense p53Ser15P IF localized in the cytoplasm. There was also very strong IF of ATM-Ser1981P in the cytoplasm of mitotic cells. In the cells treated with MXT, nuclear p53-Ser15P IF was more intense than in control and had the appearance of minute, closely adjacent foci. The most strongly labeled TPT or MXT treated cells displayed IF foci in such close proximity to each other that it appeared as nearly confluent IF labeling within the nucleoplasm. In large nuclei (most likely of G2 phase cells) there was strong perinucleolar p53-Ser15P IF (Fig. 1C and D; the arrow). The pattern of p53-Ser15P IF of the cells treated with MXT for 4 h and with TPT for 4 or 6 h (not shown) was similar to that of the cells treated with MXT for 6 h (Fig. 1C). Since in the TPT and MXT-treated cultures the cells were arrested in G2 or S, no mitotic cells were apparent. Expression of ATM-Ser1981P was stronger in the cells treated with TPT or MXT for 2 h compared to cells treated for 4–6 h (not shown).
Figure 1.

Expression of p53Ser15P in A549 cells untreated or treated with MXT. The cells growing on slides were either untreated (A,B) or treated with 0.2 μM MXT for 6 h and then immunostained with Alexa Fluor 488 Ab (p53Ser15P , green fluorescence) and Alexa Fluor 633 (ATM-S1981P, red fluorescence) and their DNA was counterstained with DAPI, as described in Materials and Methods. Fluorescence was induced using either blue (A,C) or multi-spectral (including UV) excitation filter (B,D). Note the patchy pattern of p53-Ser15P distribution in chromatin of untreated, interphase cells and strong IF of p53-Ser15P (A) as well as ATM-S1981P (B) in the cytoplasm of mitotic cells (red fluorescence, arrow). The cells treated with MXT show a strong, “grainy” pattern of p53Ser15P IF in their nuclei (C).
Figure 2 illustrates the effect of TPT on expression of p53-Ser15P, ATM-Ser1981P and Chk2-Thr68P in A549 cells. It is quite apparent from these bivariate distributions that the S-phase cells were most affected by TPT in terms of induction of p53 phosphorylation as well as activation of ATM and Chk2. At the peak of response, nearly all S-phase cells had IF distinctly above the maximal level of the constitutive expression of p53-Ser15P, ATM-Ser1981P or Chk2-Thr68P of the untreated cells (0 time), marked by the respective skewed dashed lines on these distributions. It is also apparent that the kinetics of the increase of ATM-Ser1981P was different compared to the kinetics of the p53-S15P and Chk2-Thr68P rise. Namely, whereas the increase in p53-Ser15P and Chk2-Thr68P was maximal in the cells treated with TPT for 4–6 h, the peak of the increase in expression of activated ATM was seen in cells treated with TPT for 1 h. The cell cycle arrest induced by TPT was revealed as an accumulation of cells in early S phase after 6 h of treatment (Fig. 2, see the arrow on the DNA histogram).
Figure 2.

Induction of phosphorylation of p53 on Ser15, ATM on Ser1981 and Chk2 on Thr68 in A549 cells treated with TPT. The bivariate distributions (scatterplots) of DNA content versus p53S15P, (top), ATM-S1981P (mid), or Chk2Thr68P (bottom) of A549 cells treated with 0.15 μM TPT for up to 6 h. Based on difference in cellular DNA content, cells in G1, S and G2M can be gated, as shown by vertical dashed lines in the control (0 time) cultures, for quantitative analysis of the mean values of the respective IF (these data are shown in Fig. 4). The dashed skewed lines represent the upper threshold level of IF for 97% of interphase (G1 + S) cells in the respective untreated (time 0) cultures. The insets in the DNA versus ATM-S1981P distributions show DNA content histograms of cells from untreated (left) or 6 h TPT treated (right) cultures. Note accumulation of cells in early S-phase (arrow) as a result of cell arrest in S by TPT.
The response of cells to MXT is shown in Figure 3. Unlike in the case of TPT, the induction of p53-Ser15P as well as activation of ATM and Chk2 in cells treated with MXT was not S-phase selective but it was apparent in all phases of the cell cycle. However, the kinetics of the response in terms of induction of p53 phosphorylation as compared with ATM and Chk2 activation resembled that of the cells treated with TPT. Namely, the peaks of both p53-Ser15 phosphorylation and Chk2 activation lagged after the peak of ATM activation. Thus, while maximal ATM activation was seen after 1–2 h of treatment with MXT, the peak of Chk2 activation was after 4 h and of p53-Ser15 phosphorylation after 6 h of treatment (Fig. 3). There was no clear evidence of accumulation of cells in any particular phase of the cell cycle on the DNA content histograms which would suggest that the during the initial 6 h of the treatment with MXT the cell cycle progression was halted in all phases of the cycle.
Figure 3.

Induction of phosphorylation of p53 on Ser15, ATM on Ser1981 and Chk2 on Thr68 in A549 cells treated with MXT. The bivariate distributions (scatterplots) of DNA content versus p53S15P, (top), ATM-Ser1981P (mid), or Chk2Thr68P (bottom) of A549 cells treated with 0.2 μM MXT for up to 6 h. The cells in G1, S and G2M can be identified and gated based on difference in cellular DNA content, as shown by vertical dashed lines in the control (0 time) cultures. The dashed skewed lines represent the upper threshold level of IF for 97% of interphase (G1 + S) cells in the respective untreated (time 0) cultures. The insets in the DNA versus ATM-Ser1981P distributions show DNA content histograms of cells from untreated (left) or 6 h MXT treated (right) cultures.
The kinetics of p53-Ser15 phosphorylation, ATM and Chk2 activation in cells treated with TPT or MXT vis-à-vis cell cycle phase is illustrated in Figure 4. For comparison, data is also included for histone H2AX phosphorylation on Ser-139 which were published before.44 The data are expressed in terms of n-fold increase of expression of these phospho-proteins above their level in untreated cells, which to a large extent reflects the response to constitutive oxidative DNA damage by endogenous, metabolically generated oxidants.45-47 In the cells treated with TPT, the maximal increase was seen in activation of ATM in S-phase cells, which after 1 h of treatment was nearly 6-fold above that of the constitutive expression of ATM-S1981P in the untreated cells. Compared with G1 or G2M cells the S-phase cells also showed higher levels of Chk2 activation and p53 Ser15 phosphorylation (over 2.5-fold). In contrast to the early peak of ATM activation, Chk2 activation and p53 phosphorylation peaked after 4–6 h exposure to TPT. The peak of H2AX phosphorylation seen at 2 h of treatment preceded the peak in Chk2 and p53 phosphorylation with TPT but lagged (∼1 h) the peak of ATM activation.
Figure 4.
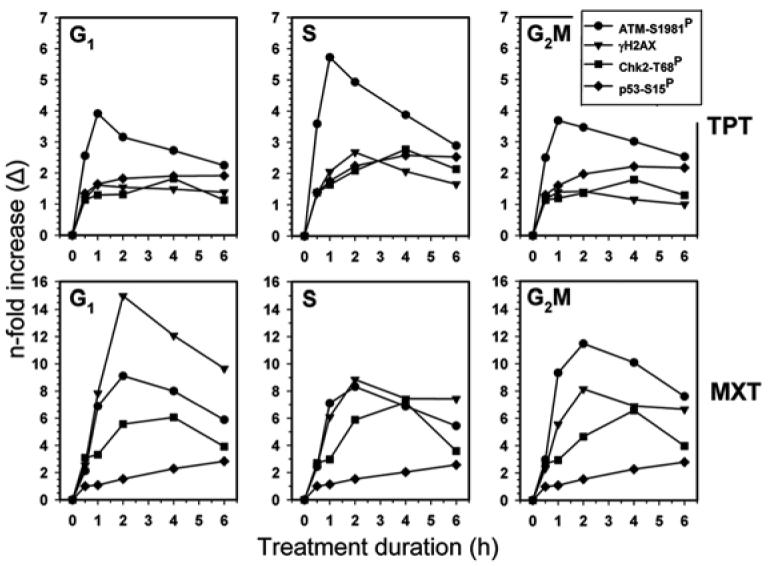
Kinetics of p53-Ser15, ATM-Ser1981, Chk2-Thr68 and H2AX-Ser139 phosphorylation during treatment of A549 cells with TPT or MXT. The data show mean values of p53-Ser15P, ATM-Ser1981P, Chk-68ThrP and γH2AX IF estimated by gating analysis, based on differences in DNA content, separately for subpopulations of cells in G1, S and G2M phases of the cell cycle at each time point of the treatment as described in Materials and Methods. The data represent the n-fold increase (Δ) in the level of expression of these proteins phosphorylated at the respective sites over the level of their constitutive expression of the phosphorylated state.45-48
The kinetics of DNA damage response and cell cycle specificity of cells treated with MXT was very much different compared to the cells treated with TPT. The maximal, over 9-fold rise in the level of activated ATM was seen in G1 cells after 2 h of exposure to the drug. This rise coincided in time with the nearly 15-fold increase in expression of γH2AX. Similar kinetics of ATM activation and H2AX phosphorylation, peaking after 2 h of treatment with MXT, characterized G2M and S-phase cells, although the MXT-induced rise in expression of γH2AX (8 to12-fold) in S phase cells was somewhat lower than the increase seen in G1 phase cells (15-fold). The peak of Chk2 activation in MXT treated cells manifesting as an ∼6-fold increase over the level of the constitutively activated Chk2 was seen in the cells treated with MXT for 4 h and was of similar magnitude for cells in G1, and S as well as in G2M. The maximal (over 2-fold) rise in expression p53-Ser15P, appeared in cells treated with MXT for 6 h and this increase was also of similar magnitude regardless of the cell cycle phase.
In the cells treated with TPT and MXT, concurrent with the increase in expression of p53-Ser15P, we observed upregulation of the level of total p53. To reveal whether the rise in expression of p53-Ser15P was a reflection of the increased level of total p53 where the proportion of Ser15 phosphorylated protein remained unchanged or whether the increase of total p53 was combined with an altered proportion of p53-Ser15P versus total p53, we have measured the ratio of the drug-induced increase in the level of p53-Ser15P and compared it with the drug-induced increase of total p53 (Fig. 5). Towards this end the cells were treated with TPT or MXT for 5 h and the increase (Δ) in p53-Ser15P above the level of constitutive expression of this phospho-protein was compared with the increase in the total level of p53 above the constitutive p53 expression. The data are presented as a ratio of Δp53-Ser15P/Δp53. It is evident that this ratio is higher than 1.0 (1.7–2.2) which indicates that treatment with TPT or MXT while leading to a rise of total p53, induced a much greater rise in the proportion of p53 phosphorylated on Ser15 compared with non-phosphorylated p53. In cells treated with TPT, the ratio of Ser15 phosphorylated p53 to total p53 was higher in S and G2M cells compared to G1 phase cells, whereas in MXT-treated cells this ratio was greater in G2M cells than in S or G1 cells.
Figure 5.
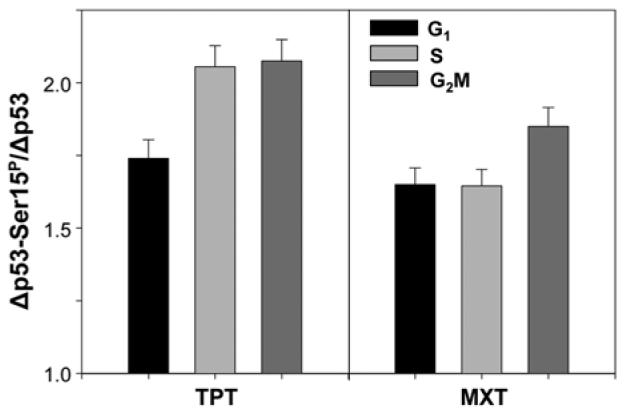
Effect of TPT and MXT on the proportion of p53-Ser15P versus total p53. A549 cells were untreated or treated with 0.15 μM TPT or 0.2 μM MXT for 5 h. Expression of cellular p53 and p53-Ser15P was detected with Ab that reacts with p53 regardless of its status of Ser15 phosphorylation (total p53) and with the phospho-specific Ser15P Ab, respectively, tagged with fluorochromes having different fluorescence emission (488 and 633 nm), as described in Materials and Methods. Cellular DNA was stained with DAPI. The data are presented as a the mean (±SD) ratio of the increase (Δ) of p53-Ser15P to the increase of p53 IF in treated cells over their constitutive levels in untreated cells, estimated by gating analysis for G1, S and G2M cells.
Discussion
We have recently characterized the DNA damage response of cells treated with TPT or MXT in terms of ATM and Chk2 activation as well as phosphorylation of histone H2AX.43 Unlike most studies that rely on bulk data obtained from analysis of the mean response of the cell populations represented by Western blotting, by using multiparameter laser scanning cytometry (LSC),48 we were able to measure large populations of individual cells. This approach makes it possible to assess the heterogeneity of cell response to the treatment and through multivariate analysis correlate several attributes of the same cell with each other. Because one of the measured attributes is cellular DNA content, the expression of the other measured attribute(s) can be directly correlated with cell cycle phase without the necessity of cell synchronization, which often is plagued by artifacts.49
In the present study, we correlated the kinetics of p53 phosphorylation on Ser15 with activation of ATM, Chk2 and phosphorylation of H2AX in the cells treated with TPT and MXT, all in relation to cell cycle phase. One feature of p53-Ser15P that is different compared to ATM and Chk2 activation or to H2AX phosphorylation is its relatively high level of constitutive expression in untreated interphase cells (Fig. 1A). Constitutive H2AX phosphorylation and ATM activation to a large extent is in response to DNA damage by endogenous oxidants generated during aerobic metabolism.46,47 DNA damage by exogenous oxidants additionally increases the level of γH2AX and activated ATM.50,51 The relatively high level of constitutive expression of p53-Ser15P determines that the extent of its induction by TPT- or MXT- when estimated in terms of the n-fold increase (Δ) over the level of constitutive p53-Ser15P, because of a high value of the denominator, is low compared to ATM or H2AX phosphorylation (Fig. 4). By measuring the ratio of the TPT- or MXT- induced increase of p53-Ser15P to total p53 (Fig. 5) we were able to show that the degree of phosphorylation of p53 was increased in the drug-treated cells. Thus, as result of the treatment, the degree of p53 phosphorylation on Ser15 exceeded the rise in the total level of this protein in the cell.
Interestingly, mitotic cells showed very high levels of expression of p53-Ser15P that was present in the cytoplasm. Mitotic cells also demonstrate intense activation of ATM and Chk2 as well as the presence of γH2AX.52-55 Induction of premature chromosomes condensation (PCC) also triggers ATM activation and H2AX phosphorylation.56 DNA in condensed chromatin of mitotic cells shows local DNA denaturation regions sensitive to single-strand specific S1 or mung bean nucleases, indicative of the topological stress on its double helical structure.57 Polo-like kinases Plk1 and Plk3 are localized in centrosomes and in the midbody and Plk1 can also phosphorylate Chk2 on Thr68.58 All these events occurring during mitosis and preceding cytokinesis (“mitotic checkpoint”), including phosphorylation of H2AX, the “histone guardian of the genome”,59 likely serve to restructure chromatin to allow the final proof-reading of DNA for any damage, and if the damage is detected, to engage the repair machinery. Centrosomes, which at that time contain activated Chk2 and p53 in addition to other signaling factors,60-62 possibly provide the platform for the final signal to initiate cytokinesis thereby allowing the cell to divide only if the integrity of the genome is preserved.
It should be noted that degradation of p53 requires transcription and during arrest in mitosis (e.g., induced by the inhibitors such as Taxol or nocodazole), when transcription is halted, p53 accumulates in the cell and degree of its accumulation reflects duration of mitosis.63 It is likely that one of the functions of p53 is to regulate duration of mitosis, and in the case of cell exit from prolonged arrest in mitosis, upon resumption of transcription, to induce Bax or p21 and thereby promote apoptosis or cell arrest.64 Interestingly, p21 being a regulator of p53 stability provides a negative regulatory loop that may lower p53 level in these postmitotic cells.65
The present data show that regardless of whether DNA damage was induced by TPT or by MXT the first events of the response were ATM activation and H2AX phosphorylation which peaked at the same time, about 2 h after drug administration (Fig. 4). This finding is consistent with our prior observation that activation of ATM induced by these drugs was concurrent in time with H2AX phosphorylation and both events, when measured within the same cells, were strongly correlated with each other (R = 0.97).41,44,66 Other reports also demonstrated that upon induction of DSBs by ionizing radiation or by DNA-cleaving drugs, phosphorylation of H2AX was mediated by ATM.1-3,12 Thus, it would appear most likely that the presently observed phosphorylation of H2AX in TPT- or MXT-treated cells was mediated by ATM.
The peak of Chk2 activation detected as its phosphorylation on Thr68 lagged by about 2 h behind the peaks of ATM activation and H2AX phosphorylation. It is well known that in response to DNA damage involving DSBs Chk2 is activated by ATM.13-18
In fact, induction of DNA damage in ATM deficient cells does not result in activated Chk2 but the activation is restored upon its ectopic expression.15,18 Although activation of Chk2 can be mediated by ATR, such event takes place in response to replication stress but not to DNA damage.18 It may be concluded, therefore, that in the cells treated with TPT or MXT Chk2 was activated by ATM. Our data showing that within the same cells Chk2 phosphorylation on Thr68 was distinctly delayed after the peak of ATM activation indicate that factors other than the presence of maximally activated ATM determine the timing of Chk2 activation. It should be noted that because Thr68 phosphorylation is only the initial step, the complete activation of Chk2, requiring additional phosphorylation of Thr383, Thr387 and Ser516,15 may be even further delayed vis-à-vis the peak of ATM activation.
The key substrate of Chk2 is Cdc25C whose phosphorylation induces binding of cyclin B1/Cdk1 to a 14-3-3 protein, impeding its translocation to the nucleus and subsequent dephosphorylation, an event otherwise necessary for cells to enter mitosis.67 Thus, the consequence of Cdc25 phosphorylation by Chk2 is cell arrest in G2. As mentioned, we presently observed that upon induction of DNA damage by TPT or MXT, activation of Chk2 was a relatively late event. Analysis of the cell cycle distribution from the DNA content frequency histograms of the cells treated with TPT or MXT (Figs. 2 and 3) is in accordance with the observation of the late Chk2 activation as it does not show any significant accumulation of cells in G2M during the entire 6 h exposure to either of the drugs.
A549 cells are characterized by wt p53 and its level is upregulated upon induction of DNA damage by topoisomerase inhibitors.68 We presently observed that treatment of A549 cells with TPT or MXT led to upregulation of p53 and to its phosphorylation on Ser15. The ratio of phosphorylated to non-phosphorylated p53 was distinctly increased in the drug-treated cells compared to control (Fig. 5). Phosphorylation of p53, similar to Chk2, was also a relatively late event reaching a maximum 2–4 h after the peak of ATM activation (Fig. 4). This observation suggests that in response to DNA damage by TPT or MXT, phosphorylation of p53 is mediated by Chk2 rather than by ATM. In addition to the direct phosphorylation of p53 on Ser15 by Chk2,13,25-28 ATM and Chk2 may indirectly contribute to p53 activation through phosphorylation of MDMX.69
Of special interest is the cell cycle phase specific DNA damage response in TPT and MXT treated cells. In the case of TPT, the response by ATM, Chk2 or p53 activation and H2AX phosphorylation was most pronounced in S-phase cells. This S-phase selectivity is much more evident when analyzed on the raw data presented as the bivariate distributions (Fig. 2) than reflected from the mean values of the IF (Fig. 5). The reason for this apparent discrepancy is the great heterogeneity of the responding cells and an overlap between G1 and S-phase cells in estimating their mean IF values. Specifically, during the treatment that lasted for up to 6 h, many G1 cells were arrested in progression through the cycle while entering S. This is evident on the DNA content frequency histogram as an accumulation of cells in early S phase after 6 h (Fig. 2, inset; marked by the arrow). Because many arrested cells had a DNA content little changed in comparison to the untreated G1 cells, the gating analysis used to estimate their mean IF classified them as G1 cells. This blurred the distinction between the G1 and S-phase cells in the TPT-treated cultures during analysis of their mean IF values (Fig. 4). The selectivity of TPT towards S-phase cells is consistent with the well known mechanism of action of topo1 inhibitors targeting DNA replicating cells.34,35 These DSBs lesions are lethal which is reflected by selective cytotoxicity of topo1 inhibitors towards S-phase cells.70 Chk2 and p53 were also strongly activated by TPT in G2M (Fig. 2, after 4 h and 6h treatment, respectively). Thus, whereas DNA damage was more restricted to the DNA replicating cells, the G2M cells also activated the checkpoint pathway. It is likely that activation of Chk2 and p53 was triggered when the S-phase cells with damaged DNA entered G2. Activation of Chk2 at that point likely led to phosphorylation of Cdc25, halting progression through G2 phase.
The pattern of DNA damage response to treatment with MXT was much different compared to TPT. The induction of γH2AX and ATM activation was apparent in all phases of the cell cycle but the most pronounced was in G1 phase cells (Figs. 3 and 4).
The response of G2M cells was also very prominent, especially in the terms of activation of ATM which at the peak (2 h) was nearly 12-fold above its constitutive level. The induction of Chk2 and p53 activation by MXT, however, was less cell cycle phase specific, reaching comparable levels in all phases of the cell cycle (Fig. 4). This finding is consistent with observations that topo2 inhibitors MXT and ETP induce DNA damage not only in DNA replicating cells by stabilization of cleavable complexes but also in G1 and G2M by inducing oxidative stress.37,40 Furthermore, while only collisions of replication forks with the cleavable complexes stabilized by topo1 inhibitors generate DSBs, collisions of both RNA polymerase moving along the transcribed template during transcription and the moving replication forks with the complexes stabilized by topo2 inhibitors cause DSBs.36
Interestingly, activation of ATM and Chk2 and the phosphorylation of H2AX upon induction of DNA damage by oxidative stress (H2O2), also measured in individual cells by cytometry, was seen to be very rapid, peaking at 10–30 min and then declining.50 The peaks of ATM and Chk2 and H2AX phosphorylation were coincident in time and the most affected were S-phase cells. Thus, it is quite apparent that DNA damage caused by topo1 or topo2 inhibitors as compared with H2O2 induces entirely different kinetics of the damage response.
Materials and Methods
Cells, cell treatment
A549 cells, obtained from American Type Culture Collection (ATCC; Manassas, VA), were grown in Ham's F-12K Nutrient Mixture (Mediatech, Inc., Manassas, VA) supplemented with 10% fetal bovine serum, 100 units/ml penicillin, 100 μg/ml streptomycin and 2 mM L-glutamine (GIBCO/BRL; Grand Island, NY) in 25 ml FALCON flasks (Becton Dickinson Co., Franklin Lakes, NJ) at 37.5°C in an atmosphere of 95% air and 5% CO2. The cells were maintained in exponential and asynchronous phase of growth by repeated trypsinization and reseeding prior to the culture reaching confluency. The cells were then trypsinized and seeded at low density (about 5 × 10⁴ cells per chamber) in 2-chambered Falcon CultureSlides (Beckton Dickinson). Twenty four hours after seeding the cultures were treated with 0.15 μM topotecan (TPT; Hycamptin, Merck Pharmaceutical Co., Rahway, NJ) or 0.2 μM mitoxantrone (MXT, American Cyanamid, Pearl River, NY) for different time intervals, as described in the legends to figures. Control cultures were treated with the equivalent volumes of dimethylsulfoxide (DMSO, Sigma Chemical Co., St. Louis, MO) that was used to prepare stock solutions of the drugs.
Detection of p53 phosphorylated on Ser15 and total p53 expression or ATM phosphorylation of Ser139
Following incubations with TPT or MXT the cells were rinsed with PBS and then fixed with 1% methanol-free formaldehyde (Polysciences, Inc., Warrington, PA) in PBS for 15 min on ice followed by suspension in 70% ethanol where they were stored at −20°C for 2–24 h. The fixed cells were then washed twice in PBS and treated on slides with 0.1% Triton X-100 (Sigma) in PBS for 15 min, and then in a 1% (w/v) solution of bovine serum albumin (BSA; Sigma) in PBS for 30 min to suppress nonspecific antibody (Ab) binding. The cells were then incubated in a 100 ul volume of 1% BSA containing 1:100 dilution of phospho-specific (Ser-15) p53 rabbit polyclonal antibody (Cell Signaling, Danvers, MA) and 1:100 dilution of p53 mouse monoclonal antibody (Santa Cruz Biotechnology, Santa Cruz, CA), or 1:100 dilution of phospho-specific (Ser-1981) ATM mouse monoclonal antibody (Cell Signaling, Danvers, MA). After overnight incubation at 4°C, the slides were washed twice with PBS and then incubated in 100 ul of 1:100 dilution of Alexa Fluor 488 goat anti-rabbit and 1:50 dilution of Alexa Fluor633 goat anti-mouse IgG (H+L) (Invitrogen/Molecular Probes, Eugene, OR) respectively, for 45 min at room temperature in the dark. The cells were then counterstained with 2.8 μg/ml 4,6-diamidino-2-phenylindole (DAPI; Sigma) in PBS for 15 min in samples to be analyzed by laser scanning cytometry (LSC)48 or examined by fluorescence microcopy.
Detection of H2AX phosphorylation on Ser 139 and Chk2 phosphorylation on Thr 68
The cells were treated and stained as above except that the primary Abs used were 1:200 dilution of phospho-specific (Ser-139) histone H2AX (γ-H2AX) mouse monoclonal antibody (mAb) (BioLegend, San Diego, CA) and 1:100 dilution of phospho-specific (Thr-68) Chk2 rabbit polyclonal antibody (Cell Signaling, Danvers, MA). Other details are given elsewhere.44,48,50,71
Measurement of cell fluorescence by LSC
Cellular green IF representing expression of p53-Ser15P or Chk2-Thr68P, and red IF representing expression of total p53, γH2AX-Ser139P or ATM-Ser1981P and the blue emission of DAPI stained DNA was measured using an LSC (iCys; CompuCyte, Cambridge, MA) utilizing standard filter settings; fluorescence was excited with 488-nm argon ion and violet diode lasers, respectively.44,48 The intensities of maximal pixel and integrated fluorescence were measured and recorded for each cell. At least 3,000 cells were measured per sample. Gating analysis was carried out to obtain mean values (±SE) of p53Ser15P for G1 (DNA Index; DI = 0.9–1.1), S (DI = 1.2–1.8) and G2M (DI = 1.9–2.1) cell populations in each experiment. To express the treatment-induced changes in IF (Δ) the mean IF values for G1, S and G2M cell populations estimated for the untreated cells (Ctrl) were subtracted from the respective mean values of the cells treated with TPT or MXT, for each time-point of the treatment. The SD was estimated based on Poisson distribution of cell populations. Each experiment was run at least in triplicate, some experiments were additionally repeated. Other details are given in figure legends.
Acknowledgements
Supported by NCI; Grant number CA 28704.
References
- 1.Rogakou EP, Pilch DR, Orr AH, Ivanova VS, Bonner WM. DNA double-stranded breaks induce histone H2AX phosphorylation on serine 139. J Biol Chem. 1998;273:5858–68. doi: 10.1074/jbc.273.10.5858. [DOI] [PubMed] [Google Scholar]
- 2.Sedelnikova OA, Rogakou EP, Panuytin IG, Bonner W. Quantitive detection of 125IUdR-induced DNA double-strand breaks with γ-H2AX antibody. Radiat Res. 2002;158:486–92. doi: 10.1667/0033-7587(2002)158[0486:qdoiid]2.0.co;2. [DOI] [PubMed] [Google Scholar]
- 3.Burma S, Chen BP, Murphy M, Kurimasa A, Chen DJ. ATM phosphorylates histone H2AX in response to DNA double-strand breaks. J Biol Chem. 2001;276:42462–7. doi: 10.1074/jbc.C100466200. [DOI] [PubMed] [Google Scholar]
- 4.Anderson L, Henderson C, Adachi Y. Phosphorylation and rapid relocalization of 53BP1 to nuclear foci upon DNA damage. Mol Cell Biol. 2001;21:1719–29. doi: 10.1128/MCB.21.5.1719-1729.2001. [DOI] [PMC free article] [PubMed] [Google Scholar]
- 5.Park EJ, Chan DW, Park JH, Oettinger MA, Kwon J. DNA-PK is activated by nucleosomes and phosphorylated H2AX within the nucleosomes in an acetylation-dependent manner. Nucleic Acids Res. 2003;31:6819–27. doi: 10.1093/nar/gkg921. [DOI] [PMC free article] [PubMed] [Google Scholar]
- 6.Lavin MF. ATM and the Mre11 complex combine to recognize and signal DNA double-strand breals. Oncogene. 2007;26:7749–58. doi: 10.1038/sj.onc.1210880. [DOI] [PubMed] [Google Scholar]
- 7.Lavin MF, Kozlov S. ATM activation and DNA damage response. Cell Cycle. 2007;6:931–42. doi: 10.4161/cc.6.8.4180. [DOI] [PubMed] [Google Scholar]
- 8.Kitagawa R, Kastan MB. The ATM-dependent DNA damage signaling pathway. Cold Spring Harb Symp Quant Biol. 2005;70:99–109. doi: 10.1101/sqb.2005.70.002. [DOI] [PubMed] [Google Scholar]
- 9.Bartkova J, Bakkenist CJ, Rajpert-De Meyts E, Skakkebaek NE, Sehested M, Lukas J, Kastan MB, Bartek J. ATM activation in normal human tissues and testicular cancer. Cell Cycle. 2005;4:838–45. doi: 10.4161/cc.4.6.1742. [DOI] [PubMed] [Google Scholar]
- 10.Ward IM, Minn K, Chen J. UV-induced ataxia-telangiectasia-mutated and Rad3-related (ATR) activation requires replication stress. J Biol Chem. 2004;279:9677–80. doi: 10.1074/jbc.C300554200. [DOI] [PubMed] [Google Scholar]
- 11.Paull TT, Rogakou EP, Yamazaki V, Kirchgesser CU, Gellert M, Bonner WM. A critical role for histone H2AX in recruitment of repair factors to nuclear foci after DNA damage. Curr Biol. 2000;10:886–95. doi: 10.1016/s0960-9822(00)00610-2. [DOI] [PubMed] [Google Scholar]
- 12.Furuta T, Takemura H, Liao ZY, Aune GJ, Redon C, Sedelnikova OA, Pilch DR, Rogakou EP, Celeste A, Chen HT, Nussenzweig A, Aladjem MI, Bonner WM, Pommier Y. Phosphorylation of histone H2AX and activation of Mre11, Rad50, and Nbs1 in response to replication-dependent DNA double-strand breaks induced by mammalian topoisomerase I cleavage complexes. J Biol Chem. 2003;278:20303–12. doi: 10.1074/jbc.M300198200. [DOI] [PubMed] [Google Scholar]
- 13.Matsuoka S, Huang M, Elledge SJ. Linkage of ATM to cell cycle regulation by the Chk2 protein kinase. Science. 1998;282:1893–7. doi: 10.1126/science.282.5395.1893. [DOI] [PubMed] [Google Scholar]
- 14.Zhou BB, Elledge SJ. The DNA response: putting checkpoints in perspective. Nature. 2000;408:433–9. doi: 10.1038/35044005. [DOI] [PubMed] [Google Scholar]
- 15.Ahn J, Urist M, Prives C. The Ch2 protein kinase. DNA repair. 2004;3:1039–47. doi: 10.1016/j.dnarep.2004.03.033. [DOI] [PubMed] [Google Scholar]
- 16.Ahn JY, Schwartz JK, Piwnica-Worms H, Canman CE. Threonine 68 phosphorylation by ataxia telangiectasia mutated is required for efficient activation of Chk2 in response to ionizing radiation. Cancer Res. 2000;60:5934–6. [PubMed] [Google Scholar]
- 17.Ahn JY, Li X, Davis HL, Canman CE. Phosphorylation of threonine 68 promotes ologomerization and autophosphorylation of Chk2 protein kinase via the forkhead-associated domain. J Biol Chem. 2002;277:19389–95. doi: 10.1074/jbc.M200822200. [DOI] [PubMed] [Google Scholar]
- 18.Matsuoka S, Rotman G, Ogawa A, Shiloh K, Tamai SJ, Elledge SJ. Ataxia telangiectasia-mutated phosphorylates Chk2 in vivo and in vitro. Proc Natl Acad Sci USA. 2000;97:10289–94. doi: 10.1073/pnas.190030497. [DOI] [PMC free article] [PubMed] [Google Scholar]
- 19.Li J, Stern DF. DNA damage regulates Chk2 association with chromatin. J Biol Chem. 2005;280:48–37956. doi: 10.1074/jbc.M509299200. [DOI] [PubMed] [Google Scholar]
- 20.Stevens C, Smith L, La Thangue NB. Chk2 activates E2F-1 in response to DNA damage. Nat Cell Biol. 2003;5:4465–79. doi: 10.1038/ncb974. [DOI] [PubMed] [Google Scholar]
- 21.Cologne TM, O'Connell MJ. Turning off the G2 DNA damage checkpoint. DNA repair. 2008;7:136–40. doi: 10.1016/j.dnarep.2007.07.017. [DOI] [PMC free article] [PubMed] [Google Scholar]
- 22.Paulsen RD, Cimprich KA. The ATR pathway: fine tuning the fork. DNA repair. 2007;6:953–66. doi: 10.1016/j.dnarep.2007.02.015. [DOI] [PubMed] [Google Scholar]
- 23.Chen Y, Poon RY. The multiple checkpoint functions of CHK1 and CHK2 in maintenance of genome stability. Front Biosci. 2008;13:5016–29. doi: 10.2741/3060. [DOI] [PubMed] [Google Scholar]
- 24.Bahassi EM, Ovensen JL, Riesenberg AL, Bernstein WZ, Hasty PE, Stambrook PJ. The checkpoint kinases Chk1 and Chk2 regulate the functional associations between hBRCA2 abs Dad51 in response to DNA damage. Oncogene. 2008;27:3977–85. doi: 10.1038/onc.2008.17. [DOI] [PubMed] [Google Scholar]
- 25.Wang XQ, Stanbridge EJ, Lao X, Cai Q, Fan ST, Redpath JL. p53-dependent Chk1 phosphorylation is required for maintenance of prolonged G2 arrest. Radiat Res. 2007;168:706–16. doi: 10.1667/RR1075.1. [DOI] [PubMed] [Google Scholar]
- 26.Lavin MF, Gueven N. The complexity of p53 stabilization and activation. Cell Death Differ. 2006;13:941–50. doi: 10.1038/sj.cdd.4401925. [DOI] [PubMed] [Google Scholar]
- 27.Riley T, Sontag E, Chen P, Levine A. Transcriptional control of human p53-regulated genes. Nat Rev Mol Cell Biol. 2008;9:402–12. doi: 10.1038/nrm2395. [DOI] [PubMed] [Google Scholar]
- 28.Jack MT, Woo RA, Motoyama N, Takai H, Lee PW. DNA-dependent protein kinase and checkpoint kinase 2 synergistically activate a latent population of p53 upon DNA damage. J Biol Chem. 2004;279:15269–73. doi: 10.1074/jbc.M309917200. [DOI] [PubMed] [Google Scholar]
- 29.Saito S, Yamaguchi H, Higashimoto Y, Chao C, Xu Y, Fornace AJ, Jr, Appella E, Anderson CW. Phosphorylation site interdependence of human p53 post-translational modification in response to stress. J Biol Chem. 2003;278:37536–44. doi: 10.1074/jbc.M305135200. [DOI] [PubMed] [Google Scholar]
- 30.Shanaz TAR, Dellaire G, Cuddihy A, Jalali F, Vaid M, Coackley C, Folkard M, Xu Y, Chen PC, Chen DJ, Lilge L, Prise KM, Jones DPB, Bristow RG. Evidence for the direct binding of phosphorylated p53 to sites of DNA breaks in vivo. Cancer Res. 2005;65:10–10821. doi: 10.1158/0008-5472.CAN-05-0729. [DOI] [PubMed] [Google Scholar]
- 31.Dumaz N, Meek DW. Serine15 phosphorylation stimulated p53 transactivation but does not directly influence interaction with HDM2. EMBO J. 1999;18:7002–10. doi: 10.1093/emboj/18.24.7002. [DOI] [PMC free article] [PubMed] [Google Scholar]
- 32.Takeba Y, Kumai T, Matsumoto N, Nakaya S, Tsuzuki Y, Yanagids Y, Kobayashi S. Irinotecan activates p53 with its active metabolite, resulting in human hepatocellular carcinoma apoptosis. J Pharmacol Sci. 2007;104:232–42. doi: 10.1254/jphs.fp0070442. [DOI] [PubMed] [Google Scholar]
- 33.Long X, Goldenthal MJ, Marin-Garcia J. Oxidative stress enhances phosphorylation of p53 in neonatal cadiomyocytes. Mol Cell Biochem. 2007;303:167–74. doi: 10.1007/s11010-007-9470-1. [DOI] [PubMed] [Google Scholar]
- 34.Hsiang YH, Lihou MG, Liu LF. Arrest of replication forks by drug stabilized topoisomeraseI-DNA cleavable complexes as a mechanism of cell killing by camptothecin. Cancer Res. 1989;49:5077–82. [PubMed] [Google Scholar]
- 35.DArpa P, Beardmore C, Liu LF. Involvement of nucleic acid synthesis in cell killing mechanisms of topoisomerase poisons. Cancer Res. 1990;50:6916–24. [PubMed] [Google Scholar]
- 36.Wu J, Liu LF. Processing of topoisomerase I cleavable complexes into DNA by transcription. Nucleic Acids Res. 1997;25:4181–6. doi: 10.1093/nar/25.21.4181. [DOI] [PMC free article] [PubMed] [Google Scholar]
- 37.Huang X, Kurose A, Tanaka T, Traganos F, Dai W, Darzynkiewicz Z. Activation of ATM and histone H2AX phosphorylation induced by mitoxantrone but not by topotecan is prevented by the antioxidant N-acetyl-L-cysteine. Cancer Biol Ther. 2006;5:959–64. doi: 10.4161/cbt.5.8.2878. [DOI] [PubMed] [Google Scholar]
- 38.Kapuscinski J, Darzynkiewicz Z. Relationship between the pharmacological activity of antitumor drugs Ametantrone and Mitoxantrone (Novantrone) and their ability to condense nucleic acids. Proc Natl Acad Sci USA. 1986;83:6302–6. doi: 10.1073/pnas.83.17.6302. [DOI] [PMC free article] [PubMed] [Google Scholar]
- 39.Kapuscinski J, Darzynkiewicz Z. Interactions of antitumor agents ametantrone and mitoxantrone (novantrone) with double-stranded DNA. Biochem Pharmacol. 1985;34:4203–13. doi: 10.1016/0006-2952(85)90275-8. [DOI] [PubMed] [Google Scholar]
- 40.Tanaka T, Halicka HD, Traganos F, Seiter K, Darzynkiewicz Z. Induction of ATM activation, histone H2AX phosphorylation and apoptosis by etoposide: relation to the cell cycle phase. Cell Cycle. 2007;6:371–6. doi: 10.4161/cc.6.3.3835. [DOI] [PubMed] [Google Scholar]
- 41.Kurose A, Tanaka T, Huang X, Halicka HD, Traganos F, Dai W, Darzynkiewicz Z. Assessment of ATM phosphorylation on Ser-1981 induced by DNA topoisomerase I and II inhibitors in relation to Ser-139-histone H2AX phosphorylation, cell cycle phase and apoptosis. Cytometry A. 2005;68:1–9. doi: 10.1002/cyto.a.20186. [DOI] [PubMed] [Google Scholar]
- 42.Huang X, Okafuji M, Traganos F, Luther E, Holden E, Darzynkiewicz Z. Assessment of histone H2AX phosphorylation induced by DNA topoisomerase I and II inhibitors topotecan and mitoxantrone and by DNA crosslinking agent cisplatin. Cytometry A. 2004;58:99–110. doi: 10.1002/cyto.a.20018. [DOI] [PubMed] [Google Scholar]
- 43.Tanaka T, Kurose A, Huang X, Dai W, Darzynkiewicz Z. ATM kinase activation and histone H2AX phosphorylation as indicators of DNA damage by DNA topoisomerase I inhibitor topotecan and during apoptosis. Cell Prolif. 2006;39:49–60. doi: 10.1111/j.1365-2184.2006.00364.x. [DOI] [PMC free article] [PubMed] [Google Scholar]
- 44.Zhao H, Traganos F, Darzynkiewicz Z. Kinetics of histone H2AX phosphorylation and Chk2 activation in A549 cells treated with topotecan and mitoxantrone in relation to the cell cycle phase. Cytometry A. 2008;73:480–9. doi: 10.1002/cyto.a.20574. [DOI] [PubMed] [Google Scholar]
- 45.Tanaka T, Halicka HD, Huang X, Traganos F, Darzynkiewicz Z. Constitutive histone H2AX phosphorylation and ATM activation, the reporters of DNA damage by endogenous oxidants. Cell Cycle. 2006;5:1940–5. doi: 10.4161/cc.5.17.3191. [DOI] [PMC free article] [PubMed] [Google Scholar]
- 46.Tanaka T, Kurose A, Halicka HD, Traganos F, Darzynkiewicz Z. 2-Deoxy-D-glucose reduces the level of constitutive activation of ATM and phosphorylation of histone H2AX. Cell Cycle. 2006;5:878–82. doi: 10.4161/cc.5.8.2681. [DOI] [PubMed] [Google Scholar]
- 47.Zhao H, Tanaka T, Halicka HD, Traganos F, Zarebski M, Dobrucki J, Darzynkiewicz Z. Cytometric assessment of DNA damage by exogenous and endogenous oxidants reports the aging-related processes. Cytometry A. 2007;71:905–14. doi: 10.1002/cyto.a.20469. [DOI] [PMC free article] [PubMed] [Google Scholar]
- 48.Darzynkiewicz Z, Bedner E, Gorczyca W, Melamed MR. Laser scanning cytometry. A new instrumentation with many applications. Exp Cell Res. 1999;249:1–12. doi: 10.1006/excr.1999.4477. [DOI] [PubMed] [Google Scholar]
- 49.Kurose A, Tanaka T, Huang X, Traganos F, Darzynkiewicz Z. Synchronization in the cell cycle by inhibitors of DNA replication induces histone H2AX phosphorylation, an indication of DNA damage. Cell Prolif. 2006;39:231–40. doi: 10.1111/j.1365-2184.2006.00380.x. [DOI] [PMC free article] [PubMed] [Google Scholar]
- 50.Zhao H, Traganos F, Albino AP, Darzynkiewicz Z. Oxidative stress induces cell cycle-dependent Mre11 recruitment, ATM and Chk2 activation and histone H2AX phosphorylation. Cell Cycle. 2008;7:1–6. doi: 10.4161/cc.7.10.5963. [DOI] [PMC free article] [PubMed] [Google Scholar]
- 51.Tanaka T, Halicka HD, Traganos F, Darzynkiewicz Z. Phosphorylation of histone H2AX on Ser 139 and activation of ATM during oxidative burst in phorbol ester-treated human leukocytes. Cell Cycle. 2006;5:2671–5. doi: 10.4161/cc.5.22.3472. [DOI] [PubMed] [Google Scholar]
- 52.Ichijima Y, Sakasai R, Okita N, Asahina K, Mizutani S, Teraoka H. Phosphorylation of histone H2AX at M phase in human cells without DNA damage response. Biochem Biophys Res Commun. 2005;336:807–12. doi: 10.1016/j.bbrc.2005.08.164. [DOI] [PubMed] [Google Scholar]
- 53.Tritarelli A, Oricchio E, Ciciarello M, Mangiacasale R, Palena A, Lavia P, Soddu S, Cundari E. p53 localization at centrosomes during mitosis and postmitotic checkpoint are ATM-dependent and require serine 15 phosphorylation. Mol Cell Biol. 2004;15:3751–7. doi: 10.1091/mbc.E03-12-0900. [DOI] [PMC free article] [PubMed] [Google Scholar]
- 54.Tsvetkov L, Xu X, Li J, Stern DF. Polo-like kinase 1 and Chk2 interact and co-localize to centrosomes and the midbody. J Biol Chem. 2003;278:8468–75. doi: 10.1074/jbc.M211202200. [DOI] [PubMed] [Google Scholar]
- 55.Shen K, Wang Y, Brooks SC, Raz A, Wang YA. ATM is activated by mitotic stress and suppresses centrosome amplification in primary but not in tumor cells. J Cell Biochem. 2006;99:1267–74. doi: 10.1002/jcb.20848. [DOI] [PubMed] [Google Scholar]
- 56.Huang X, Kurose A, Tanaka T, Traganos F, Dai W, Darzynkiewicz Z. Sequential phosphorylation of Ser-10 on histone H3 and Ser-139 on histone H2AX and ATM activation during premature chromosome condensation: Relationship to cell cycle and apoptosis. Cytometry A. 2006;69:222–9. doi: 10.1002/cyto.a.20257. [DOI] [PubMed] [Google Scholar]
- 57.Juan G, Pan W, Darzynkiewicz Z. DNA segments sensitive to single strand specific nucleases are present in chromatin of mitotic cells. Exp Cell Res. 1996;227:197–202. doi: 10.1006/excr.1996.0267. [DOI] [PubMed] [Google Scholar]
- 58.Jiang N, Wang X, Jhanwar-Uniyal M, Darzynkiewicz Z, Dai W. Polo-box domain of PLK3 functions as a centrosome localization signal, overexpression of which causes mitotic arrest, cytokinesis defects, and apoptosis. J Biol Chem. 2006;281:10577–82. doi: 10.1074/jbc.M513156200. [DOI] [PubMed] [Google Scholar]
- 59.Fernandez-Capetillo O, Lee A, Nussenzweig M, Nussenzweig A. H2AX: the histone guardian of the genome. DNA repair. 2004;3:959–67. doi: 10.1016/j.dnarep.2004.03.024. [DOI] [PubMed] [Google Scholar]
- 60.Kramer A, Lukas J, Bartek J. Checking out the centrosome. Cell Cycle. 2004;3:1390–3. doi: 10.4161/cc.3.11.1252. [DOI] [PubMed] [Google Scholar]
- 61.Bonnet J, Coopman P, Morris MC. Characterization of centrosomal localization and dynamics of Cdc25C phosphatase in mitosis. Cell Cycle. 2008;7:1991–8. doi: 10.4161/cc.7.13.6095. [DOI] [PubMed] [Google Scholar]
- 62.Nuzzenzweig A. Causes and consequences of the DNA damage response. Cell Cycle. 2007;6:2339–40. doi: 10.4161/cc.6.19.4995. [DOI] [PubMed] [Google Scholar]
- 63.Blagosklonny MV. Prolonged mitosis versus tetraploid checkpoint: how p53 measures the duration of mitosis. Cell Cycle. 2006;5:971–5. doi: 10.4161/cc.5.9.2711. [DOI] [PubMed] [Google Scholar]
- 64.Blagosklonny MV. Mitotic arrest and cell fate: why and how mitotic inhibition of transcription drives mutually exclusive events. Cell Cycle. 2007;6:70–4. doi: 10.4161/cc.6.1.3682. [DOI] [PubMed] [Google Scholar]
- 65.Broude EV, Demidenko ZN, Vivo C, Swift ME, Davis BM, Blagosklonny MV, Roninson IB. p21 (CDKN1A) is a negative regulator of p53 stability. Cell Cycle. 2007;6:1468–71. [PubMed] [Google Scholar]
- 66.Tanaka T, Huang X, Halicka HD, Zhao H, Traganos F, Albino AP, Dai W, Darzynkiewicz Z. Cytometry of ATM activation and histone H2AX phosphorylation to estimate extent of DNA damage induced by exogenous agents. Cytometry A. 2007;71:648–61. doi: 10.1002/cyto.a.20426. [DOI] [PMC free article] [PubMed] [Google Scholar]
- 67.Boutros R, Dozier C, Ducommun B. The when and wheres of CDC25 phosphatases. Curr Opin Cell Biol. 2006;18:185–91. doi: 10.1016/j.ceb.2006.02.003. [DOI] [PubMed] [Google Scholar]
- 68.Blagosklonny MV, Robey R, Bates S, Fojo T. Pretreatment with DNA-damaging agents permits selective killing of checkpoint-deficient cells by microtubule-active drugs. J Clin Invest. 2000;105:533–9. doi: 10.1172/JCI8625. [DOI] [PMC free article] [PubMed] [Google Scholar]
- 69.Chen L, Gilkes DM, Pan Y, Lane WS, Chen J. ATM and Chk2-dependent phosphorylation of MDMX contribute to p53 activation after DNA damage. EMBO J. 2005;24:3411–22. doi: 10.1038/sj.emboj.7600812. [DOI] [PMC free article] [PubMed] [Google Scholar]
- 70.Del Bino G, Lassota P, Darzynkiewicz Z. The S-phase cytotoxicity of camptothecin. Exp Cell Res. 1991;193:27–35. doi: 10.1016/0014-4827(91)90534-2. [DOI] [PubMed] [Google Scholar]
- 71.Zhao H, Tanaka T, Mitlitski V, Heeter J, Balazs EA, Darzynkiewicz Z. Protective effect of hyaluronate on oxidative DNA damage in WI-38 and A549 cells. Int J Oncol. 2008;32:1159–69. doi: 10.3892/ijo_32_6_1159. [DOI] [PMC free article] [PubMed] [Google Scholar]