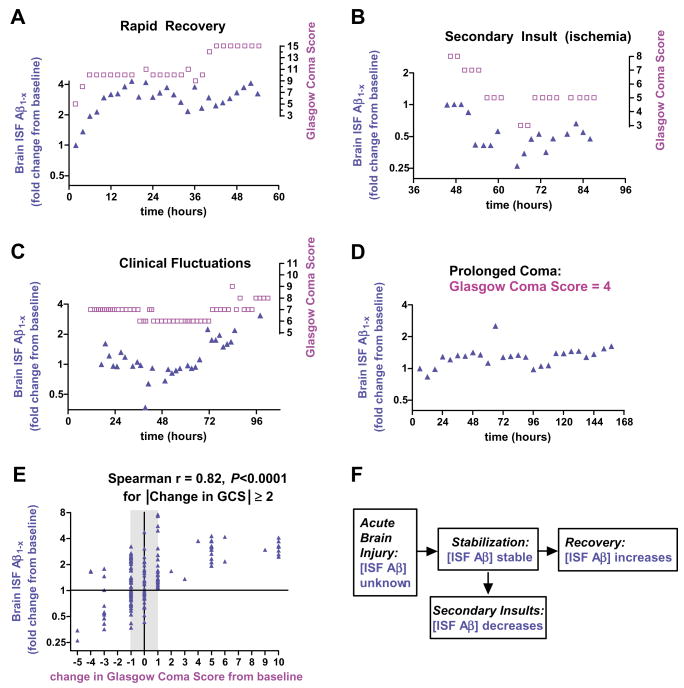
Fig. 4.
Brain ISF Aβ and neurological status. (A to D) Examples of the time course of changes in brain ISF Aβ concentrations and changes in neurological status, as reflected by Glasgow Coma Score (GCS). Aβ changes appear to track (A and B), and in some cases even precede (C), neurological status changes. (E) Correlation of change in brain ISF Aβ from baseline with changes in neurological status across 13 patients in which serial GCS measurements could be reliably obtained (n = 173 paired measurements). (F) Model of brain ISF Aβ dynamics in the setting of acute brain injury.

