

Abstract
We have previously shown that most sites bound by E2F family members in vivo do not contain E2F consensus motifs. However, differences between in vivo target sites that contain or lack a consensus E2F motif have not been explored. To understand how E2F binding specificity is achieved in vivo, we have addressed how E2F family members are recruited to core promoter regions that lack a consensus motif and are excluded from other regions that contain a consensus motif. Using chromatin immunoprecipitation coupled with DNA microarray analysis (ChIP-chip) assays, we have shown that the predominant factors specifying whether E2F is recruited to an in vivo binding site are (1) the site must be in a core promoter and (2) the region must be utilized as a promoter in that cell type. We have tested three models for recruitment of E2F to core promoters lacking a consensus site, including (1) indirect recruitment, (2) looping to the core promoter mediated by an E2F bound to a distal motif, and (3) assisted binding of E2F to a site that weakly resembles an E2F motif. To test these models, we developed a new in vivo assay, termed eChIP, which allows analysis of transcription factor binding to isolated fragments. Our findings suggest that in vivo (1) a consensus motif is not sufficient to recruit E2Fs, (2) E2Fs can bind to isolated regions that lack a consensus motif, and (3) binding can require regions other than the best match to the E2F motif.
The E2F family has been implicated in controlling a myriad of critical cellular (entrance into S phase, regulation of mitosis, apoptosis, DNA repair, and DNA damage checkpoint control) and organismal (regulation of differentiation, development, and tumorigenesis) functions (Slansky and Farnham 1996; Dimova and Dyson 2005; Kong et al. 2007). There are eight genes for E2F family members encoded in the human genome, with one family member (E2F3) encoding two proteins through the use of alternative promoters (for recent reviews of the E2F family, see Dimova and Dyson 2005; DeGregori and Johnson 2006). The highest degree of homology among the E2F family members is in their DNA-binding domains, which is consistent with the finding that in vitro they can all bind to the same consensus motif of TTTSSCGC (where S is either a G or a C). The E2F consensus motif has been derived from a number of different types of experiments, including “lining-up” of known targets (for review, see Slansky and Farnham 1996) and from in vitro casting experiments (Tao et al. 1997). Most E2F family members bind very poorly in vitro unless they are complexed with a member of the DP family of transcription factors (Bandara et al. 1993; Helin et al. 1993; Krek et al. 1993; Dimova and Dyson 2005). To date, high-affinity in vitro binding of E2F1–6 (to any site) has not been observed in the absence of DP1. E2F7 and E2F8 are exceptions to this rule, functioning as homodimers or heterodimers with each other (de Bruin et al. 2003; Di Stefano et al. 2003; Logan et al. 2004, 2005; Christensen et al. 2005; Maiti et al. 2005; Li et al. 2008a). Although very few differences in binding affinity or specificity amongst the E2Fs have been observed in vitro using purified factors and short DNA oligonucleotides, family member binding specificity could perhaps be achieved in vivo through interactions with other proteins and/or competition amongst the E2F family members for binding sites. If so, then comprehensive analyses of in vivo binding sites should reveal unique sets of targets for the different E2F family members. However, our recent analysis of E2F family member binding using ChIP-chip assays in five different cell types (Xu et al. 2007) revealed very few differences in the sets of promoters bound by the different E2Fs. For example, 70%–80% of the top ranked 2000 binding sites in HeLa cells were the same when comparing the results of E2F1, E2F4, and E2F6 ChIP-chip assays. Thus, although binding specificity has been observed in some cases (Schlisio et al. 2002; Wells et al. 2002; Giangrande et al. 2003), in general, the E2Fs bind to similar sets of target genes.
Because all of the E2Fs have a conserved DNA-binding domain that is necessary and sufficient for binding to the consensus motif (Helin et al. 1993) and we found a high overlap in sets of targets of the different E2Fs, it might be expected that the sites bound in vivo by E2F family members would, in general, contain consensus sites. Surprisingly, we have found that a very small percentage of the regions bound in vivo by E2F1, E2F4, or E2F6 contain consensus E2F motifs (Weinmann et al. 2002; Bieda et al. 2006; Xu et al. 2007). ChIP-chip studies of other transcription factors have also shown a low percentage of in vitro-derived consensus motifs in the set of in vivo binding sites. For example, only 13% of POU5F1 (OCT4) binding sites identified using ChIP-chip assays with genomic tiling arrays contain the conventional POU5F1 motif (Jin et al. 2007). Of course, the percentage of sites identified as positive for a motif increases when a position weight matrix (PWM) is used instead of a strict consensus. However, it is important to use cut-off criteria that provide more matches to the PWM in a set of targets than in a matched set of nontargets. Using criteria that showed a twofold enrichment of sites matching the PWM in the target compared with the nontarget set (0.88 match to the core and 0.85 match to the consensus), up to 70% of the targets could be classified as having a match to a POU5F1 PWM. However, there were still ∼30% of the sites that did not fit the POU5F1 PWM. These results are similar to those of Hollenhorst et al. (2007), who showed that most ETS1-specific targets did not have a strong match to the PWM, and of Carroll et al. (2005), who showed that the estrogen receptor (ESR1) binding site consensus was present in only 49% of the in vivo binding sites. Other studies have found that the percentage of in vivo binding sites having a good match to an in vitro-derived PWM is usually only two- to eightfold higher in a set of targets versus a set of nontarget binding sites (Cawley et al. 2004; Ji et al. 2006). Also, Li et al. (2008b) found that although the expected motifs of DNA-binding factors are enriched in bound regions identified using ChIP-chip, the enrichment is quite modest. For example, 80% of the top-ranked Bicoid (BCD) binding sites contain no predicted recognition site and 20% do not contain any intermediate affinity motifs.
In most cases, differences between in vivo target sites that contain or lack a consensus motif (or strong match to the PWM) and sites that do not contain a consensus or strong match to the PWM have not been explored. The purpose of this current study was to characterize the binding sites (and nearby genes) that contain or lack a consensus E2F binding motif. In particular, we investigated whether E2F motif-containing target promoters regulate different types of genes, whether the consensus versus nonconsensus sites show different binding affinities, and whether the set of E2F target promoters containing consensus motifs is more conserved throughout evolution than the set of E2F target promoters that lack a consensus. In addition, we analyzed the E2F consensus motifs found in core promoter regions that are not bound by E2F family members to determine how E2Fs are excluded from these sites. Finally, we tested various models that could specify the mechanism of recruitment of E2Fs to binding sites that lack consensus motifs.
Results
Characterization of the E2F consensus motifs that are not bound by E2F1
Our previous studies (Bieda et al. 2006; Xu et al. 2007), indicating that only 4%–10% of the identified in vivo E2F binding sites contain a consensus E2F motif, had focused on a relatively small set (∼100–200) of E2F binding sites found using genomic tiling arrays representing 1% of the human genome. This small number of binding sites was not optimal for further characterization of the genes regulated by regions containing versus lacking a consensus E2F motif. It was also possible that analysis of a larger set of binding sites would reveal a different percentage of E2F consensus motifs. Therefore, we have now analyzed ChIP-chip data from arrays containing all known human promoters. Using duplicate E2F1 ChIP-chip data from MCF7 cells (Xu et al. 2007), we calculated the promoter enrichment values by averaging the six highest consecutive probes (as determined by the ChIP signal divided by the Input signal) for each promoter (see Supplemental Table S1 for a list of all of the arrays analyzed in this study and Supplemental Table S2 for the enrichment values from the promoter arrays). We then averaged the enrichment values from the two arrays for each promoter, ranked the promoters by their average enrichment values, and binned them into sets of 100. Next, we identified all of the promoters on the array that contained a consensus E2F site (TTTSSCGC) within the 1.5-kb region of each promoter that was represented on the array. The ratio of promoters in each bin that contained a consensus E2F site was then plotted vs. rank (Fig. 1). Analysis of the ∼24,100 promoters on the human array indicated that there are 2028 E2F consensus motifs, 462 in the top 2000 E2F1 target promoters (having an average log2 enrichment value of 1.23) and 1566 in the remaining 22,100 promoters (having an average log2 enrichment value of 0.19).
Figure 1.

Most E2F1 binding regions do not contain a consensus E2F motif. Using E2F1 ChIP-chip data from two biologically independent cultures of MCF7 cells (Xu et al. 2007), we called peaks for each of the ∼24,100 1.5-kb promoter regions. We ranked the promoters by the enrichment values (E2F1 IP vs. Input) of the peaks and then binned the promoters into ranked sets of 100 (x-axis). The ratio of promoters in each bin that contain a consensus E2F site is indicated on the y-axis. For comparison, the approximate location of the bin containing the CCNA1 promoter, a well-characterized E2F target, is shown.
It was possible that the “unbound” E2F consensus motifs were bound by other E2Fs or were unavailable for binding due to being located in silenced chromatin. To determine why the 1566 E2F consensus motifs were not bound by E2F1 in MCF7 cells, we examined the results of MCF7 ChIP-chip assays performed using antibodies to E2F4 and E2F6 (Xu et al. 2007) and to the silencing marks H3me3K9, H3me3K27, and 5-meC (Komashko et al. 2008). We then determined the percentage of the 1566 unbound E2F motifs that were in the top 2000 of each of these datasets. As shown in Figure 2, a small percentage of E2F consensus motifs not bound by E2F1 can be accounted for by binding of E2F4 or E2F6. The fact that binding of E2F4 and E2F6 accounted for only a small portion of the unbound consensus motifs was expected, because we have previously shown that most promoters that are bound by E2F4 or E2F6 are also bound by E2F1, with a minority of E2F binding sites being family member specific (Xu et al. 2007). We also found that only a small percentage of the promoters containing a consensus E2F motif but not bound by E2F1 were present in silenced chromatin (i.e., in the top 2000 set of H3me3K9, H3me3K27, or 5-MeC target promoters); see also Supplemental Table S4. We note that the small percentage of overlaps we found between the set of 1566 promoters that had consensus sites but were not bound by E2F1 and the set of promoters containing the various silencing marks is similar to the percentage that would be expected if a random set of 1566 promoters were analyzed (see Supplemental Fig. S1).
Figure 2.

Characterization of the promoters that contain E2F consensus motifs but are not bound by E2F1 in MCF7 cells. The set of 1566 consensus E2F1 motifs that were unoccupied by E2F1 in MCF7 cells was compared with the top 2000 targets identified in ChIP-chip assays for E2F4, E2F6, H3me3K7, H3me3K9, and 5-meC (Xu et al. 2007; Komashko et al. 2008). The percentage of promoters in the “unoccupied E2F motif” set that was bound by E2F4 or E2F6, which was found in silenced chromatin (but not bound by E2F4 or E2F6), or was in silenced chromatin and bound by E2F4 or E2F6 is shown. The number of the 1566 promoters bound by the various combinations of silencing marks and E2Fs are shown in Supplemental Table S4. For comparison, the overlap between the silencing marks and a set of 1566 randomly chosen promoters is shown in Supplemental Figure S1.
The analyses described above were specifically focused on core promoter regions. It was possible that silenced chromatin could play a larger role in preventing E2F binding to consensus motifs throughout the genome at locations other than promoter regions. To examine this possibility, we performed ChIP assays using antibodies to E2F4, H3me3K27, H3me3K9, and 5-MeC (two independent ChIP assays were performed for each antibody), prepared amplicons, and analyzed the samples using ENCODE arrays that represent 44 regions (∼1% of the human genome) ranging from 500 kb to 2 Mb. We first identified 116 E2F4 binding sites using the L1 level of the Tamalpais peak calling program (http://chipanalysis.genomecenter.ucdavis.edu/cgi-bin/tamalpais.cgi; Bieda et al. 2006). Next, we compared these experimentally identified E2F binding sites to the 507 consensus E2F motifs located in the ENCODE regions. We found that only 16 of the consensus E2F motifs were occupied by E2F4 (Fig. 3A). We note that although only 16 binding sites contained a consensus motif, this is significantly more than expected by random chance (see Methods). We next characterized the 16 occupied E2F consensus motifs and the 491 unoccupied E2F consensus motifs for their position relative to the start site of a known gene using the Gencode database. We found that 75% of the occupied, but only 17% of the unoccupied consensus E2F motifs were within 2 kb of a start site (Fig. 3B). Thus, there is a striking correlation between location of the motif (relative to a gene) and occupancy. To determine whether the unoccupied E2F consensus motifs were located in silenced chromatin, we needed to identify the genomic regions marked by H3me3K27, H3me3K9, and methylated DNA in the ENCODE regions of MCF7 cells. The Tamalpais program, which was developed for identifying the sharp, isolated peaks that characterize binding patterns for site-specific transcription factors, is very accurate when the raw data is “peak-like” (Bieda et al. 2006; Johnson et al. 2008). However, silenced regions of the genome are often quite large and do not always show peak-like binding patterns. These extended “regions” are not accurately analyzed by the Tamalpais program (see Supplemental Fig. S2). Therefore, we developed a new program, called fdrPeaks (false discovery rates define Peaks) that can identify both “peaks” and “regions” that are bound by a particular factor, histone modification, or methylated DNA (see Supplemental Methods for a description of the program). A comparison of the regions called by Tamalpais and fdrPeaks on two 5-MeC ChIP-chip arrays is shown in Supplemental Figure S2. Having developed a program that accurately identifies the regions bound by silenced chromatin, we then determined which of the unoccupied 491 E2F consensus motifs were present in silenced chromatin. As shown in Figure 3C, ∼15% of the motifs were in silenced chromatin, the vast majority of which were within regions of methylated DNA. In summary, the location relative to the start site of a gene is more predictive of whether a consensus E2F motif is occupied than is the presence of silenced chromatin. However, some consensus E2F motifs can be silenced by DNA or histone methylation. As shown in Figure 3D, a region of chromosome 19 has CpG methylation in MCF7 cells specifically over several E2F consensus motifs.
Figure 3.

Characterization of unbound E2F consensus motifs in ENCODE regions. (A) The overlap of the 116 experimentally determined E2F4 sites and the 507 consensus E2F motifs in the ENCODE regions are shown. (B) The percentage of occupied vs. unoccupied consensus E2F motifs that are located within 2 kb of the start site of a known gene are shown. (C) Shown are the percentages of unoccupied E2F consensus motifs in the ENCODE regions that are within the regions identified to be bound by H3me3K27, H3me3K9, and 5-MeC. (D) Shown is a region of chromosome 19, along with the binding pattern of E2F4, H3me3K27, H3me3K9, and 5-MeC and the location of the consensus E2F motifs and start codons.
As a further investigation of a set of unoccupied E2F consensus motifs (Supplemental Fig. S3), we performed additional ChIP assays using antibodies to histone modifications that have been associated with silenced chromatin (H3me1K27, H3me3K27, H3me2K9, H3me3K9, and H4K20me3), with transcribed regions (H3K36me3 and H3K79me2), and with promoter regions (H3K4me3 and H3K9Ac). We also included E2F1 as a control to ensure that the array data was correct (i.e., that the tested sites were in fact not bound by E2F1 in MCF7 cells). We used the MYC promoter as a positive control for an E2F1 target gene in MCF7 cells. As expected, E2F1 was bound to the MYC promoter, but not to the nine promoters that were identified as “unbound” in the ChIP-chip assays. We confirmed very low binding of H3me3K9 or H3me3K27 to the nine tested promoters and also saw low binding of H3me1K27, H3me2K9, and H4K20me3 (although RAG2 and PHEX have small amounts of H3me1K27). These results support the ChIP-chip data that indicated that the lack of binding of E2F1 to the majority of E2F consensus motifs is not due to repressed chromatin structure. However, as shown above, there is a striking correlation between occupancy of an E2F consensus motif and the location of the motif within a core promoter region. Therefore, it was possible that the lack of binding of E2F1 was due to the fact that the regions on the promoter array that contain an E2F consensus motif but were not bound by E2F1 were, in fact, not promoters. Others have recently reported that most promoters, regardless of whether they are active or inactive in a particular cell type, display H3me3K4 and/or H3AcK9 modifications (Barski et al. 2007; Bernstein et al. 2007; Guenther et al. 2007; Heintzman et al. 2007; Mikkelsen et al. 2007). As shown in Supplemental Figure S3, only one of the tested fragments (UNC119) that contain an E2F1 consensus motif but are not bound by E2F1 has the “promoter-specific” marks. Recent studies have shown that transcribed regions are marked by H3me3K36 or H3me2K79 (Barski et al. 2007; Mikkelsen et al. 2007). Therefore, to determine whether the unoccupied E2F consensus motifs are within transcribed regions instead of in promoter regions, we performed ChIP assays using antibodies to H3me3K36 and H3me2K79. We found that many of the regions containing unoccupied E2F consensus motifs are characterized by the presence of H3me3K36 and/or H3me2K79, suggesting that the unoccupied E2F motif-containing fragments on the promoter arrays are not utilized as promoters in MCF7 cells, but instead are within transcribed regions. As shown in Supplemental Figure S4, this finding is supported by the fact that for PGBD3 and RAG2, transcripts have been identified in which these fragments are internally located. However, we stress that transcripts have also been identified that originate from these regions, suggesting that they may be utilized as promoters (and perhaps be bound by E2F family members) in other cell types.
E2F1 target promoters lacking a consensus motif have similar enrichment values as those having a consensus motif
Inspection of Figure 1 indicates that 28% of the top 1000 targets contain an E2F consensus motif. Although we used average enrichment values for two independent ChIP-chip experiments, it was possible that some of the top-ranked promoters that lacked an E2F consensus motif were false positives (due to having an inappropriately high enrichment on one of the two arrays). To eliminate this possibility, we analyzed only those promoters that were in the set of top 1000 ranked promoters on both individual arrays. Analysis of this robust set of 730 targets revealed that only 153 promoters (21%) contained a consensus E2F motif (Table 1). Thus, the percentage of consensus motif-containing promoters is quite low, even for a set of targets that were highly ranked in two independent ChIP-chip experiments. One can increase the percentage of consensus motif-containing targets by restricting the set to the very top ranked sites. For example, 50% of the top 20 ranked targets have a consensus motif (see Fig. 1). However, we note that we have previously validated binding of E2Fs to thousands of target promoters (Bieda et al. 2006; Xu et al. 2007) and that well-established E2F target genes fall quite far down the rank ordered list (e.g., rank order on the array for the well-established E2F target genes MYC, RBL1 [p107], POLA1 [DNA polymerase alpha], RAD51, CCND1 [cyclin D1], CCNA1 [cyclin A], and E2F7 are 174, 642, 722, 1008, 1051, 1969, and 2100, respectively). Thus, the low percentage of E2F motif containing targets in the top-ranked 730 promoters is not due to the analysis of too large of a set of targets.
Table 1.
Comparison of E2F motifs in different sets of promoters

aMatch to TTTSSCGC.
bMatch to Transfac PWM BKTSSCGS (>0.9/0.8).
cMatch to PWM (>0.9/0.8), with consensus sites removed.
In addition to the strict E2F consensus motif (TTTSSCGC), others have developed a position weight matrix for E2F1 binding to the motif BKTSSCGS (Wingender et al. 2000), developed from comparison of 13 different binding sites. Due to the ambiguity of almost every position of this motif, a wide variety of sequences can provide a good match to the PWM. In fact, the percentage of the top 730 E2F1 targets that have a reasonable match to this PWM (73%) is not much higher than the percentage of promoters having a match to the PWM from a set of 1000 randomly chosen promoters (54%). The utility of the E2F PWM is weakened even more after removing the sites that both match the PWM and that are exact matches to the consensus, resulting in similar percentages of promoters having a match to the PWM in the set of E2F1 targets, the set of 9422 promoters ranked at the bottom of an E2F1 ChIP-chip experiment, and in a set of 1000 randomly chosen promoters (Table 1). Thus, use of the E2F PWM does not provide any reasonable specificity for identifying E2F binding sites. These results are similar to those of Li et al. (2008b) who found that although the eight highest affinity variants of the Bicoid recognition motif are enriched approximately eightfold in bound regions relative to nonbound regions, the 184 medium affinity variants are present only 1.5-fold more often in bound vs. nonbound regions.
Comparison of enrichment values for E2F1 binding in MCF7 cells showed that there was very little difference between the entire set of 730 top-ranked targets (having a log2 enrichment value of 1.74) and the set of 153 top-ranked consensus motif-containing targets (having a log2 enrichment value of 1.96). Thus, the nonconsensus-containing target regions are just as highly enriched in ChIP assays as are the consensus-containing target regions.
Human and mouse E2F4 target promoters have similar characteristics
All of our ChIP-chip studies to date analyzing E2F target genes (Weinmann et al. 2002; Oberley et al. 2003; Wells et al. 2003; Bieda et al. 2006; Xu et al. 2007) have utilized human cells. To determine whether the low percentage of E2F motif containing target promoters is also true of mouse cells, we performed ChIP-chip assays using mouse 3T3 fibroblasts, hybridizing the samples to arrays containing ∼26,100 1.5-kb mouse promoter regions. Because there is very little E2F1 in asynchronously growing 3T3 cells (Wells et al. 2000), we performed E2F4 ChIP-chip assays in the 3T3 cells. Therefore, for comparison, we also analyzed E2F4 MCF7 ChIP-chip data (Xu et al. 2007). Using a similar analysis as described for Figure 1, we compared the percentage of promoters that contain a consensus E2F motif to different bins of ranked 3T3 and MCF7 E2F4 targets (Fig. 4A). We found that the percentage of consensus motif containing E2F4 target promoters was similar to the percentage of consensus motif containing E2F1 target promoters in MCF7 cells, having a maximal value of 35%–40% in the very top-ranked set of targets. We observed that an even lower percentage of the E2F4 targets in 3T3 cells contained a consensus motif, with the maximal level at ∼27% in the top 200 set. This is most likely due to the fact that there are fewer promoters on the mouse array that have a consensus E2F motif (1565 of the 26,200 mouse promoters) than on the human array (2028 of the 24,100 human promoters). Clearly, the majority of both mouse and human E2F4 target promoters lack a consensus motif. To determine the functional categories of genes containing or lacking a consensus E2F motif that are regulated by E2F4 in the human and mouse cells, we performed a Gene Ontology analysis of the two sets using the program DAVID. The classical view of the role of E2F in cell biology is to regulate genes involved in cell cycle, cell division, DNA repair, and mitosis (DeGregori et al. 1995; Dimova and Dyson 2005; DeGregori and Johnson 2006). However, as shown in Figure 4B, we found that these “classical” categories represent only 2%–5% of the human or mouse E2F4-bound promoters (see also Supplemental Table S3A). Instead, DNA-binding proteins, in particular zinc finger transcription factors, constitute the majority of both sets of target genes.
Figure 4.

Human and mouse E2F4 target promoters have similar characteristics. (A) ChIP-chip assays for E2F4 mouse 3T3 cells were performed and peaks were called for each of the ∼24,000 1.5-kb mouse promoter regions. E2F4 ChIP-chip data from MCF7 cells (Xu et al. 2007) was also analyzed for comparison. We ranked the promoters by the enrichment values (E2F4 IP vs. Input) of the peaks and then binned the promoters into ranked sets of 100 (x-axis). The ratio of promoters in each bin that contain a consensus E2F motif is indicated on the y-axis. (B). Functional annotations were performed using the program Database for Annotation, Visualization, and Integrated Discovery (DAVID) 2007 (Dennis et al. 2003; see also http://niaid.abcc.ncifcrf.gov/). The categories used were InterPro name and SP PIR Keywords. The top categories are shown for the sets human and mouse E2F4 target promoters, derived from the promoters that were in the top 2000 list in duplicate mouse or human ChIP-chip experiments. The x-axis indicates the percentage of each set represented by the different categories; see Supplemental Table S3A for the P-values for each category.
Conserved E2F4 targets are more highly enriched in classical E2F target gene categories, but are not enriched in consensus E2F motifs
It was possible that the set of E2F4 target promoters that were conserved between mouse and human cells might have different characteristics than the nonconserved targets. To examine this possibility, we needed to identify the set of promoters that was in both the human and mouse top-ranked E2F4 target lists. Therefore, we compared the overlap in E2F4 targets in the top 500 and top 2000 sets of ranked promoters for both the MCF7 and 3T3 ChIP-chip assays (Fig. 5A). For comparison, we also determined the overlap expected by chance in two ChIP-chip experiments and the overlap of E2F4 targets in MCF7 versus four other human cell lines (MCF10A breast cells, GM06990 lymphoblasts, HeLa cervical cancer cells, and Ntera2 embryonal testicular carcinomas). We found that ∼40% of the top 2000 E2F4 targets are the same when MCF7 targets are compared with the mouse 3T3 targets and that ∼50%–70% of the top 2000 E2F4 targets are the same in MCF7 vs. the other human cell lines. Thus, many promoters bound by E2F4 are the same in different cell types and in different species. To determine whether the “common” E2F4 targets had different characteristics from the targets identified only in mouse or only in human cells, we performed further DAVID analyses (Fig. 5B). Interestingly, we found that the promoters identified in both MCF7 and 3T3 cells had a higher percentage of genes in the categories of cell cycle, cell division, DNA repair, and mitosis than did the mouse only or human only sets (Fig. 5B; see also Supplemental Table S3B). It is possible that cell cycle-related targets represent a higher percentage of the targets in the conserved set simply because cell division is a function common to both breast epithelial cells and embryonic fibroblasts. However, although enriched for classic E2F target gene functional categories, these Gene Ontology terms still represent a small percentage of the conserved E2F targets. On the other hand, the categories of DNA and RNA binding were fairly similar in the different sets of E2F4 target promoters.
Figure 5.

Conserved E2F4 targets are more highly enriched in classical E2F target gene categories, but are not enriched in consensus E2F motifs. (A) The percentage of promoters that were identified in either the top 500 or top 2000 sets of ranked promoters from both the mouse 3T3 and human MCF7 E2F4 ChIP-chip experiments was determined. For comparison, the percentage expected by random chance and the percentage overlap of E2F4 targets from MCF7 cells with E2F4 targets from four other human cell lines is also shown. (B) Functional annotations were performed as described in Figure 4. The top categories are shown for the sets of E2F4 target promoters identified only in the duplicate human E2F4 MCF7 ChIP-chip experiments (794 promoters), only in the duplicate E2F4 3T3ChIP-chip experiments (977 promoters), or in all four human and mouse E2F4 ChIP-chip experiments (335 promoters). The x-axis indicates the percentage of each set represented by the different categories; see Supplemental Table S3B for the P-values for each category. Shown in the inset is the number of the human and mouse conserved E2F4 target promoters that contain or lack a consensus E2F motif.
Having compared duplicate ChIP-chip arrays from both mouse and human cells, we now had a very robust set of conserved E2F4 target promoters (i.e., these promoters were identified in the set of top-ranked targets in both mouse and both human ChIP-chip experiments). We then determined the percentage of these 335 highly ranked, conserved E2F4 target promoters that contained or lacked a consensus E2F motif. Interestingly, we found that only 23% (78/335) contained a consensus E2F motif (Fig. 5B, inset). Thus, regardless of whether E2F1 or E2F4 binding is analyzed in either or both human or mouse cells, most target E2F promoters lack a consensus site. There are not enough genes in the set of conserved targets that contain a consensus site (78) for reliable Gene Ontology analyses. However, inspection of the sets revealed that ∼10%–20% of both the consensus-containing and consensus-lacking conserved targets encoded genes that are involved in cell cycle regulation.
An intact DNA-binding domain is required for binding to the nonconsensus sites
One mechanism by which E2F could be recruited to core promoters that lack a consensus motif is via protein–protein interactions with another factor, in the absence of direct DNA binding (Fig. 6, Model A). To test this possibility, we created stable cell lines that expressed either wild-type E2F1 or E2F1 that is mutated in the DNA-binding domain. These constructs also included an HA tag (to allow analysis in ChIP assays without interference by signals from the endogenous E2Fs) and a modified ER ligand binding domain to allow regulated translocation to the nucleus. The stable cells were cultured in the absence of 4-hydroxy-tamoxifen and then treated with 4-hydroxy-tamoxifen for 30 min. Nuclear extracts were prepared and Western blots were performed to ensure that the amounts of wild-type and mutant E2F1 were similar (see Supplemental Fig. S5). We first compared the top-ranked promoters identified using the HA antibody in the HA-wtE2F1 cells to the top-ranked promoters identified using an E2F1 antibody in parental (untransfected) MCF7 cells. We found a ∼60% overlap in the top-ranked targets, which is similar to the overlap of many ChIP-chip replicates when the same antibody is used with two completely independent cultures of cells. Thus, the HA-tagged E2F1 (HA-wtE2F1) binds to the same targets as does the endogenous E2F1. We then performed the ChIP-chip assays using the HA tagged E2F1 DNA-binding domain mutant (HA-DBDmut E2F1). These arrays were analyzed in two ways. First, we selected the set of top-ranked HA-wtE2F1 targets. Then, we compared the enrichment values at these promoters in the ChIP-chip assays that measured binding of endogenous E2F1, HA-wtE2F1, or HA-DBDmut E2F1 and enrichment using the HA antibody in MCF7 cells harboring only the HA-ER vector plasmid (Table 2). The top 1000 (or top 2000) promoters on the HA-wtE2F1 array were bound with high enrichment values by both the endogenous and tagged wtE2F1. However, the DNA-binding domain mutant could not bind to these E2F1 targets; the log2 enrichment values were ∼0.5, which is similar to the values at these same promoters when the cells contained only the HA-ER vector. Thus, the top-ranked targets bound by wtE2F1 are not bound by the mutant protein. It was possible that a subset of E2F1 targets (perhaps those having “moderate” enrichment values on the array and not present in the top 1000 or top 2000 target sets) would be bound by the mutant E2F1. To examine this possibility, we next ranked the promoters according to their enrichment on the HA-DBDmut E2F1 arrays. The average enrichment of the top 1000 promoters bound by HA-DBDmut was <0.5, indicating that there is not a large set of promoters bound by the mutant. However, there was a very small set of promoters that showed high binding by the mutant. For example, of the 13,000 promoters on promoter array 1, 18 had an enrichment greater than 1.0, with an average enrichment of 1.33. Unfortunately, the average enrichment value for this set of promoters for the HA vector ChIP-chip experiment was also 1.33, suggesting that these are not true E2F targets, but rather were enriched due to nonspecific interactions. Thus, we found no evidence that E2F1 can be recruited to any promoter strictly by protein–protein interactions, in the absence of a functional DNA-binding domain. This particular E2F1 mutant protein harbors only a two amino acid change and is expressed at high levels in the transfected cells. It also retains its ability to interact with the retinoblastoma tumor suppressor protein and with its heterodimer partner DP1 (Cress et al. 1993; Helin et al. 1993; Helin and Harlow 1994; Halaban et al. 1998), indicating that, in general, it adopts the natural E2F1 protein confirmation. However, we do note that we cannot eliminate the possibility that the double amino acid change eliminates interaction with a specific, unidentified protein partner, either by mutation of an amino acid contact or due to slight alterations in protein folding.
Figure 6.
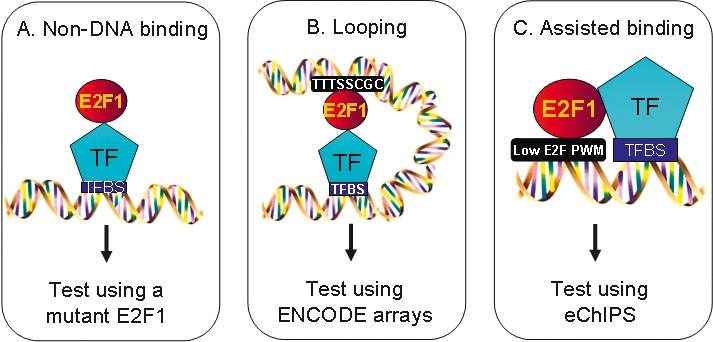
Models for recruitment of E2F1 to promoters that lack a consensus motif. Shown are schematics representing potential modes of E2F1 recruitment via a mechanism independent of its DNA binding domain (A), via looping (B), or via stabilized binding in cooperation with another transcription factor (C).
Table 2.
E2F1 requires a functional DNA-binding domain for recruitment to promoter regions

E2F family members can bind to promoters that lack a consensus motif
A second possible mechanism by which E2F might be bound to a core promoter region that lacks a consensus E2F motif is via looping from a consensus motif located in an upstream or downstream enhancer (Fig. 6, Model B). This would involve E2F1 binding to a distal consensus motif and then engaging in protein–protein interactions with a factor bound in the core promoter region. Due to the fact that formaldehyde can produce both protein–DNA and protein–protein cross-links, both the distal (consensus) site and the core promoter (nonconsensus) site to which the E2F was looped would be pulled down in a ChIP assay. To test this hypothesis, we examined E2F4 binding on genomic tiling (ENCODE) arrays. We could not obtain any evidence to support the hypothesis that E2F4 binds to consensus sites in enhancers and loops to core promoters. Of the 161 high-affinity (L1 from the Tamalpais program) E2F4 binding sites identified in the 44 ENCODE regions, only 16 corresponded to consensus sites, and 12 of the 16 were located at core promoters of known genes. Thus, there are only four possible cases in the ENCODE regions in which E2F binds to a consensus site not located near a start site and thus has the potential to loop to a nearby promoter. Of course, it is also possible that these four sites represent core promoters of novel genes. The disconnect between E2F4 binding and consensus site location is well illustrated in a ∼500-kb region of chromosome 19 (Supplemental Fig. S6). This region shows strong E2F4 binding to the core promoter of the LENG8 and LENG9 genes, which do not contain a consensus motif. There are eight E2F consensus motifs within the 400-kb region shown in Supplemental Figure S6 and 18 consensus E2F motifs within 1,000,000 base pairs surrounding this gene, none of which are bound by E2F4. Therefore, looping from a consensus site would have to come from a consensus motif located a remarkably large distance away.
One way to definitely rule out that the recruitment of E2F1 to core promoters that lack a consensus is via looping from consensus sites is to remove the promoter from its normal chromosomal environment and determine whether E2F1 can continue to bind to the isolated region. A technique commonly used to examine binding of a transcription factor to a particular DNA fragment is an in vitro gel mobility shift assay. However, in vitro binding conditions are not the same as in vivo, and although in vitro binding of E2F1 to a limited number of sites has been demonstrated, there is no reason to assume that binding of E2F to all sites will require similar conditions. Therefore, we have developed an in vivo assay to allow us to test whether E2F family members can bind to isolated DNA fragments. This assay, which is termed eChIP, uses stably transmitted, autonomously replicating, nuclear, extrachromosomal, episomal vectors. These vectors, which contain the EBV origin of replication (oriP) and express the EBNA1 viral replication protein, are stably maintained at 50–100 copies per cell. These vectors are superior to analyzing transcription factor binding to regions that have been stably integrated into the genome because they are not influenced by the site of integration or by protein–protein interactions that may occur between the factors bound to the integrated regions and factors bound to nearby promoters or enhancers. The EBV-based vectors can accommodate very large DNA fragments (>100 kb), replicate just once each cell cycle, and are partitioned faithfully to daughter cells (Conese et al. 2004; Jackson et al. 2006; Lindner and Sugden 2007). Maintenance of the EBV episomal vectors requires both a cis element (an EBV origin of replication called oriP) and a trans-acting factor (the EBV nuclear antigen 1, called EBNA1). Although both oriP and EBNA1 can be on the same vector, the stability of vector maintenance in the cell is improved if EBNA1 is integrated into the cellular genome. Thus, we have used 293c18 cells harboring a stably integrated EBNA1 for our studies. We then introduced into these cells episomal vectors that contained sequences to be analyzed for ChIP studies. We note that the original data concerning E2F binding to the target sites was from MCF7 cells. However, we confirmed that the same results were also obtained in the 293c18 cells before beginning the eChIP studies; in other words, we found that sites that were bound in MCF7 were also bound in 293c18 cells, and sites that were unoccupied in MCF7 cells were also unoccupied in the 293c18 cells.
To demonstrate the utility of the eChIP assay for in vivo analysis of isolated E2F binding sites, we first created stable cell lines harboring only the episomal vector (with no inserted human promoter) or the episomal vector containing a region of the CRAMP1L gene. We analyzed binding to the episomes by using primers specific to the regions of the episomal vector flanking the cloning site. As seen in the left panel of Figure 7, neither the episome lacking an insert nor the episome containing a region of the CRAMP1L gene was enriched in any of the ChIP samples. However, robust binding was observed for the endogenous MYC promoter for all ChIP samples; confirmation of binding of E2Fs to the endogenous MYC promoter is performed for every eChIP experiment to ensure that only high-quality E2F ChIP samples are analyzed. Next, we created stable cell lines containing episomes harboring promoters that contain a consensus E2F site and showed high enrichment values in the E2F ChIP-chip assays. As shown in Figure 7, middle, the episomes harboring the MYC, CDC23, and HIST1H3F promoters were all enriched in the E2F1 and E2F4 ChIP samples, but not in the IgG samples. We also created stable cell lines containing episomes harboring promoters that contain a consensus E2F site, but did not show high enrichment values in the E2F ChIP-chip assays. Interestingly, these promoters, which were in the “unbound” categories from the array data, are not bound by E2F1 or E2F4 in the eChIP assays, even though they contain a consensus E2F site. Analysis of the endogenous MYC promoter in the same samples demonstrates that the lack of binding to these episomes was not due to failure of the ChIP assays. Thus, these experiments indicate that the eChIP assay reproduces the ChIP-chip results and provides assurance that eChIP assays can be used to examine E2F family members binding in vivo to isolated genomic regions containing experimentally defined E2F binding sites. Importantly, these results demonstrate that, unlike in vitro assays in which every consensus E2F motif tested can be bound by the E2Fs in the nuclear extract, eChIP assays reflect the biological relevance of a consensus site.
Figure 7.

Establishment of the eChIP assay. (Left) Analysis of E2F1 and E2F4 ChIP samples in cells harboring the episomal negative controls: the empty episomal vector (left, bottom) and an episome containing a portion of the transcribed region of CRAMP1L (left, top). (Middle) Binding of E2F1 and E2F4 to episomes containing a 500-bp fragment of the MYC, CDC23, or HIST1H3F promoters, all of which possess a consensus E2F motif and were previously shown to be bound by E2Fs in the ChIP-chip experiments. (Right) Binding of E2F1 and E2F4 to episomes containing a 500-bp fragment of the RASSF5, RAG2, or PGBD3 promoters, all of which possess a consensus E2F motif, but were previously shown not to be bound by E2Fs in the ChIP-chip experiments. For all experiments, IgG was used as a negative control antibody and binding to the endogenous MYC promoter was analyzed as a positive control for E2F enrichment. Furthermore, the binding of E2F1 and E2F4 to the corresponding endogenous promoters was analyzed in all of the eChIP samples.
Having demonstrated that the eChIP assay can detect E2F binding to target promoters that contain a consensus E2F site, we next tested whether E2Fs can bind to target promoters that lack a consensus motif when the regions are transferred onto an episome. The region on chromosome 6 between 26,364,000 and 26,324,000 contains seven histone genes, three of which are strong E2F1 targets in MCF7 cells. Two of the strongly enriched histone promoters contain consensus E2F sites (HIST1H2AE and HIST1H3F), but the HIST1H1D promoter does not contain a consensus E2F motif and has no good match to the E2F PWM. It was possible that the HIST1H1D promoter could be regulated by looping from a bound E2F consensus motif located at one of the other histone promoters within the cluster. To test this possibility, we cloned the two histone promoters that were bound by E2F1 and contained a consensus site and the histone HIST1H1D promoter that was bound by E2F1 but lacked a consensus site into the episomal vector, created stable cell lines, and analyzed binding of E2F1 and E2F4 to the episomal constructs. As expected, the HIST1H2AE and HIST1H3F core promoter regions, which contain consensus E2F motifs and show high enrichment in the ChIP-chip assays, are bound by E2Fs when analyzed in eChIP assays (Fig. 8). We also found that a 500-bp region of the HIST1H1D promoter was strongly bound by E2Fs when analyzed using an eChIP assay. Thus, although relatively close to consensus E2F motifs in its natural genomic location, the nonconsensus motif-containing HIST1H1D promoter can directly recruit E2F1. We selected eight other promoters that lack a consensus E2F motif, cloned the promoter fragments into the episomal vector, and created stable cell lines containing each construct. We then performed eChIP assays using E2F antibodies and analyzed binding to the episomes and to the endogenous MYC promoter (as our positive control for each assay); the results of the eChIP assays are tabulated in Table 3. In total, we found that seven of the nine E2F target promoters that lacked a consensus E2F site were bound by E2F1 when isolated from their normal chromatin context and analyzed in the eChIP assay. These results, which demonstrate binding of E2F1 to promoter regions that lack a consensus motif, do not support the model that (at least for the majority of the tested promoters) E2F is detected at the core promoter due to protein–protein interactions mediated by looping from a distal consensus motif (Model B).
Figure 8.

Analysis of the chromosome 6 histone cluster using eChIP assays. (A) The binding pattern of E2F1 and E2F4 in MCF7 cells to a portion of the histone cluster on chromosome 6 is shown. (B) Binding of E2F1 and E2F4 to 500-bp regions of the HIST1H2AE, HIST1H3F, and HIST1H1D promoters, as well as to a 150-bp region of the HIST1H1D promoter, is shown. The binding of E2F1 and E2F4 to the endogenous histone promoters and to the endogenous MYC promoter (as a positive control for the ChIP samples) was also analyzed. (C) A schematic of the hg17 chromosomal coordinates of the 500- and 150-bp constructs of the HIST1H1D promoter is shown; the location of the best match to E2F positional weight matrix (PWM) within the cloned in region is also indicated.
Table 3.
Summary of eChIP experiments

NA, Not applicable.
Mapping the binding site using eChIP
A third model (Model C) that could account for E2F recruitment to regions that lack a consensus motif is “assisted binding.” In this model, the DNA-binding domain of E2F1 would be necessary (as indicated by the inability of the HA-DBDmutE2F1 to bind to the promoters) and E2Fs would bind to sites that weakly match the PWM, but lack a consensus motif. Although both target and nontarget promoters on the array contain matches to the PWM (see Table 1), binding of E2F1 to the target promoters could be enhanced due to specific interactions of E2F1 with other factors that bind to the target, but not to the nontarget set of promoters. This model, which predicts that the best match to the E2F PWM that is contained within the core promoter region is required for recruitment of E2F1, can be tested by inserting progressively smaller fragments into the episomal vector. Unfortunately, each fragment must be cloned into the episome and then selected as a stable cell line. Therefore, we could only analyze a subset of the nonconsensus E2F target promoters. We chose to test Model C for the HIST1H1D and TIMELESS promoters, both of which show high enrichment on ChIP-chip assays, but do not contain consensus E2F motifs in the core promoter regions. We began by comparing binding of E2F1 and E2F4 to a 500- and a 150-bp region of the HIST1H1D promoter (Fig. 8). We found that the 150-bp fragment, which contains the best match to the E2F PWM, is sufficient for recruitment of E2Fs in the eChIP assay. We then tested several different fragments from the TIMELESS promoter (Fig. 9). Regions spanning 500, 300, or 150 nt were cloned into the episomal vector, stable cell lines were created, and binding of E2Fs was tested using the eChIP assay. We found that the 500- and 300-bp fragments could recruit E2F1, but the 150-bp fragment was not able to recruit E2F1 in the eChIP assay. Thus, in this case, the best match to the E2F PWM is not sufficient for direct binding. To determine whether the best match to the E2F PWM is necessary to recruit E2F family members to the TIMELESS promoter, we created a construct containing ∼300 nt of the core promoter region, but lacking the E2F PWM. A stable cell line was created harboring this episomal construct and binding was tested using the eChIP assay. We found that deletion of the E2F PWM eliminated binding of E2F1 and E2F4 to the TIMELESS promoter. Thus, a region containing the best (albeit quite poor) match to the E2F PWM is necessary, but not sufficient for recruitment of E2F family members, to the TIMELESS promoter, providing support for the assisted binding model.
Figure 9.

Delineation of the E2F recruitment site at the TIMELESS promoter. (A) Binding of E2F1 and E2F4 to various fragments of the TIMELESS promoter is shown. The binding of E2F1 and E2F4 to the endogenous TIMELESS promoter and to the endogenous MYC promoter was also analyzed in the same samples as positive controls. (B) A schematic of the hg17 chromosomal coordinates of the tested fragments of the TIMELESS promoter is shown; the location of the best match to the E2F positional weight matrix (PWM) within the cloned in region is also indicated.
Discussion
The main purpose of our study was to develop an understanding of how E2F-binding specificity is achieved in vivo. In particular, we have addressed how E2F family members are recruited to core promoter regions that lack a consensus and are excluded from other regions that contain a consensus E2F motif. We have tested three models for recruitment of E2F to core promoters lacking a consensus site, including (1) indirect recruitment, (2) looping to the core promoter mediated by an E2F bound to a distal consensus motif, and (3) direct binding of E2F to a site that weakly resembles an E2F consensus motif within the core promoter. To test these models, we developed a new in vivo assay, termed eChIP, which allows analysis of transcription factor binding to chromatinized fragments lacking consensus motifs. Our findings suggest that direct binding of E2F to a core promoter can require regions other than the “best” match to the E2F PWM.
We found that only a minority of consensus sites that are not bound by E2F1 are instead bound by another E2F or are embedded in silenced chromatin. Instead, we found a striking correlation in occupancy of an E2F site and location relative to the start site of transcription. In general, consensus motifs that are not bound by E2F family members are not located in core promoter elements. For example, only 86 of the 495 (17%) consensus E2F motifs located in the ENCODE regions that were not bound by E2F4 in MCF7 cells were within 2 kb of a promoter region. In addition, eight of nine tested regions containing consensus E2F motifs that were not bound by E2F4 did not have the histone modifications normally associated with core promoter regions. Many of these regions appeared to be within actively transcribed regions, suggesting that in MCF7 cells those genes must utilize different promoters. This is in accordance with recent findings that many genes contain alternative promoter regions (Kimura et al. 2006). Therefore, the predominant factors specifying whether E2F is recruited to an in vivo binding site are (1) the site must be in a core promoter and (2) the promoter must be utilized as a promoter by the transcriptional machinery in that particular cell type.
Promoters that are utilized in a particular cell type display specific histone modifications, especially acetylation of histone H3 and H4, suggesting the possibility of a link between binding of E2F and histone acetylation. Although it is generally difficult to separate cause and effect (i.e., does E2F binding cause the histone modifications or is E2F binding dependent upon the histone modifications), a recent study has addressed these possibilities at one particular promoter. Leung et al. (2008) have shown that knockdown of MYC results in loss of acetylation on histone H4 and loss of E2F1 binding to the E2F2 promoter. They propose that binding of MYC to the E2F2 promoter causes increased histone acetylation at the promoter region and thus provides access of E2F1 to its binding site. It is likely that factors other than MYC could also function in a similar manner to provide open chromatin structure, and thus E2F access, at different subsets of promoters. If E2Fs are in fact dependent upon specific histone modifications for their recruitment, it is not clear whether this would be because binding of E2F requires prior binding of other factors (such as the general transcriptional machinery) or if binding of E2F requires the “loosening” of DNA/histone interactions that result from acetylation of the N-terminal tails of histones.
Previous studies have shown that the E2F consensus motif is the most highly preferred binding site in vitro (Tao et al. 1997) and a myriad of gel mobility shift assays have confirmed that mutation of key residues in the consensus motif eliminates E2F binding in vitro. However, we found that only a small percentage of in vivo E2F binding sites contain a consensus E2F motif and that not all consensus motifs are bound in vivo. As discussed above, others have also found that a low percentage of experimentally determined in vivo binding sites contain the expected motif (Cawley et al. 2004; Carroll et al. 2005; Jin et al. 2007; Li et al. 2008b). Differences in binding-site sequence preferences for a transcription factor between in vitro and in vivo assays could be related to the existence of multiple protein partners for a given factor. Such “assisted” or “cooperative” binding is not easily optimized using in vitro assays (which often use purified proteins), especially if the partner has not previously been shown to associate with that factor. Also, it is possible that post-translational modifications could modulate the binding specificity of a transcription factor; such modifications may be lost (if using nuclear extract) or not present (if using bacterially-expressed protein). Because the presence of a consensus E2F motif is by far the primary determinant of in vitro binding affinity, we suggest that analyses of E2F binding in vitro are not biologically relevant. Because of the possibility that chromatin may be involved in specifying E2F binding, we felt it important to develop an in vivo binding assay that could allow mutational analyses of binding regions while monitoring E2F/DNA interactions in the context of normal chromatin, but without the influence of surrounding genomic regions. Toward this goal, we developed the eChIP assay, which is based on stably-maintained, self-replicating, extra-chromosomal plasmids. Several advantages of using episomes to monitor transcription factor binding are: (1) Episomes are maintained at 50–100 copies per cell, as opposed to the thousands of copies of plasmids in transient transfection assays. (2) Episomes are not subject to influence from the site of integration. (Promoter regions that are integrated into random chromosomal regions are often silenced if they integrate into heterochromatin or are inappropriately activated if they integrate near an enhancer; in contrast, we have shown [A. Rabinovich and P.J. Farnham, unpubl.] that promoters that are normally silenced in 293 cells by H3me3K9, H3me3K27, or MeC show these same marks when analyzed as episomal constructs.) (3) The stable maintenance of the episome allows a series of ChIP experiments to be performed. (4) Small fragments can be analyzed; most promoters show progressive loss of activity when smaller and smaller regions are stably integrated into the genome, likely due to the fact that the regulation conferred by the surrounding genomic sequences overpowers the activity conferred by the small fragments. Using the eChIP assay, we were able to demonstrate that E2F family members can bind in vivo to small isolated fragments of DNA that lack a consensus site.
Our observation that the region containing the best match to the E2F PWM in the TIMELESS promoter is necessary, but not sufficient for recruitment of E2F suggests that the presence of other transcription factors bound nearby are stabilizing the binding of E2F to the DNA, either through direct protein–protein interactions or via a protein complex. “Assisted” recruitment of E2F family members has been previously reported. For example, mutation of an Sp1 motif adjacent to an E2F-binding site resulted in loss of binding of E2F, as monitored by in vivo footprinting (Karlseder et al. 1996). Also, overexpression of CUX1 can increase the recruitment of E2F1 to the POLA1 promoter, dependent upon a nearby CUX1 binding site (Truscott et al. 2008). Similarly, Giagrande et al. (2003) have shown that both TFE3 and E2F3 are bound to the POLA2 promoter in vivo and that the interaction of either E2F3 or TFE3 with the promoter is facilitated by the presence of both proteins. Our future studies will be focused on further characterizing the mechanisms by which the additional sequence elements of the TIMELESS promoter help to specify E2F recruitment.
Methods
Cell culture
Mouse 3T3 fibroblasts were grown in Dulbecco’s Modified Eagle Medium supplemented with 10% BCS, 4 mM glutamine, and 1% penicillin and streptomycin. Ntera2, MCF7, and 293c18 cells were grown in Dulbecco’s Modified Eagle Medium supplemented with 10% FBS, 2 mM glutamine, and 1% penicillin and streptomycin. MCF10A cells were grown in Clonetics serum-free Mammary Epithelial Growth Medium (MEGM) from Cambrex supplemented with 100 ng/mL cholera toxin from Calbiochem, and all of the contents of the Clonetics MEGM SingleQuots, except for GA-1000. HeLa-S3 cells were grown by the National Cell Culture Center using Jokliks’s modified MEM supplemented with 5% NCS in spinner flask culture. GM06990 were grown by the National Cell Culture Center in Joklik’s modified MEM supplemented with 15% FBS in spinner flask culture. HeLa-S3 and GM06990 cells were cross-linked according to the Young and Chevalier (Whitehead Institute) protocol and obtained from the National Cell Culture Center through the ENCODE consortium (e-mail swaniger@nccc.com) for ChIP analysis. All cells were incubated at 37°C in a humidified 5% CO2 incubator.
Generation of HA-ER-E2F stable cell lines
Stable clones were generated by transfecting MCF7 cells on 6-well dishes with 1 μg of either pCMV-HA-ER, pCMV-HA-ER-E2F1 wild-type, or pCMV-HA-ER-E2F1 (E132) constructs (generous gifts from Kristian Helin, University of Copenhagen, Denmark) using FuGene 6 Transfection Reagent (Roche) according to manufacturer’s recommendations. Forty-eight hours after transfection, the cells were placed under selection in medium containing 1 mg/mL G418. Individual drug-resistant colonies were isolated and assayed for ectopic HA-ER and HA-ER-E2F fusion protein expression by Western Blot analysis of total cellular protein using anti-HA.11 (16B12 clone; Covance) and anti-E2F1 (KH95 clone; Santa Cruz) antibodies. To ensure that the stably integrated fusion proteins properly translocated into the nucleus upon stimulation with 4-hydroxytamoxifen (4-OHT), clones determined to have high ectopic expression of each fusion protein were treated with 600 nM of 4-OHT (Sigma) for 20 min and processed for cytoplasmic and nuclear protein extraction. Briefly, subconfluent cells were harvested after 4-OHT treatment by scraping in ice-cold PBS containing 1 mM phenylmethylsulfonyl fluoride (PMSF) and swelled in ChIP cell lysis buffer. After incubation on ice for 10 min, nuclei were released using a B dounce homogenizer and spun at 4000 rpm for 5 min at 4°C. The supernatant was reserved as the cytoplasmic fraction and the pelleted nuclei were resuspended in ChIP Nuclei Lysis Buffer, left on ice for 10 min, sonicated to reduce viscosity, and spun at 13,200 rpm for 10 min in 4°C. Both the nuclear and cytoplasmic extracts (15 μg) were boiled in SDS sample buffer for 5 min, loaded onto a 10% SDS–polyacrylamide gel and further processed for Western Blot as described previously (Xu et al. (2007). Positive MCF7 clones for each fusion protein were expanded in culture, and subsequently treated for 30 min with 4-hydroxytamoxifen (Sigma) at a final concentration of 600 nM immediately prior to formaldehyde cross-linking and harvesting for ChIP assays.
ChIP assays and amplicons preparation
ChIP assays were performed following the ChIP protocol provided at http://www.genomecenter.ucdavis.edu/farnham and http://genomecenter.ucdavis.edu/expression_analysis. 5-Methylcytidine (5-MeC) ChIPs were performed as described in the MicroChIP protocol (Acevedo et al. 2007), with the exceptions that the cells used in this native ChIP assay were not cross-linked with formaldehyde, but instead harvested by trypsinization, and NaOH was added to the IP dilution buffer at a final concentration of 7 mM to separate the DNA strands during the overnight incubation with the 5-MeC antibody at 4°C. The primary antibodies used in this study were as follows: E2F1 (Upstate Cell Signaling, cat. no. 05-379), E2F4 (Santa Cruz Biotechnology, cat. no. sc-866X), E2F6 (Santa Cruz Biotechnology, cat. no. sc-22823X), HA.11 (16B12 clone; Covance, cat. no. MMS-101P), H3Me2K9 (Upstate Cell Signaling, cat. no. 05-768), H3me3K9 (Abcam, cat. no. ab8898), H4Me3K20 (a generous gift from Thomas Jenuwein, Max Planck Institute, Freiburg, Germany), H3Me1K27 (Upstate Cell Signaling, cat. no. 07-448), H3me3K27 (Upstate Cell Signaling, cat. no. 07-449), H3Me3K36 (Abcam, cat. no. 9050), H3Me2K79 (Abcam, cat. no. 3594), H3AcK9 (Upstate Cell Signaling, cat. no. 07-352), H3Me3K4 (Upstate Cell Signaling, cat. no. 07-473), mouse monoclonal RNA polymerase II 8WG16 IgG2a (Covance, cat. no. MMS-126R), and mouse monoclonal 5-methylcytidine (Eurogentec, cat. no. BI-MECY-0100). The secondary rabbit anti-mouse IgG was purchased from MP Biomedicals (cat. no. 55436). The nonspecific rabbit IgG used as a negative control in the ChIP assays was purchased from Alpha Diagnostics (cat. no. 20009-5). For PCR analysis of the ChIP samples prior to amplicon generation, purified immunoprecipitates (QIAquick PCR purification kit, QIAGEN) were dissolved in 50 μL of water or QIAGEN EB Buffer. Standard PCR reactions using 2 μL of the immunoprecipitated DNA were performed. PCR products were separated by electrophoresis through 1.5% agarose gels and visualized using ethidium bromide. Amplicons were prepared by adapting the standard protocol for the whole-genome amplification using the Sigma GenomePlex WGA2 kit as described in O’Geen et al. (2006). Briefly, the initial random fragmentation step was eliminated and DNA from an entire ChIP sample or from 30 ng of total chromatin was amplified. A detailed protocol for the WGA2 method is provided at http://genomics.ucdavis.edu/farnham and http://genomecenter.ucdavis.edu/expression_analysis. Precipitated DNA from ChIPs with smaller starting material (4–30 μg/assay) was measured by Quant-iT PicoGreen assay (Invitrogen) (Acevedo et al. 2008). DNA was purified and amplified using the Sigma GenomePlex Single Cell WGA4 Kit, as described in Acevedo et al. (2007). PCR positive and negative primers used for ChIP samples and amplicons confirmation are described in Supplemental Table S1.
ChIP-chip assays
Several different promoter array designs were used in this study. Mouse amplicons samples were hybridized to the UCSC mm 5 1.5 kb promoter array, which consists of a single array design containing 26,842 promoters. Human samples were hybridized either to ENCODE arrays, UCSC hg17 1.5-kb promoter arrays or to UCSC hg17 5-kb promoter arrays. The human UCSC hg17 1.5-kb promoter array is a single array design containing 24,275 promoters. The human UCSC hg17 5-kb promoter arrays consist of two individual arrays (promoter 1 and promoter 2), containing a total of 27,295 promoters. The ENCODE arrays contain ∼400 well characterized genes and includes 44 different regions of the genome ranging from 500 kb to 2 Mbp. The exact design used for each experiment is indicated in Supplemental Table S1 (see also www.nimblegen.com, for details concerning each array platform). Amplicons were applied either to mouse promoter arrays or human promoter arrays. The labeling and hybridization of DNA samples for ChIP-chip analysis was performed by NimbleGen Systems, Inc. or at UC Davis. Briefly, each DNA sample (1 μg) was denatured in the presence of 5′-Cy3- or Cy5-labeled random nonamers (TriLink Biotechnologies) and incubated with 100 U of (exo-) Klenow fragment (NEB) and dNTP mix (6 mM each in TE buffer [10 mM Tris/1 mM EDTA at pH 7.4; Invitrogen]) for 2 h at 37°C. Reactions were terminated by addition of 0.5 M EDTA (pH 8.0), precipitated with isopropanol, and resuspended in water. Then, 12 μg of the Cy5-labeled ChIP sample and 12 μg of the Cy3-labeled total sample were mixed, dried down, and resuspended in 40 μL of NimbleGen Hybridization Buffer (NimbleGen Systems). After denaturation, hybridization was carried out in a MAUI Hybridization System (BioMicro Systems) for 18 h at 42°C. The arrays were washed using NimbleGen Wash Buffer System (NimbleGen Systems), dried by centrifugation, and scanned at 5-μm resolution using the GenePix 4000B scanner (Axon Instruments). Fluorescence intensity raw data was obtained from scanned images of the oligonucleotide tiling arrays using NimbleScan 2.2 extraction software (NimbleGen Systems). For each spot on the array, log2-ratios of the Cy5-labeled test sample versus the Cy3-labeled reference sample were calculated. Then, the biweight mean of this log2 ratio was subtracted from each point; this procedure is similar to the mean normalization of each channel. GEO accession numbers for all arrays are provided in Supplemental Table S1.
Analysis of arrays
Regions on the promoter arrays bound by each factor were determined by the median percentile rank method (Iyer et al. 2001; Lieb et al. 2001). We first computed the mean enrichment values of four consecutive probes for the 5-kb promoter arrays and six consecutive probes for the 1.5-kb promoter arrays for each promoter and then ranked the promoters based on the enrichment values from the order of highest to lowest enrichment values. We note that most investigators average all 11 probes that represent each of the 1.5 core promoters when analyzing NimbleGen 1.5-kb arrays (this is the default parameter used by NimbleGen to provide users with their ranked data). We have used all 11 probes and compared the data with our target set obtained using six consecutive probes and the results are essentially identical. However, for the studies in this manuscript we used the six highest consecutive probes instead of all 11 so that we could delineate the location of the E2F motif in a 500–600-bp region rather than using the entire 1500-bp region. For those factors having two ChIP-chip replicates, we determined the targets by finding the overlapping targets from the Top 50, 100, 500, 1000, and 2000 ranked lists. For the analysis of the conserved mouse and human E2F4 targets, we first determined mouse or human E2F4 targets by finding the Top 2000 overlapping targets from the two mouse and two human arrays, respectively. Then, we limited these sets to only those promoters found on both human and mouse array platforms using the NCBI HomoloGene database, which detects and collects the homologs among the annotated genes of several completely sequenced eukaryotic genomes (including the information of the pairs of mouse and human homologous genes; see http://www.ncbi.nlm.nih.gov/sites/entrez?db=homologene). Some genes were represented by more than one promoter on the human and/or mouse arrays. For our analyses, we collapsed all of the promoter regions for a particular gene into a single unit. We then compared the constrained sets to determine which E2F4 targets were identified in both the top-ranked mouse and human ChIP-chip experiments. For the overlap of ChIP-chip data expected by random chance, the random datasets were generated 1000 times from a data set from a 1.5-kb promoter array using our in-house Perl program; we reported the average of the results from 1000 random datasets. The methods used to detect the E2F consensus motif and E2F_PWMs were described in our previous publications (Bieda et al. 2006; Jin et al. 2006).
Functional annotations were performed using the program Database for Annotation, Visualization, and Integrated Discovery (DAVID) 2007 (Dennis et al. 2003; see also http://niaid.abcc.ncifcrf.gov/). The same parameters were used for all analyses presented in this study. These parameters were InterPro name in the Protein Domains section and SP_PIR_Keywords in the Functional Category section. The EASE Score Threshold was set at 0.01.
To determine whether identification of 16 consensus E2F motifs within the 116 experimentally identified 500 bp E2F binding regions on the ENCODE arrays was statistically enriched over random chance, we did the following analyses. First, we randomly retrieved 116 segments with 500 bp length from the ENCODE regions, then scanned them to see how many have an E2F consensus motif; we did this procedure 10,000 times. We found one E2F consensus motif; therefore, the 116 sites are more enriched than expected by random chance (the P-value is much greater than 0.0001). Second, we noted that there are a total of 507 E2F consensus motifs in the entire 30-Mb ENCODE region; 16 occur within the 116 500-bp E2F4 binding regions and 491 occur within ∼30,000 nonbinding segments with a length of 500 bp (note that half of the ENCODE regions are repeat-masked and are not included in this analysis). Using the Fisher test, the enrichment P-value is ∼0; therefore, the identification of the 16 sites was highly significant.
Episomal ChIPs (eChIPs)
All E2F targets (with the exception of MYC) were amplified from the MCF7 genomic DNA template by PCR with Pfx polymerase (Invitrogen) using primers that introduced unique XhoI and HindIII sites immediately 5′ and 3′ to the binding site of interest, respectively. The E2F binding site within the MYC P2 promoter was digested from the XNM-Luc plasmid (Facchini et al. 1997) using XhoI and HindIII enzymes (New England Biolabs). The isolated E2F target sequences were introduced into the pFC62 episome (a generous gift from Fred Chedin, University of California, Davis) using the XhoI and HindIII sites; successful cloning of the various inserts was confirmed by sequencing at the UC Davis Sequencing Facility. The episome constructs (1 μg) were transfected into 293c18 cells stably expressing EBNA1 (a kind gift from Fred Chedin) on 6-well dishes using FuGene 6 Transfection Reagent (Roche) according to manufacturer’s recommendations. Forty-eight hours after transfection, cells were selected in medium containing 500 μg/mL of both G418 (Sigma) and Hygromycin B (CellGro), and drug-resistant colonies were pooled and expanded for ChIP assay. Subconfluent stables were harvested by cross-linking with 1% formaldehyde and swelled in RSB buffer (3 mM MgCl2, 10 mM NaCl, 10 mM Tris-HCl at pH 7.4, and 0.1% IGEPAL CA-330) instead of the normal cell lysis buffer to isolate cross-linked nuclei, and further processed using the standard ChIP protocol.
Acknowledgments
We thank the members of the Farnham lab for helpful discussions, Celina Mojica for performing initial MeC ChIP experiments, Kristian Helin for the HA tagged E2F1 constructs, Linda Penn for plasmids containing the MYC promoter, and Fred Chedin for the episomal vector and cell line expressing EBNA1. This work was supported in part by Public Health Service grant CA45250, HG003129, and DK067889. A.R. was funded in part by the National Institute of Health Molecular and Cellular Biology training grant T32 GM007377-31.
Footnotes
[Supplemental material is available online at www.genome.org. ChIP-chip array data from this study have been submitted to Gene Expression Omnibus [GEO] (http://www.ncbi.nlm.nih.gov/geo/). under accession no. GSE12126.]
Article published online before print. Article and publication date are at http://www.genome.org/cgi/doi/10.1101/gr.080622.108.
References
- Acevedo L.G., Iniguez A.L., Holster H.L., Zhang X., Green R., Farnham P.J. Genome-scale ChIP-chip analysis using 10,000 human cells. Biotechniques. 2007;43:791–797. doi: 10.2144/000112625. [DOI] [PMC free article] [PubMed] [Google Scholar]
- Acevedo L.G., Bieda M., Green R., Farnham P.J. Analysis of the mechanisms mediating tumor-specific changes in gene expression in human liver tumors. Cancer Res. 2008;68:2641–2651. doi: 10.1158/0008-5472.CAN-07-5590. [DOI] [PMC free article] [PubMed] [Google Scholar]
- Bandara L.R., Buck V.M., Zamanian M., Johnston L.H., La Thangue N.B. Functional synergy between DP-1 and E2F-1 in the cell cycle-regulating transcription factor DRTF1/E2F. EMBO J. 1993;12:4317–4324. doi: 10.1002/j.1460-2075.1993.tb06116.x. [DOI] [PMC free article] [PubMed] [Google Scholar]
- Barski A., Cuddapah S., Cui K., Roh T.Y., Schones D.E., Wang Z., Wei G., Chepelev I., Zhao K. High-resolution profiling of histone methylations in the human genome. Cell. 2007;129:823–837. doi: 10.1016/j.cell.2007.05.009. [DOI] [PubMed] [Google Scholar]
- Bernstein B.E., Meissner A., Lander E.S. The mammalian epigenome. Cell. 2007;128:669–681. doi: 10.1016/j.cell.2007.01.033. [DOI] [PubMed] [Google Scholar]
- Bieda M., Xu X., Singer M., Green R., Farnham P.J. Unbiased location analysis of E2F1 binding sites suggests a widespread role for E2F1 in the human genome. Genome Res. 2006;16:595–605. doi: 10.1101/gr.4887606. [DOI] [PMC free article] [PubMed] [Google Scholar]
- Carroll J.S., Liu X.S., Brodsky A.S., Li W., Meyer C.A., Szary A.J., Eeckhoute J., Shao W., Hestermann E.V., Geistlinger T.R., et al. Chromosome-wide mapping of estrogen receptor binding reveals long-range regulation requiring the forkhead protein FoxA1. Cell. 2005;122:33–43. doi: 10.1016/j.cell.2005.05.008. [DOI] [PubMed] [Google Scholar]
- Cawley S., Bekiranov S., Ng H.H., Kapranov P., Sekinger E.A., Kampa D., Piccolboni A., Sementchenko V., Cheng J., Williams A.J., et al. Unbiased mapping of transcription factor binding sites along human chromosomes 21 and 22 points to widespread regulation of noncoding RNAs. Cell. 2004;116:499–509. doi: 10.1016/s0092-8674(04)00127-8. [DOI] [PubMed] [Google Scholar]
- Christensen J., Cloos P., Toftegaard U., Klinkenberg D., Bracken A.P., Trinh E., Heeran M., Di Stefano L., Helin K. Characterization of E2F8, a novel E2F-like cell-cycle regulated repressor of E2F-activated transcription. Nucleic Acids Res. 2005;33:5458–5470. doi: 10.1093/nar/gki855. [DOI] [PMC free article] [PubMed] [Google Scholar]
- Conese M., Auriche C., Ascenzioni F. Gene therapy progress and prospects: Episomally maintained self-replicating systems. Gene Ther. 2004;11:1735–1741. doi: 10.1038/sj.gt.3302362. [DOI] [PubMed] [Google Scholar]
- Cress W.D., Johnson D.G., Nevins J.R. A genetic analysis of the E2F1 gene distinguishes regulation by Rb, p107, and adenovirus E4. Mol. Cell. Biol. 1993;13:6314–6325. doi: 10.1128/mcb.13.10.6314. [DOI] [PMC free article] [PubMed] [Google Scholar]
- de Bruin A., Maiti B., Jakoi L., Timmers C., Buerki R., Leone G. Identification and characterization of E2F7, a novel mammalian E2F family member capable of blocking cellular proliferation. J. Biol. Chem. 2003;278:42041–42049. doi: 10.1074/jbc.M308105200. [DOI] [PubMed] [Google Scholar]
- DeGregori J., Johnson D.G. Distinct and overlapping roles for E2F family members in transcription, proliferation, and apoptosis. Curr. Mol. Med. 2006;6:739–748. doi: 10.2174/1566524010606070739. [DOI] [PubMed] [Google Scholar]
- DeGregori J., Kowalik T., Nevins J.R. Cellular targets for activation by the E2F1 transcription factor include DNA synthesis- and G1/S-regulatory genes. Mol. Cell. Biol. 1995;15:4215–4224. doi: 10.1128/mcb.15.8.4215. [DOI] [PMC free article] [PubMed] [Google Scholar]
- Dennis G.J., Sherman B.T., Hosack D.A., Yang J., Gao W., Lane H.C., Lempicki R.A. DAVID: Database for Annotation, Visualization, and Integrated Discovery. Genome Biol. 2003;4:3. doi: 10.1186/gb-2003-4-9-r60. [DOI] [PubMed] [Google Scholar]
- Di Stefano L., Jensen M.R., Helin K. E2F7, a novel E2F featuring DP-independent repression of a subset of E2F-regulated genes. EMBO J. 2003;22:6289–6298. doi: 10.1093/emboj/cdg613. [DOI] [PMC free article] [PubMed] [Google Scholar]
- Dimova D.K., Dyson N.J. The E2F transcriptional network: Old acquaintances with new faces. Oncogene. 2005;24:2810–2826. doi: 10.1038/sj.onc.1208612. [DOI] [PubMed] [Google Scholar]
- Facchini L.M., Chen S., Marhin W.W., Lear J.N., Penn L.Z. The Myc negative autoregulation mechanism requires Myc-Max association and involves the c-myc P2 minimal promoter. Mol. Cell. Biol. 1997;17:100–114. doi: 10.1128/mcb.17.1.100. [DOI] [PMC free article] [PubMed] [Google Scholar]
- Giangrande P.H., Hallstrom T.C., Tunyaplin C., Calame K., Nevins J.R. Identification of E-box factor TFE3 as a functional partner for the E2F3 transcription factor. Mol. Cell. Biol. 2003;23:3707–3720. doi: 10.1128/MCB.23.11.3707-3720.2003. [DOI] [PMC free article] [PubMed] [Google Scholar]
- Guenther M.G., Levine S.S., Boyer L.A., Jaenisch R., Young R.A. A chromatin landmark and transcription initiation at most promoters in human cells. Cell. 2007;130:77–88. doi: 10.1016/j.cell.2007.05.042. [DOI] [PMC free article] [PubMed] [Google Scholar]
- Halaban R., Cheng E., Zhang Y., Mandigo C.E., Miglarese M.R. Release of cell cycle constraints in mouse melanocytes by overexpressed mutant E2F1 E132, but not by deletion of p16 INK4A or p21 WAF1/CIP1. Oncogene. 1998;16:2489–2501. doi: 10.1038/sj.onc.1201773. [DOI] [PubMed] [Google Scholar]
- Heintzman N.D., Stuart R.K., Hon G., Fu Y., Ching C.W., Hawkins R.D., Barrera L.O., Calcar S.V., Qu C., Ching K.A., et al. Distinct predictive chromatin signatures of transcriptional promoters and enhancers in the human genome. Nat. Genet. 2007;39:311–318. doi: 10.1038/ng1966. [DOI] [PubMed] [Google Scholar]
- Helin K., Harlow E. Heterodimerization of the transcription factors E2F-1 and DP-1 is required for binding to the adenovirus E4 (ORF6/7) protein. J. Virol. 1994;68:5027–5035. doi: 10.1128/jvi.68.8.5027-5035.1994. [DOI] [PMC free article] [PubMed] [Google Scholar]
- Helin K., Wu C.-L., Fattaey A.R., Lees J.A., Dynlacht B.D., Ngwu C., Harlow E. Heterodimerization of the transcription factors E2F-1 and DP-1 leads to cooperative trans-activation. Genes & Dev. 1993;7:1850–1861. doi: 10.1101/gad.7.10.1850. [DOI] [PubMed] [Google Scholar]
- Hollenhorst P.C., Shah A.A., Hopkins C., Graves B.J. Genome-wide analyses reveal properties of redundant and specific promoter occupancy within the ETS gene family. Genes & Dev. 2007;21:1882–1894. doi: 10.1101/gad.1561707. [DOI] [PMC free article] [PubMed] [Google Scholar]
- Iyer V.R., Horak C.E., Scafe C.S., Botstein D., Snyder M., Brown P.O. Genomic binding sites of the yeast cell-cycle transcription factor SBF and MBF. Nature. 2001;409:533–538. doi: 10.1038/35054095. [DOI] [PubMed] [Google Scholar]
- Jackson D.A., Juranek S., Lipps H.J. Designing nonviral vectors for efficient gene transfer and long-term gene expression. Mol. Ther. 2006;14:613–626. doi: 10.1016/j.ymthe.2006.03.026. [DOI] [PubMed] [Google Scholar]
- Ji H., Vokes S.A., Wong W.H. A comparative analysis of genome-wide chromatin immunoprecipitation data for mammalian transcription factors. Nucleic Acids Res. 2006;34:e146. doi: 10.1093/nar/gkl803. [DOI] [PMC free article] [PubMed] [Google Scholar]
- Jin V., Rabinovich A., Squazzo S.L., Green R., Farnham P.J. A computational genomics approach to identify cis-regulatory modules from chromatin immunoprecipitation microarray data—A case study using E2F1. Genome Res. 2006;16:1585–1595. doi: 10.1101/gr.5520206. [DOI] [PMC free article] [PubMed] [Google Scholar]
- Jin V.X., O'Geen H., Iyengar S., Green R., Farnham P.J. Identification of an OCT4 and SRY regulatory module using integrated computational and experimental genomics approaches. Genome Res. 2007;17:807–817. doi: 10.1101/gr.6006107. [DOI] [PMC free article] [PubMed] [Google Scholar]
- Johnson D.S., Li W., Gordon D.B., Bhattacharjee A., Curry B., Ghosh J., Brizuela L., Carroll J.S., Brown M., Flicek P., et al. Systematic evaluation of variability in ChIP-chip experiments using predefined DNA targets. Genome Res. 2008;18:393–403. doi: 10.1101/gr.7080508. [DOI] [PMC free article] [PubMed] [Google Scholar]
- Karlseder J., Rotheneder H., Wintersberger E. Interaction of Sp1 with the growth- and cell cycle-regulated transcription factor E2F. Mol. Cell. Biol. 1996;16:1659–1667. doi: 10.1128/mcb.16.4.1659. [DOI] [PMC free article] [PubMed] [Google Scholar]
- Kimura K., Wakamatsu A., Suzuki Y., Ota T., Nishikawa T., Yamashita R., Yamamoto J., Sekine M., Tsuritani K., Wakaguri H., et al. Diversification of transcriptional modulation: Large-scale identification and characterization of putative alternative promoters of human genes. Genome Res. 2006;16:55–65. doi: 10.1101/gr.4039406. [DOI] [PMC free article] [PubMed] [Google Scholar]
- Komashko V.M., Acevedo L.G., Squazzo S.L., Iyengar S.S., Rabinovich A., O'Geen H., Green R., Farnham P.J. Using ChIP-chip technology to reveal common principles of transcriptional repression in normal and cancer cells. Genome Res. 2008;18:521–532. doi: 10.1101/gr.074609.107. [DOI] [PMC free article] [PubMed] [Google Scholar]
- Kong L.-J., Chang J.T., Bild A.H., Nevins J.R. Compensation and specificity of function within the E2F family. Oncogene. 2007;26:321–327. doi: 10.1038/sj.onc.1209817. [DOI] [PubMed] [Google Scholar]
- Krek W., Livingston D.M., Shirodkar S. Binding to DNA and the retinoblastoma gene product promoted by complex formation of different E2F family members. Science. 1993;262:1557–1560. doi: 10.1126/science.8248803. [DOI] [PubMed] [Google Scholar]
- Leung J.Y., Ehmann G.L., Giangrande P.H., Nevins J.R. A role for Myc in facilitating transcription activation by E2F1. Oncogene. 2008;27:4172–4179. doi: 10.1038/onc.2008.55. [DOI] [PubMed] [Google Scholar]
- Li J., Ran C., Li E., Gordon F., Comstock G., Siddiqui H., Cleghorn W., Chen H.Z., Kornacker K., Liu C.G., et al. Synergistic function of E2F7 and E2F8 is essential for cell survival and embryonic development. Dev. Cell. 2008a;14:62–75. doi: 10.1016/j.devcel.2007.10.017. [DOI] [PMC free article] [PubMed] [Google Scholar]
- Li X.-y., MacArthur S., Bourgon R., Nix D., Pollard D.A., Iyer V.N., Hechmer A., Simirenko L., Stapleton M., Luengo Hendriks C.L., et al. Transcription factors bind thousands of active and inactive regions in the Drosophila blastoderm. PLoS Biol. 2008b;6:e27. doi: 10.1371/journal.pbio.0060027. [DOI] [PMC free article] [PubMed] [Google Scholar]
- Lieb J.D., Liu X., Botstein B., Brown P.O. Promoter-specific binding of Rap1 revealed by genome-wide maps of protein-DNA association. Nat. Genet. 2001;28:327–334. doi: 10.1038/ng569. [DOI] [PubMed] [Google Scholar]
- Lindner S.E., Sugden B. The plasmid replicon of Epstein-Barr virus: Mechanistic insights into efficient, licensed, extrachromosomal replication in human cells. Plasmid. 2007;58:1–12. doi: 10.1016/j.plasmid.2007.01.003. [DOI] [PMC free article] [PubMed] [Google Scholar]
- Logan N., Delavaine L., Graham A., Reilly C., Wilson J., Brummelkamp T.R., Hijmans E.M., Bernards R., La Thangue N.B. E2F-7: A distinctive E2F family member with an unusual organization of DNA-binding domains. Oncogene. 2004;23:5138–5150. doi: 10.1038/sj.onc.1207649. [DOI] [PubMed] [Google Scholar]
- Logan N., Graham A., Zhao X., Fisher R., Maiti B., Leone G., La Thangue N.B. E2F-8: An E2F family member with a similar organization of DNA-binding domains to E2F-7. Oncogene. 2005;24:5000–5004. doi: 10.1038/sj.onc.1208703. [DOI] [PubMed] [Google Scholar]
- Maiti B., Li J., de Bruin A., Gordon F., Timmers C., Opavsky R., Patil K., Tuttle J., Cleghorn W., Leone G. Cloning and characterization of mouse E2F8, a novel mammalian E2F family member capable of blocking cellular proliferation. J. Biol. Chem. 2005;280:18211–18220. doi: 10.1074/jbc.M501410200. [DOI] [PubMed] [Google Scholar]
- Mikkelsen T.S., Ku M., Jaffe D.B., Issac B., Lieberman E., Giannoukos G., Alverez P., Brockman W., Kim T.-K., Koche R.P., et al. Genome-wide maps of chromatin state in pluripotent and lineage-committed cells. Nature. 2007;448:553–560. doi: 10.1038/nature06008. [DOI] [PMC free article] [PubMed] [Google Scholar]
- O'Geen H., Nicolet C.M., Blahnik K., Green R., Farnham P.J. Comparison of sample preparation methods for ChIP-chip assays. Biotechniques. 2006;41:577–580. doi: 10.2144/000112268. [DOI] [PMC free article] [PubMed] [Google Scholar]
- Oberley M.J., Inman D., Farnham P.J. E2F6 negatively regulates BRCA1 in human cancer cells without methylation of histone H3 on lysine 9. J. Biol. Chem. 2003;278:42466–42476. doi: 10.1074/jbc.M307733200. [DOI] [PubMed] [Google Scholar]
- Schlisio S., Halperin T., Vidal M., Nevins J.R. Interaction of YY1 with E2Fs, mediated by RYBP, provides a mechanism for specificity of E2F function. EMBO J. 2002;21:5775–5786. doi: 10.1093/emboj/cdf577. [DOI] [PMC free article] [PubMed] [Google Scholar]
- Slansky J.E., Farnham P.J. Introduction to the E2F family: Protein structure and gene regulation. In: Farnham P.J., editor. Transcriptional control of cell growth: The E2F gene family. Springer-Verlag; New York: 1996. pp. 1–30. [DOI] [PubMed] [Google Scholar]
- Tao Y., Kassatly R., Cress W.D., Horowitz J.M. Subunit composition determines E2F DNA- binding site specificity. Mol. Cell. Biol. 1997;17:6994–7007. doi: 10.1128/mcb.17.12.6994. [DOI] [PMC free article] [PubMed] [Google Scholar]
- Truscott M., Harada R., Vadnais C., Robert F., Nepveu A. p110 CUX1 cooperates with E2F transcription factors in the transcriptional activation of cell cycle-regulated genes. Mol. Cell. Biol. 2008;28:3127–3138. doi: 10.1128/MCB.02089-07. [DOI] [PMC free article] [PubMed] [Google Scholar]
- Weinmann A.S., Yan P.S., Oberley M.J., Huang T.H.-M., Farnham P.J. Isolating human transcription factor targets by coupling chromatin immunoprecipitation and CpG island microarray analysis. Genes & Dev. 2002;16:235–244. doi: 10.1101/gad.943102. [DOI] [PMC free article] [PubMed] [Google Scholar]
- Wells J., Boyd K.E., Fry C.J., Bartley S.M., Farnham P.J. Target gene specificity of E2F and pocket protein family members in living cells. Mol. Cell Biol. 2000;20:5797–5807. doi: 10.1128/mcb.20.16.5797-5807.2000. [DOI] [PMC free article] [PubMed] [Google Scholar]
- Wells J., Graveel C.R., Bartley S.M., Madore S.J., Farnham P.J. The identification of E2F1-specific genes. Proc. Natl. Acad. Sci. 2002;99:3890–3895. doi: 10.1073/pnas.062047499. [DOI] [PMC free article] [PubMed] [Google Scholar]
- Wells J., Yan P.S., Cechvala M., Huang T., Farnham P.J. Identification of novel pRb binding sites using CpG microarrays suggests that E2F recruits pRb to specific genomic sties during S phase. Oncogene. 2003;22:1445–1460. doi: 10.1038/sj.onc.1206264. [DOI] [PubMed] [Google Scholar]
- Wingender E., Chen X., Hehl R., Karas H., Matys V., Meinhardt T., Pruss M., Reuter I., Schacherer F. TRANSFAC: An integrated system for gene expression regulation. Nucleic Acids Res. 2000;28:316–319. doi: 10.1093/nar/28.1.316. [DOI] [PMC free article] [PubMed] [Google Scholar]
- Xu X., Bieda M., Jin V.X., Rabinovich A., Oberley M.J., Green R., Farnham P.J. A comprehensive ChIP-chip analysis of E2F1, E2F4, and E2F6 in normal and tumor cells reveals iterchangeable roles of E2F family members. Genome Res. 2007;17:1550–1561. doi: 10.1101/gr.6783507. [DOI] [PMC free article] [PubMed] [Google Scholar]