Abstract
We present a study of the adsorption of two peptides at the octane–water interface. The first peptide, Lac21, exists in mixed monomer–tetramer equilibrium in bulk solution with an appreciable monomer concentration. The second peptide, Lac28, exists as a tetramer in solution, with minimal exposed hydrophobic surface. A kinetic limitation to interfacial adsorption exists for Lac28 at moderate to high surface coverage that is not observed for Lac21. We estimate the potential energy barrier for Lac28 adsorption to be 42 kJ/mol and show that this is comparable to the expected free energy barrier for tetramer dissociation. This finding suggests that, at moderate to high surface coverage, adsorption is kinetically limited by the availability of interfacially active monomeric “domains” in the subinterfacial region. We also show how the commonly used empirical equation for protein adsorption dynamics can be used to estimate the potential energy barrier for adsorption. Such an approach is shown to be consistent with a formal description of diffusion–adsorption, provided a large potential energy barrier exists. This work demonstrates that the dynamics of interfacial adsorption depend on protein thermodynamic stability, and hence structure, in a quantifiable way.
Protein adsorption at interfaces is a ubiquitous phenomenon of importance to diverse fields ranging from food processing to biomedical science. Consequently, research in this area has been widespread over the last century and a half, since Ascherson's observation regarding the formation of proteins skins around oil droplets in 1840 (1). Fundamental understanding of the processes involved in protein adsorption is, however, still lacking. Three key questions concern the protein structure at the interface, the adsorbed layer thickness, and the dynamics of protein adsorption.
The first question is the subject of considerable research, particularly at the solid–liquid interface (2). Recent insight has been obtained from studies on peptides. Amphipathic helices adopt a preferential orientation parallel to the air–water interface (3). The α-helical content of β-casein-derived peptides increases on adsorption to a hydrophobic solid surface (4).
The second question, regarding the thickness of surface-adsorbed layers, has been addressed by using ellipsometry (5) and neutron reflectivity (6, 7). Surface pressure at the liquid–liquid interface is dictated by the first layer of irreversibly adsorbed molecules, whereas subsequent layers may bind reversibly, causing an increase in thickness with no appreciable increase in surface pressure (5).
The third question concerns the dynamics of protein adsorption and particularly how this is affected by protein structure and protein stability. Diffusion to the interface often controls the rate of protein adsorption and hence governs the interfacial tension at low surface coverage (8). At moderate to high coverage, an activation barrier to further adsorption has been observed for β-casein and lysozyme (8). The dynamic behavior in this regime is described by Eq. 1.
 |
1 |
where Π is the surface pressure (N/m), γ is the interfacial tension (N/m), k is a rate constant (1/s), and t is time (s). Subscripts ss and o denote long-term and initial values, respectively. After complete surface coverage, a further slow regime for interfacial tension decrease has been reported for lysozyme (8). The dynamics in this stage could also be described by Eq. 1 with a reduced value of the rate constant, k. It was argued that this stage results from conformational changes in the interfacial layer. Such changes were not observed for β-casein, which is a relatively unstructured protein.
Despite further studies on the dynamics of protein adsorption (9, 10), an understanding of how the adsorption process, and in particular the value of k, is affected by protein structure is completely lacking. In this work, we seek such an understanding using a model amphipathic peptide system, namely the four-chain coiled–coil based on the carboxyl-terminal oligomerization domain of the lac repressor (11). We examine two specific Lac peptides: a 21-mer peptide that exists in mixed monomer–tetramer equilibrium in bulk solution and a 28-mer peptide that exists primarily in tetrameric form even at low bulk concentration. The different behavior of these peptides during interfacial adsorption demonstrates that the value of k in Eq. 1 is controlled by the stability of peptide self association in the subinterfacial layer. Because helical protein domains will behave similarly to helical peptides, it is likely that k will be a complex but quantifiable function of protein structure.
Materials and Methods
Peptides were synthesized by using fluorenylmethoxycarbonyl solid-phase chemistry and were purified by reversed-phase chromatography by D. S. King (Howard Hughes Medical Foundation, University of California, Berkeley, CA). The 21-mer and 28-mer helical peptides (Lac21 and Lac28, respectively) were as described previously (11) and were acetylated at the amino terminus and amidated at the carboxy terminus. Purified peptide fractions were lyophilized, and molecular weights were confirmed by mass spectrometry. Final preparation purity was also confirmed by mass spectrometry. Identity and concentration were confirmed by quantitative amino acid analysis (Protein Structure Laboratory, University of California, Davis, CA).
CD of the peptides was measured by using an Aviv Model 62DS Circular Dichroism Spectropolarimeter (Aviv Instruments, Lakewood, NJ) in 10 mM phosphate buffer, pH 7.4, at various peptide concentrations and path lengths (data not shown). The CD spectra showed the same behavior as a previously reported characterization of peptide thermodynamic stability (11). Briefly, Lac21 α-helix content was strongly concentration dependent, with a substantial amount of nonhelical content even at the highest concentration studied. This is consistent with findings that this peptide exists in mixed monomer–tetramer equilibrium in bulk (11). Lac28 showed high α-helix structure even at 10 μM, indicating that this form exists primarily as a tetramer in solution. The reversibility of this tetrameric association was confirmed by thermal denaturation.
Interfacial tension was determined by using a pendant drop apparatus (12) at the octane–water interface. All glassware in contact with reagents was acid washed before use; steel components were washed repeatedly with ethanol, acetone, and water. All chemicals were analytical grade. Octane was the highest grade available (Sigma) and was purified further by repeated stirring with silica that had been heated at 600 K over night. Water was MilliQ quality. Purity of the final chemicals was confirmed by monitoring the clean-surface interfacial tension for at least 12 h before peptide experiments.
Results and Discussion
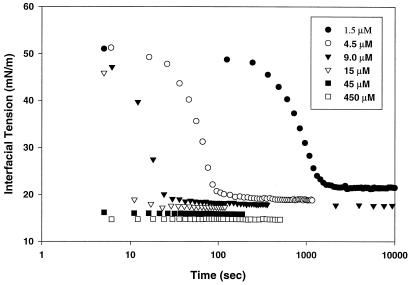
Fig. 1 shows the dynamic interfacial tension response for Lac21 amphipathic peptide adsorbing to an octane–water interface. The decrease in interfacial tension (30–40 mN/m) is larger than that achieved by most proteins, including β-casein, lactoglobulin, and lysozyme (12). The rate of interfacial tension decrease was clearly concentration dependent, and a well-defined equilibrium tension was attained at long times, in contrast to the behavior of proteins (12). There was a small concentration dependence for equilibrium tension, from 16.9 mN/m at 15 μM to 14.5 mN/m at 450 μM. These equilibrium data did not fit conventional two-parameter adsorption isotherms.
Figure 1.
Interfacial tension vs. time for Lac21 peptide at various concentrations.
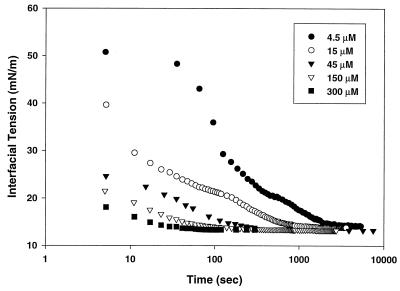
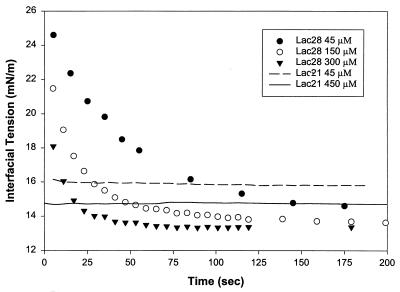
Fig. 2 shows the corresponding behavior of the Lac28 peptide. Concentrations are expressed without reference to quaternary structure (i.e., as monomer equivalents) to allow direct comparison with Lac21. The interfacial tension at moderate times was comparable to that for Lac21. However, the dynamics were characterized by a rapid decrease in interfacial tension to 20–30 mN/m, followed by a slower decrease. At moderate to high concentrations (≥45 μM), no significant delay was seen in interfacial tension reduction for Lac21, whereas Lac28 still exhibited significant time dependence. This is shown clearly in Fig. 3. Lac28 exhibited interfacial gelation at higher concentrations and long times (e.g., over night) with further small reductions in interfacial tension (typically <0.25 mN/m). Nevertheless, a reasonably well-defined steady tension could be identified before gelation onset (i.e., at moderate times). The variation in these pseudo-steady-state values with concentration was less than observed for Lac21 and ranged from 13.85 mN/m at 15 μM to 13.35 mN/m at 300 μM.
Figure 2.
Interfacial tension vs. time for Lac28 peptide at various concentrations (concentrations expressed as monomer equivalent).
Figure 3.
A comparison of the dynamic interfacial tension data for Lac21 and Lac28.
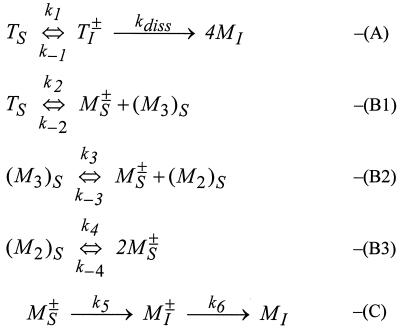
We propose that the difference in dynamic behavior may be explained with reference to Fig. 4. In reaction A, tetramer in the subinterfacial region is in equilibrium with an activated transition state (an interfacially adsorbed tetramer, TI±) that dissociates to give four interfacially adsorbed monomers (MI). We expect kdiss ≫ k−1, because the interface will constrain hydrophobic side chains less than the tetramer interior (i.e., the dissociation will be entropically driven). We also expect k1 to decrease substantially as the fractional interfacial coverage, θ, increases. Initially, the adsorption of tetramer occurs by relatively weak hydrophobic forces (e.g., alanine exposed on the exterior of the tetramer complex). As θ increases, interfacially adsorbed monomer with charged residues projected toward the aqueous phase will create an electrostatic and steric barrier to further tetramer adsorption (the tetramer has a high number of charged residues on its surface). The potential energy barrier to further tetramer adsorption will therefore increase with θ. At high surface coverage, k1 will become negligible, and reactions B and C will dominate. Reaction B represents the equilibrium in the subinterfacial region between a tetramer and its partially dissociated forms, including monomer activated for interfacial adsorption (MS±). This monomer has significant hydrophobicity and adopts an essentially random structure in the aqueous phase (11). This flexible chain will be able to orientate its hydrophobic residues toward a partially covered interface, allowing the creation of an interfacially adsorbed transition state as in reaction C. This is expected to be fast, because it involves the energetically favorable removal of hydrophobic residues from aqueous contact (as in rapid hydrophobic protein collapse). Note that we expect ki≫k−(i−1)[MS±] for reaction B in the subinterfacial region because of the removal of monomer to the interface. Once interfacially anchored, the remaining steps for full interfacial adsorption, and hence k6, will be determined by interactions between adsorbed monomers. Note that the above mechanism assumes that mass transport to the interface is not limiting the adsorption process at any stage.
Figure 4.
Proposed “reaction” mechanism for interfacial peptide adsorption. T and M denote tetramer and monomer; M2 is dimer and M3 is trimer; superscript ± denotes an activated transition state; S and I denote the subinterfacial and interfacial location, respectively.
The differences in Lac21 and Lac28 dynamic behavior may be understood now with reference to the preceding mechanism. Lac21 exists primarily as a monomer in bulk. Conversely, Lac28 exists primarily as a tetramer. Lac21 should therefore show rapid adsorption, primarily via reaction C. Conversely, we expect Lac28 to show rapid dynamics initially (via reaction A), followed by a slower phase as θ increases and k1 decreases. In this region, adsorption will be limited by the dissociation reactions, which are determined by the thermodynamic stability of the associated forms (11). This expected behavior is shown in Figs. 1–3. Specifically, Lac28 shows a rapid decrease in interfacial tension to 20–30 mN/m at high concentration (≥45 μm; reaction A) followed by a slower decrease (reactions B and C). Lac21 simply shows a rapid decrease because of the high subinterfacial MS± concentration. We now provide evidence that the activation barrier to Lac28 adsorption at moderate to high surface coverage is comparable to the free energy barrier expected for the tetramer dissociation reactions (i.e., the process is indeed limited by the production of MS±).
Before analyzing dynamic data by using the proposed mechanism, we must confirm that mass transport was not limiting the adsorption of Lac28 at higher concentrations. We first estimated the characteristic time, td, of a diffusion-controlled adsorption process assuming a linear isotherm (13),
 |
2 |
where D is the peptide diffusion coefficient in bulk, estimated by using the Polson equation (14),§ C∞ is the bulk peptide concentration [expressed as mol/m3 of monomer (Lac21) or tetramer (Lac28)], and Γmax is the maximum interfacial coverage.¶ Results of this calculation for both peptides are provided in Table 1. It appears that adsorption may be diffusion limited at low concentrations (≤15 μM). However, the adsorption of Lac28 is considerably slower than would be expected under diffusion control, particularly at concentrations above 45 μM. At the highest concentrations, diffusion times are negligible compared with the observed time constant for Lac28. To confirm further kinetic limitation for Lac28, we estimated the diffusion coefficient from the gradient of a γ vs. t−1/2 curve in the limit of t→∞ (17). The analysis yielded apparent diffusion coefficients that varied between 10−13 and 10−15 m2/s, depending systematically on concentration (data not shown). These estimates are three orders of magnitude below the estimate of 1.2 × 10⁻¹⁰ m2/s from the Polson equation (14). We conclude that the adsorption of Lac28 peptide at moderate to high surface coverage (Π > 20 mN/m) is not limited by diffusion, and we may consequently analyze adsorption with regard to the preceding mechanism. We return to a fuller discussion of mass transfer subsequently (see Further Discussion).
Table 1.
Characteristic diffusion time at different peptide concentrations calculated by using Eq. 2
| Peptide concentration, μM monomer | Diffusion time constant for Lac21, sec | Diffusion time constant for Lac28, sec |
|---|---|---|
| 4.5 | 146 (100) | 138 (>100) |
| 15 | 13 (10) | 12 (>100) |
| 45 | 1.5 (<5) | 1.4 (100) |
| 150 | 0.13 (<5) | 0.12 (50) |
| 300 | 0.03 (<5) | 0.03 (30) |
Approximate experimental time constants are given in parentheses for comparison.
To analyze adsorption under kinetic limitation we begin with Eq. 3, which is the usual expression for adsorption from a subinterfacial region to an interfacial monolayer under kinetic limitation.
 |
3 |
ka is an effective rate constant (m/s) for adsorption determined by the rate at which molecules strike the interface and the fraction of these molecules “activated” for adsorption (18), θ is the fractional interfacial coverage, and ΓT is the dimensional interfacial coverage (moltetramer/m2) at time t. CTS is the concentration of tetramer in the subinterfacial region; this will generally be time variant, but for very low values of ka it is reasonable to assume that the subinterfacial concentration is equal to that in the bulk (i.e., CTS = CT∞), and we now make this assumption. We also assume that Lac28 adsorption may be modeled as irreversible (ka ≫ kd). We subsequently show that both assumptions are reasonable (see Further Discussion). This gives
 |
4 |
where ΓTmax is the maximum interfacial coverage on a tetrameric basis (moltetramer/m2). An equation of state relating our experimental surface pressure data (Π, N/m) to fractional interfacial coverage is required. We assume an ideal monolayer and note that the Gibbs equation does not apply.¶ Consequently, we select a linear equation of state
 |
5 |
where γ is the interfacial tension (N/m) at time t, γθ=0 is the interfacial tension of the pure interface, and kθ is a proportionality constant. There is some justification for a linear equation of state for peptides adsorbed at the air–water interface.‖ Use of Eq. 5 gives the following solution to Eq. 4:
 |
6 |
where γ0 is the interfacial tension (N/m) at time 0 assuming that Eq. 4 describes the process for all t, and γss is the steady-state interfacial tension as t→∞. Concentrations in Eq. 6 have been converted to a monomeric basis simply to facilitate direct comparison with Lac21 data (CM∞ = 4CT∞, and ΓMmax = 4ΓTmax). Note that γ0 in Eq. 6 is the interfacial tension at time 0, assuming that Eq. 4 controls the entire adsorption process with a coverage-invariant value of ka. It is not γθ=0, the measurable interfacial tension at zero surface coverage, and hence cannot be specified a priori for Lac28 (doing so would ignore adsorption via reaction A at low surface coverage).
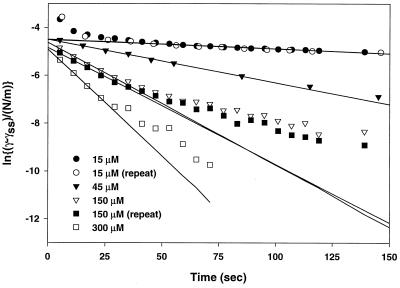
Eq. 6 is equivalent to Eq. 1 with a concentration-dependent constant k. This confirms that k in Eq. 1 is indeed a quantifiable function of protein structure, as proposed in the Introduction. γss is poorly defined for Lac28 because of gelation at long times. As noted earlier, reductions in tension at long times are small (typically <0.25 mN/m), and a well-defined steady tension could be identified before the onset of gelation (i.e., at moderate times). We therefore approximate γss with these pseudo-steady-state values. A plot of Eq. 6 is shown in Fig. 5 for Lac28 at various peptide concentrations. Repeat experiments at 15 μM and 150 μM show high reproducibility. Deviation from the regressed curve at the lowest concentration (15 μM) is probably because of diffusional limitation (see Table 1). Deviation at longer times and higher concentrations (e.g., 150 μM) is probably because of limitations in the simplifying assumptions underlying Eq. 6 in the limit of high surface coverage (e.g., gelation is not included, and a linear equation relating surface coverage and surface pressure is assumed). This is similar to protein behavior (e.g., lysozyme), where a single linear region is not seen when data are plotted according to Eq. 1 or Eq. 6 (5). This nonlinearity therefore reflects a change in the rate-controlling step, probably so that k5 or k6 in Fig. 4 become limiting. Interestingly, this gelation was not observed for Lac21, which exhibited a well-defined adsorption equilibrium.
Figure 5.
Dynamic interfacial tension data plotted according to Eqs. 1 or 6.
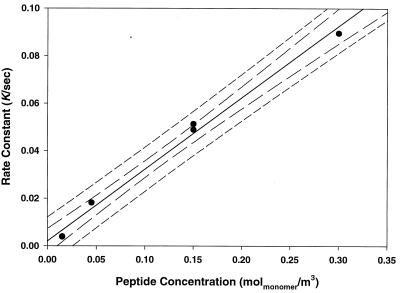
The gradient from Fig. 5 may be plotted against concentration and should, according to Eq. 6, yield a straight line through the origin. This is shown in Fig. 6. The gradient of this plot gives ka = (175 ± 8) × 10−9 m/s (R2 = 0.991). The intercept is (2.0 ± 2.1) × 10−3 1/sec confirming the line passes through the origin within statistical bounds. Note that Fig. 6 displays some nonlinearity, and in particular the regression residuals are biased. This again reflects limitations resulting from the underlying assumptions. If the highest concentration point is removed from the regression, then the bias in residuals is removed. This deletion results in a modest 10% increase in ka, but reduces the intercept by two orders of magnitude, further suggesting that Lac28 adsorption may be modeled as irreversible in this system.
Figure 6.
The rate constant k in Eq. 1 plotted as a function of bulk Lac28 peptide concentration (expressed as monomer equivalent concentration). The line is the least-squares regression using all data. The 95% confidence and prediction intervals are also shown.
Given the adsorption rate constant ka, we may estimate the activation energy ΔGa for peptide adsorption by using Eq. 7.
 |
7 |
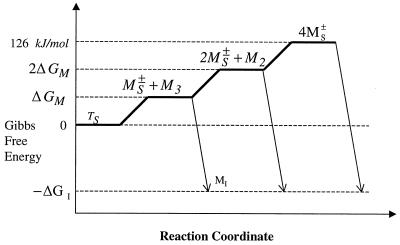
where M is the molecular weight of the adsorbing molecules (13.032 kg/moltetramer), R is the ideal gas constant (8.314 J/mol⋅K), and T is temperature (293 K). This gives a potential energy barrier for adsorption of 42 kJ/moltetramer. This will be related to the thermodynamic stability of the tetramer if adsorption is controlled by the availability of MS± in the subinterfacial region. The total thermodynamic stability of this tetramer has been estimated at approximately 126 kJ/moltetramer by fitting guanidinium chloride denaturation data by using a two-state model (11). No information is available regarding the activation barrier for removal of individual monomers from the tetramer. However, we may simplistically assume that k2, k3, and k4 are characterized by approximately the same activation energy, so that Fig. 7 describes the dissociation and adsorption reactions. We then estimate ΔGM in Fig. 7 to be 42 kJ/moltetramer (126 kJ/moltetramer for total dissociation, divided by three dissociation steps). The calculated potential energy barrier for adsorption matches this estimate precisely. It is therefore reasonable to conclude that the interfacial adsorption of Lac28 is indeed limited by the availability of free monomer in the subinterfacial region.
Figure 7.
Possible Gibbs Free Energy diagram for Lac28 dissociation and adsorption. The total tetramer stability has been previously estimated at 126 kJ/moltetramer by fitting guanidinium chloride denaturation data to a two-state (T ↔ M) model.
Further Discussion
Two assumptions in the preceding analysis are that the rate of Lac28 adsorption is far greater than the desorption rate (i.e., the process may be modeled as irreversible so that Eq. 4 applies) and that the subinterfacial concentration approximates the bulk concentration (i.e., CTS ≈ CT∞).
The applicability of an irreversible approximation for Lac28 is confirmed by examining the concentration dependence of γss (13.85 mN/m at 15 μM and 13.35 mN/m at 300 μM). If θe = 1.0 at 300 μM, then a linear state equation gives θe = 0.987 at 15 μM, where the subscript e denotes equilibrium. The variation in γss is minimal despite a 20-fold variation in concentration; the isotherm is essentially horizontal. Eq. 3 at equilibrium gives
 |
8 |
which is a restrictive relationship between the two rate constants. This value of kd corresponds to a potential energy barrier for interfacial desorption of approximately 68 kJ/molmonomer. This compares extremely well with an estimated barrier of 69 kJ/molmonomer, assuming that desorption requires the removal of six leucines and one valine (per Lac28 monomer) from octanol to water (19). Equivalent data for octane are not available, but octanol is less hydrophobic than octane, so the estimate for kd is conservatively high. At 150 μM, we therefore estimate that kaCTS(1 − θ)/ΓTmax is three orders of magnitude greater than kdθ at moderate to high surface coverage. Any desorption may therefore be safely ignored, provided the subinterfacial concentration does not approach zero.
To determine the subinterfacial concentration and hence show that CTS ≈ CT∞, we must solve the diffusion problem described by Eq. 9,
 |
9 |
 |
10 |
where Y is dimensionless concentration (CTS/CT∞), τ is dimensionless time (tDLac28/X2), and X is dimensionless distance from the subinterfacial layer (=x/λ, where x is the dimensional coordinate distance, and λ= ΓTmax/CT∞ is the selected scaling length). The following boundary and initial conditions apply.
 |
11 |
 |
12 |
Eq. 10 states that the rate of peptide “disappearance” at the subinterfacial layer equals the net rate of incorporation into the interfacial monolayer. θ(τ) is obtained from Eq. 3 expressed in dimensionless form.
 |
13 |
For ka = 175 × 10−9 m/s and kd = 6 × 10⁻⁵ 1/sec, the terms containing kd in Eqs. 10 and 13 are negligible. This will be true regardless of the precise value of ka because of the restrictive relationship between ka and kd implied by the equilibrium data (i.e., Eq. 8). Eqs. 10 and 13 can then be combined to give a simpler boundary condition at X = 0 (to replace Eq. 10).
 |
14 |
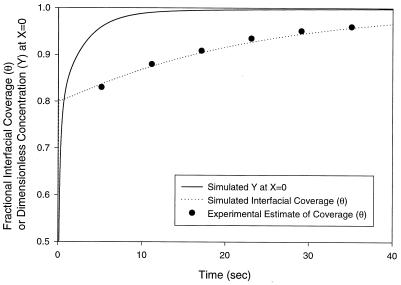
This boundary condition is implicit in Y(X = 0,τ) and must therefore be solved iteratively at each time step. Numerical solution of the preceding model gives θ(t) and CTS(t) as in Fig. 8. We assume that the kinetic limitation commences at θ(t) = 0.80 (see A Mechanism for Protein Adsorption). Before this, direct tetramer adsorption via reaction A is assumed, with a negligible potential barrier to adsorption (ka = 175 × 10−5 m/s). For θ(t) ≥ 0.80, ka is set equal to our previously determined estimate of 175 × 10−9 m/s. Experimental data are superimposed and show an excellent match to the model. Results also estimate the term containing kd in Eq. 10 to be three orders of magnitude below dY/dX at X = 0, confirming that this term can be neglected safely (i.e., adsorption may indeed be modeled as irreversible).
Figure 8.
Fractional interfacial coverage (θ) and subinterfacial tetramer concentration (Y = CTS/CT∞) vs. time for a Lac28 concentration of 150 μM (monomer equivalent). Parameter values in Eq. 14 are: for θ < 0.80, DLac28/kaλ = 0.0177 and kaCTλ2/ΓTmaxDLac28 = 56.4 corresponding to an arbitrarily large ka = 175 × 10−5 m/s; for θ ≥ 0.80, DLac28/kaλ = 177.0 and kaCT∞λ2/ΓTmaxDLac28 = 0.00564 corresponding to the estimated value of ka = 175 × 10−9 m/s.
Importantly, we note from Fig. 8 that the concentration of tetramer in the subinterfacial region (Y at X = 0) rises to 95% of the bulk value within a few seconds of the kinetic limitation commencing. This is before the first interfacial tension measurement, so the assumption that CTS = CT∞ in our analysis is justified.
This numerical approach, combined with the restriction implied by Eq. 8, could be used to directly estimate ka (and kd) by regression of experimental data. However, this approach is numerically intensive because of the implicit boundary condition that must be solved at each time step. Such an approach would seem to offer no advantage over the simplified analysis presented earlier in this paper when the system is characterized by a high value of ΔGa.
A Mechanism for Protein Adsorption
The preceding analysis and in particular the striking difference between Lac21 and Lac28 behavior confirm a two-stage mechanism for Lac28 peptide adsorption. In the first stage, at low surface coverage, peptide is able to move into the interfacial region in associated or dissociated form (i.e., as a monomer or tetramer). Once in the interfacial region, interaction with the oil phase is energetically favorable with an apparently negligible activation energy. At higher surface coverage, the movement of tetramer into the interfacial region is energetically unfavorable, presumably because of either steric or electrostatic exclusion causing a reduction in k1. Adsorption then occurs via smaller monomers that have an exposed hydrophobic region. The rate of adsorption will thus be limited by the rate of monomer appearance in the subinterfacial region. No kinetic barrier will be observed when the subsurface contains a sufficient amount of monomer. This is evident for Lac21.
This mechanism suggests the activation barrier is apparent only at reasonably high surface coverage (i.e., when interaction of the entire tetramer with the oil phase is no longer possible). This is supported by a closer examination of Eq. 6 and Fig. 5. γ0 in Eq. 6 is not the peptide-free interfacial tension, but rather the surface tension at time 0 that would have occurred had kinetic limitation (via reaction B) been controlling for all t. This will be less than the initial clean-surface tension because of the initial rapid adsorption of tetramer via reaction A. Fig. 5 gives γ0 in the range 20 to 25 mN/m, corresponding to between 70 and 80% of the total interfacial tension decrease (γθ=0 − γss), justifying our selection of θ = 0.80 for the commencement of kinetic limitation in the preceding section. This implies the kinetic limitation commences at a surface coverage equal to approximately [3/4] of the maximum possible coverage and lends support to the assertion that kinetic limitation becomes significant when adsorption requires the removal of a single monomer from a stabilized tetramer.
Graham and Philips (5, 8) used Eq. 1 to describe protein adsorption at the air–water interface and identified two distinct linear regimes. The first, at moderate to high interfacial coverage, followed any limitation at low coverage because of diffusion. Adsorption in this regime was limited by penetration into the interfacial layer. In the second regime, surface pressure increased slightly, whereas interfacial adsorption remained essentially constant. This, it was argued, was because of conformational changes. Our present study supports the proposed mechanism in the first regime. We have demonstrated that a thermodynamically stable tetramer exhibits a definite barrier to adsorption, whereas a monomer with exposed hydrophobicity does not. In this sense, our tetramer acts like a simple protein. Removal of a domain (monomer) from protein (tetramer) in the subinterfacial region into the interfacial layer is energetically unfavorable when the entire protein cannot interact as a single unit with the interface (i.e., at high interfacial coverage). The adsorption kinetics are determined by the thermodynamic stability of a specific “domain” within the native “protein.” Clearly, proteins having domains with differing thermodynamic stability will exhibit complex adsorption kinetics, as observed experimentally. This may explain why complex globular proteins such as lysozyme having numerous domains and folding intermediates exhibit adsorption dynamics that are more complex than for simply structured proteins such as β-casein. Graham and Philips (5) argued that the second regime is caused by conformational rearrangement of molecules in the interfacial region. In our system, a complex nonlinearity corresponding to this second regime was observed at long times and high concentration (e.g., 150 μM in Fig. 5). This condition corresponded to the onset of gelation, where complex interactions between adsorbed peptides will significantly affect the values of k5 and k6 in reaction C. In light of this result, further study of the gelation region for multilayer adsorption is warranted. Such a study could then be combined with our findings for moderate interfacial coverage to allow a complete description of adsorption dynamics in terms of protein structure and thermodynamic stability.
Acknowledgments
The authors thank D. S. King (Howard Hughes Medical Foundation, Berkeley CA) for providing the peptides used in the study, V. Vassiliadis and R. Conejeros (University of Cambridge, Cambridge, U.K.) for advice on numerical solution of the reaction–diffusion problem, and the Department of Energy for support under Grant no. DE-FG03–94ER14456. A.P.J.M. thanks the Australian–American Fulbright Commission (Australia), the Department of Industry, Science and Tourism (Australia), and the University of Adelaide (Australia) for financial support of this work.
Footnotes
Article published online before print: Proc. Natl. Acad. Sci. USA, 10.1073/pnas.080042597.
Article and publication date are at www.pnas.org/cgi/doi/10.1073/pnas.080042597
The Polson equation (14), D = 2.85 × 10⁻⁵ M−1/3 cm2/s, where M is the molecular weight of the diffusing peptide (2,417 g/mol for Lac21 and 13,032 g/mol for Lac28) gives DLac21 = 2.1 × 10⁻¹⁰ m2/s and DLac28 = 1.2 × 10⁻¹⁰ m2/s.
A hydrophobic residue has a volume of approximately 170 Å3 (15), giving a projected equivalent spherical cross section of 35 Å2. Helical peptide adsorbed at a hydrophobic interface adopts a helical conformation (3, 4) presenting two residues of every heptad repeat to the hydrophobic phase. It is assumed that the helical Lac21 and Lac28 peptides will behave similarly, giving six and eight residues per molecule of Lac21 and Lac28 in contact with the oil phase, respectively. This gives a projected cross-sectional area of approximately 210 Å2 for Lac21 and 280 Å2 for a monomer of Lac28, corresponding to monolayer surface coverages (Γmax) of 790 × 10−9 molmonomer/m2 for Lac21 and 580 × 10−9 molmonomer/m2, or 145 × 10−9 moltetramer/m2 for Lac28. The use of 35 Å2 per residue is also supported by monolayer compression studies for poly-dl-phenylalanine at the oil–water interface, which showed an increase in surface pressure when monolayer compression exceeds 30–40 Å2 per residue (16). Additionally, the above surface coverages equate to 2 mg/m2 on a mass basis, which matches the surface coverage for β-casein-derived peptides almost precisely (4). Finally, application of the Gibbs equation to equilibrium data for Lac21 at the lowest concentrations examined gave a surface coverage of approximately 690 × 10−9 molmonomer/m2, consistent with the preceding calculations. Note that the Gibbs equation was inapplicable at higher bulk concentrations, because a plot of interfacial tension vs. ln(peptide concentration) was concave upward, implying that lower peptide concentrations give a higher Γ.
Studies on amphipathic helices at the air–water interface by Boncheva and Vogel (3) suggest that a two-dimensional van der Waals state equation is appropriate at low surface coverage (Π < 10 mN/m). They concluded that electrostatic repulsion plays an important role at low surface pressure. However, the van der Waals equation of state becomes less accurate at higher interfacial coverage, and the experimental data suggest an almost linear relation between interfacial coverage and surface pressure in the limit of high coverage (20 < Π < 30 mN/m). The use of a highly parameterized state equation is therefore unjustified in the limit of high interfacial coverage for the current study.
References
- 1.Ascherson F M. Archiv für Anatomie und Physiologie. 1840. 44–68. [Google Scholar]
- 2.Claesson P M, Blomberg E, Fröberg J C, Nylander T, Arnebrant T. Adv Coll Int Sci. 1995;57:161–227. [Google Scholar]
- 3.Boncheva M, Vogel H. Biophys J. 1997;73:1056–1072. doi: 10.1016/S0006-3495(97)78138-4. [DOI] [PMC free article] [PubMed] [Google Scholar]
- 4.Caessens P W J R, De Jongh H H J, Norde W, Gruppen H. Biochim Biophys Acta. 1999;1430:73–83. doi: 10.1016/s0167-4838(98)00274-x. [DOI] [PubMed] [Google Scholar]
- 5.Graham D E, Phillips M C. J Colloid Interface Sci. 1979;70:415–426. [Google Scholar]
- 6.Atkinson P J, Dickinson E, Horne D S, Leermakers F A M, Richardson R M. Ber Bunsenges Phys Chem. 1996;100:994–998. [Google Scholar]
- 7.Atkinson P J, Dickinson E, Horne D S, Richardson R M. J Chem Soc Faraday Trans. 1995;91:2847–2854. [Google Scholar]
- 8.Graham D E, Phillips M C. J Colloid Interface Sci. 1979;70:403–414. [Google Scholar]
- 9.MacRitchie F. Colloids Surf. 1989;41:25–34. [Google Scholar]
- 10.Dickinson E, Murray B S, Stainsby G. J Colloid Interface Sci. 1985;106:259–262. [Google Scholar]
- 11.Fairman R, Chao H-G, Mueller L, Lavoie T B, Shen L, Novotny J, Matsueda G R. Protein Sci. 1995;4:1457–1469. doi: 10.1002/pro.5560040803. [DOI] [PMC free article] [PubMed] [Google Scholar]
- 12.Beverung C J. M.S. thesis. Berkeley, CA: University of California; 1996. [Google Scholar]
- 13.Makievski A V, Fainerman V B, Miller R, Bree M, Liggieri L, Ravera F. Colloids Surf. 1997;122:269–273. [Google Scholar]
- 14.Tyn M T, Gusek T W. Biotechnol Bioeng. 1990;35:327–338. doi: 10.1002/bit.260350402. [DOI] [PubMed] [Google Scholar]
- 15.Zamyatin A A. Prog Biophys Mol Biol. 1972;24:107–123. doi: 10.1016/0079-6107(72)90005-3. [DOI] [PubMed] [Google Scholar]
- 16.Adamson A W. Physical Chemistry of Surfaces. 3rd Ed. New York: Wiley; 1976. [Google Scholar]
- 17.Ward A F H, Tordai L. J Chem Phys. 1946;14:453–461. [Google Scholar]
- 18.Ravera F, Liggieri L, Steinchen A. J Colloid Interface Sci. 1993;156:109–116. [Google Scholar]
- 19.Fersht A. Structure and Mechanism in Protein Science: A Guide to Enzyme Catalysis and Protein Folding. New York: Freeman; 1999. p. 337. [Google Scholar]


