

Abstract
Exhaled breath condensate (EBC) collection is a simple and non-invasive method to sample airway secretions, but analysis is limited by extensive and variable dilution of airway secretions within the condensate. To overcome this limitation, we developed a sensitive and specific liquid chromatography/tandem mass spectrometry (LC/MS/MS) method to simultaneously detect adenyl purines as biomarkers of inflammation and urea as a dilution marker in EBC. Separation prior to mass spectrometry was achieved using a C18 column with methanol and formic acid as the mobile phase, and characteristic precursor to product ion transitions of m/z 268 to 136 (for adenosine), m/z 348 to 136 (for AMP), and m/z 61 to 44 (for urea) were monitored for quantification. To correct for matrix effects, isotopically labeled adenosine, AMP, and urea were used as internal standards. Using these methods, we detected urea and the adenyl purines adenosine and AMP in EBC from seven subjects with cystic fibrosis (CF) and seven healthy controls and found that the AMP/urea ratio was elevated in the CF samples. These results demonstrate that mass spectrometry can be used successfully in EBC analysis to simultaneously detect a biomarker for airway inflammation and control for variable dilution.
Respiratory diseases such as asthma and cystic fibrosis are among the leading causes of morbidity and mortality in children, and are characterized by chronic airway inflammation that can lead to progressive lung injury.1,2 Simple methods to identify and track this inflammation would greatly benefit both clinical management and the evaluation of novel therapies.
Exhaled breath condensate (EBC) collection has emerged as a promising means to collect and measure biomarkers of airways diseases, particularly in children. However, while EBC collection represents a simple and non-invasive method to obtain airway secretions, analysis of EBC constituents is complicated by the small and variable fraction of airway secretions present within the condensate.3 While studies have documented that dilution of non-volatile substances in EBC varies widely both between subjects and within a single subject over time,4 few studies have attempted to control for this dilution when measuring biomarkers of disease. The variability of dilution may account for the large discrepancies in reported levels of biomarkers in EBC.5
Mass spectrometry (MS) offers an ideal method to analyze EBC, since the capacity to simultaneously and sensitively detect multiple ions offers the potential to measure both a biomarker and a dilution marker at the low concentrations found in EBC. The aim of this study was to establish a MS method for the simultaneous quantitation of purines and urea in EBC. Purines are established biomarkers of airway inflammation in respiratory disease,6 while urea is well recognized as a marker of dilution in EBC.4,7 This study demonstrates the utility of MS in EBC analysis, with the potential to develop a simple and non-invasive method to analyze airway inflammation in clinical settings.
Experimental
Chemicals
Adeonsine, AMP, and ATP were purchased from Sigma-Aldrich (St. Louis, MO, USA). [13C10,15N5]Adenosine and [15N5]AMP were purchased from Spectra Stable Isotopes (Columbia, MD, USA). [13C]Urea was purchased from CalBiochem (EMD Chemicals, Inc., San Diego, CA, USA).
Subjects
Subjects were recruited during regular clinic visits to the Children's Hospital of North Carolina. For EBC matrix studies, previously collected and lyophilized samples from seven children with cystic fibrosis (CF) were utilized. For the prospective study, seven healthy children and seven children with CF were recruited. Healthy children were free from any diagnosed respiratory disease and did not have current respiratory symptoms such as coughs or wheezes. All studies were approved by the institutional review board, and informed consent was obtained from all subjects.
EBC collection and sample preparation
EBC was collected using the RTube EBC collector (Respiratory Research, Inc., Charlottesville, VA, USA). The aluminum chiller was held at −10°C before use, and subjects exhaled through the collector for 7 min using tidal breathing without noseclips. Samples were recovered from the RTube per the manufacturer's recommendations, divided into 300 μL aliquots, and frozen at −80°C until analysis. For analysis, 15 μL of an internal standard solution containing 50 nM 13C,15N-labeled adenosine, 250 nM 15N-labeled AMP, and 50 μM 13C-labeled urea was added, and the EBC plus internal standard solutions were lyophilized to dryness in a Speed-vac then re-suspended in 15 μL of HPLC grade water. This step yielded an effective 20-fold increase in the concentration of the EBC constituents.
Liquid chromatography and mass spectrometry
The quantitative analysis of the purine and urea by liquid chromatography/heat-assisted electrospray ionization tandem mass spectrometry (LC/HESI-MS/MS) was performed with an ultra-performance liquid chromatography (UPLC®) system (Waters, Milford, MA, USA) coupled to a TSQ-Quantum Ultra triple quad mass analyzer (ThermoFinnigan, San Jose, CA, USA) using a HESI source. An Atlantis T3 C18 column (2.0 × 150 mm, 1.8 μm; Waters) was operated with a linear gradient of 5% methanol/0.1% formic acid, for 0.3 min, then to 80% methanol/0.1% formic acid in 4 min, at a flow rate of 250 μL/min. The retention times for the purines and urea were determined with authentic standards. The compounds of interest were detected in selected reaction monitoring (SRM) mode, monitoring the transitions: m/z 508 to 136, m/z 348 to 136, m/z 268 to 136, and m/z 61 to 44 for ATP, AMP, adenosine, and urea, respectively. The electrospray conditions were; spray voltage of 4100 V, vaporizer temperature of 200°C, sheath gas pressure 40 arbitrary units, auxiliary gas pressure 30 arbitrary units, capillary temperature of 240°C. The collision energy was 28 eV for isotopically labeled adenosine and AMP and 21 eV for all other compounds.
Statistical analysis
Statistical analyses were performed using GraphPad Prism software (GraphPad Software, San Diego, CA, USA). All results are presented and graphed as mean ± standard deviation. r2 values were determined by linear regression. Comparisons between groups were performed using the Mann-Whitney test for non-parametric data.
Results and Discussion
To facilitate analysis of EBC, optimum detection conditions for purines and urea were determined. First, the ion transitions were optimized for adenosine, AMP, ATP, and urea using the Xcalibur compound optimization software (Thermo Scientific, San Jose, CA, USA). The positive and negative ion modes were both tested for sensitivity, with the positive mode yielding the highest signal-to-noise ratio. In positive ion mode, the dominant precursor (the protonated molecules) and product ion transitions were as follows: adenosine m/z 268 to 136, AMP m/z 348 to 136, ATP m/z 508 to 136, and urea m/z 61 to 44. For the purines, the product ion m/z of 136 represented the singly protonated purine base. In all cases, the observed transitions matched previously described values.8,9 In addition, the precursor to product ion transitions were also determined for isotopically labeled adenosine, AMP, and urea used as internal standard. The ion transitions were as predicted: 13C10,15N5-labeled adenosine m/z 283 to 146, 15N5-labeled AMP m/z 353 to 141, and 13C-labeled urea m/z 62 to 45.
To further refine the methodology, the effect of the pH of the mobile phase was studied. Buffer solutions of varying pH (range 3–11) were prepared using 10 mM formic acid (pH 3–5) and 10 mM ammonium acetate (pH 7.4–11). The solvent flow was provided by the attached syringe pump and the sample was injected with the built-in injector. Mass spectrometer responses after loop injection of 5 μL of a standard solution containing 50 pmol of adenosine, AMP, ATP and 2500 pmol of urea were monitored using the previously determined SRM transitions. In these experiments, urea, adenosine, and AMP were readily detected with maximum peak areas between 107 and 109 counts (Fig. 1), whereas the ATP signal was comparatively weak, with maximum peak areas of less than 107 counts. The signals for urea and adenosine were relatively stable through much of the pH range but declined at pH >9. In contrast, the signals for AMP and ATP peaked between pH 7 and 9 and were lower at both highly acidic and alkaline pH. The sensitivity to pH was particularly acute for ATP, in which the signal intensity varied over nearly two orders of magnitude. Indeed, the ATP-specific signal was only modestly above background at the lowest (pH 3) and highest (pH 11) pH tested.
Figure 1.
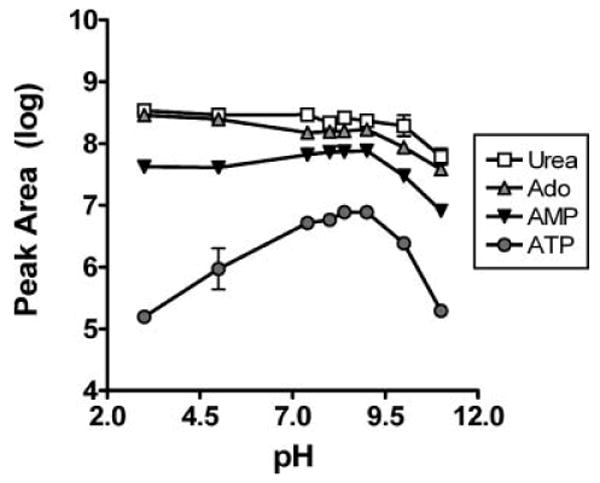
The effect of pH on purine and urea signals was determined using purine and urea standards diluted to a final concentration of 10 μM of ATP, AMP, and adenosine, and 500 μM urea in ammonium formate or ammonium acetate buffers equilibrated to various pH. A volume of 5 μL of each standard solution was injected into the mass spectrometer and the area of the resulting peak determined, with each sample measured in triplicate. Signals for all compounds were detected, but the ATP signal was weaker and more pH dependent that those from other purines or urea. All data in this figure and others are presented as mean ± standard deviation.
After optimization of solvent pH and MS detection conditions, the sensitivity and reliability of purine and urea on an LC/MS/MS system were determined. Although previous experiments suggested that the maximum signal would be obtained at a pH range of 7–9, the purines separated poorly at neutral pH. Optimum separation and signal were achieved at lower pH using a mobile phase of 0.1% formic acid (pH 2.8), at which pH the ATP-specific signal was not detected. Therefore, further efforts focused on adenosine, AMP, and urea. The retention times of adenosine, AMP, and urea were 3.2, 2.6, and 1.8 min, respectively, as established with authentic standards (Fig. 2).
Figure 2.
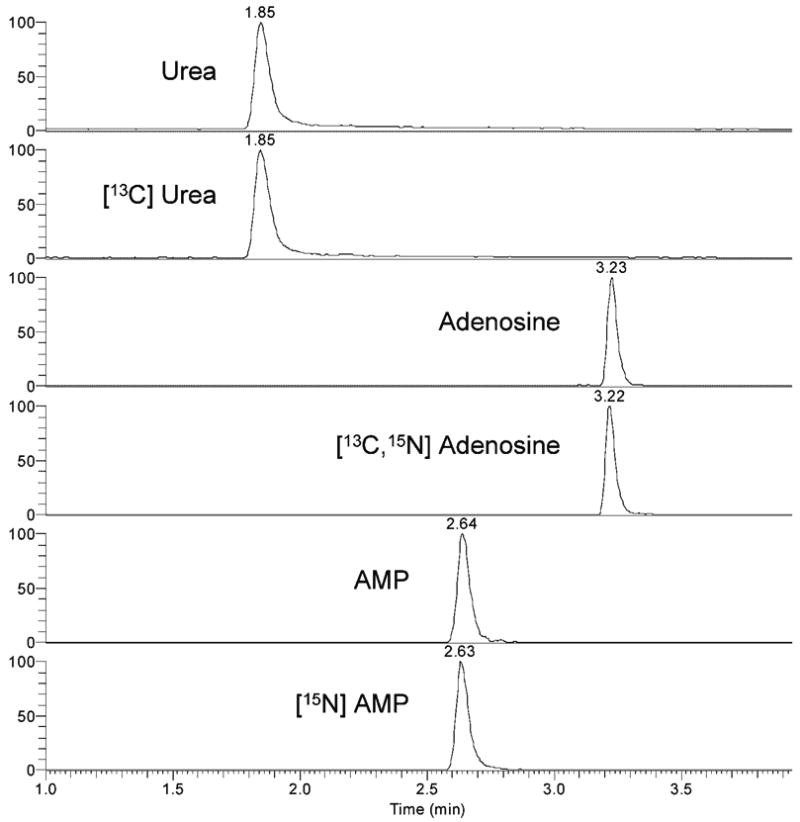
LC/MS/MS analysis of analyte and isotopically labeled internal standards of urea, adenosine, and AMP. Standards were run on a 2 × 150 mm C18 column using 0.1% formic acid and methanol gradients, and mass spectrometric detection using SRM was performed as described in the text. Retention times for urea, AMP, and adenosine were 1.8, 2.6, and 3.2 min, respectively, and were identical for analyte and isotopically labeled standards.
Instrument calibration was carried out with solutions of analyte and internal standards. Concentrations of analytes ranged from 0.1–100 nM for purines and 0.1–100 μM for urea, with constant internal standard concentrations of 50 nM labeled adenosine, 250 nM labeled AMP and 50 μM labeled urea. For each analyte concentration, 10 μL was injected onto the column and the analysis was carried out in triplicate. The limits for detection were 1 fmol for adenosine and AMP and 5 pmol for urea. The signal responses were linear over four orders of magnitude (Fig. 3). The measurements were reproducible, with coefficients of variation (CVs) <15% except at the lowest (0.1 nM) concentrations of adenosine and AMP, with CVs of 29.7% and 39.8%, respectively. Inter-day and intra-day reproducibility was assessed by analysis of solutions containing 50 nM adenosine, 50 nM AMP, and 50 μM urea using four replicates on one day and four individual replicates over four days. In both cases, the CV for each purine or urea was less than 5%.
Figure 3.
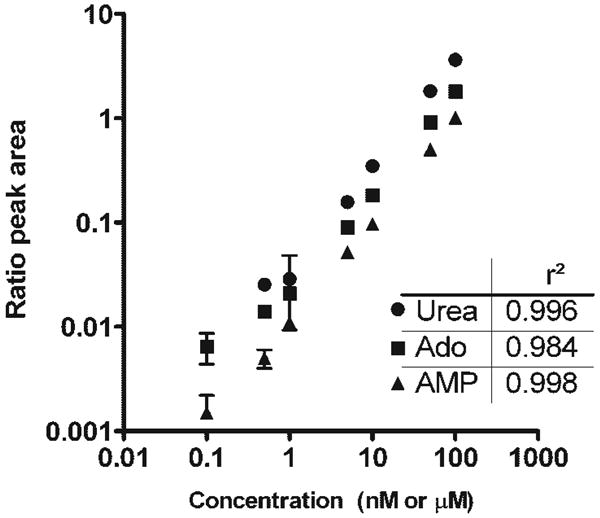
Standard curves for detection of urea, adenosine, and AMP were determined using LC/MS/MS. Detection was linear over four orders of magnitude, with r2 values as indicated. Concentrations of the injected analyte standards are given; nM for adenosine and AMP and μM for urea.
The studies were then extended to assess the reproducibility of purine and urea measurements in an EBC matrix. Seven previously lyophilized EBC samples were re-suspended in water containing isotopically labeled adenosine, AMP, and urea. Each sample was measured in duplicate, and the area ratios of analyte to internal standard were determined. Adenosine, AMP, and urea were detected in all samples, although the AMP signal was below the limit for quantification in two of the samples. Intra-class correlation coefficients between the duplicate measures of adenosine, AMP, and urea were 0.96, 0.90, and 1.0, respectively, demonstrating excellent reproducibility.
To determine the potential of this method to detect lower airways inflammation in a clinical population, EBC samples were analyzed from seven healthy children and seven children with CF, a disease associated with chronic airway inflammation. The two groups were similar in age (control 10.4 ± 3.0 years, CF 11.9 ± 4.0 years), though there were more males in the CF group (control 4 female/3 male, CF 1 female/6 males). Lung disease was overall relatively mild in the CF group, with average lung function values of 94 ± 20% predicted FEV1 (forced expiratory volume at one second).
For accurate quantification of purines and urea in EBC, stable isotope labeled internal standards were added to a 300 μL aliquot of each condensate, and the fluid was lyophilized to dryness under vacuum centrifugation and re-suspended in 15 μL of HPLC grade water prior to analysis by LC/MS/MS. Adenosine, AMP, and urea were detectable in all EBC samples (Fig. 4(A)). Measured levels of purines and urea ranged widely, consistent with the known variable dilution of airway secretions within EBC. Using purine to urea ratios to control for dilution, the AMP/urea ratio was found to be elevated in CF EBC samples relative to control (Fig. 4(B)). It should be noted that one control sample appeared to be an outlier with a highly elevated urea level, but this sample had an AMP/urea ratio of 0.03, similar to those of other samples (range 0.08–0.26). This similarity suggested that the ratios effectively controlled for wide variations in dilution; furthermore, removal of this sample did not alter the statistical significance of the difference between CF and control (p=0.026 excluding the outlier). Interestingly, of the three CF subjects with AMP/urea levels higher than average, two were currently receiving treatment for a CF pulmonary exacerbation, known to be associated with higher levels of airway inflammation.10 None of the other subjects were experiencing an exacerbation at the time of the sample collection.
Figure 4.
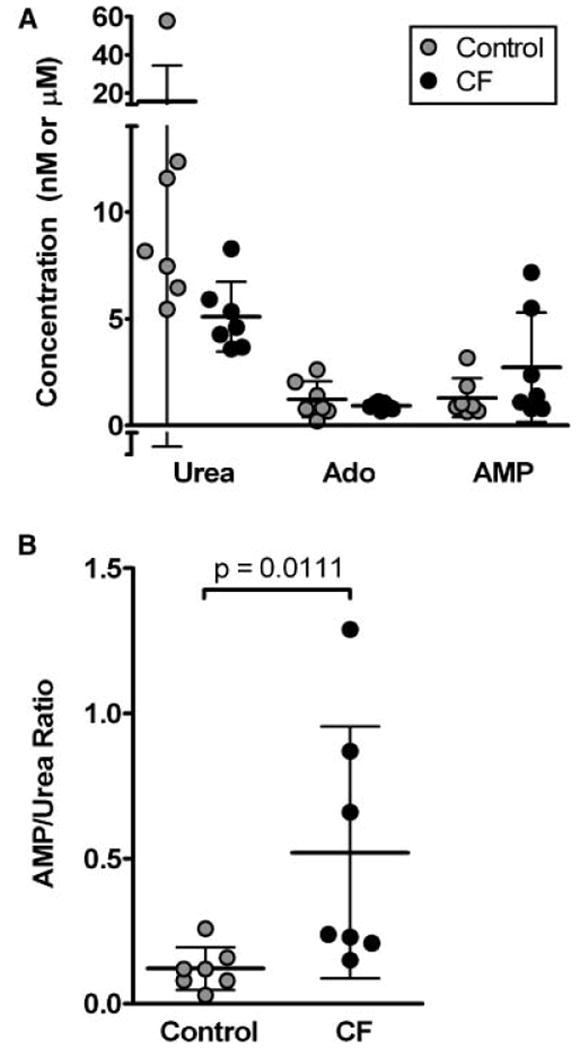
Concentrations of urea, adenosine, and AMP were measured in EBC from three healthy controls and seven children with CF. (A) Urea, adenosine, and AMP levels were not different between groups, although values for urea in particular were variable. Note that the measured values are after lyophilization and reconstitution, and are 20-fold higher than in native EBC. (B) Using purine to urea ratios to control for dilution revealed higher AMP/urea levels in CF than in control, consistent with expectations.
These results suggest that LC/MS/MS can be an accurate method for the detection of purines and urea at the levels found in EBC. In particular, the ability to simultaneously measure both a biomarker (purines) and a dilution marker (urea) represents an important advance in the analysis of EBC by controlling for the variable dilution of airway secretions known to occur within the condensate.4 Use of MS provides a significant advantage over other techniques used to assess EBC dilution, since the entire EBC sample can be used for both biomarker and dilution marker measurements. This is particularly valuable in the analysis of the relatively small EBC volumes that can be obtained from children. In addition, this MS-based method can potentially be expanded to simultaneously monitor additional biomarkers as they are identified, while retaining the ability to control for dilution using urea.
Previous studies have suggested that purines are elevated in airway inflammation, and the elevated AMP/urea ratios detected in CF samples are consistent with this hypothesis. Our data suggest that this ratio could be used to detect CF airways inflammation, although this result must be viewed with caution in light of the small sample size. This method could theoretically also be used in the study of asthma, since elevated airway adenosine levels have been reported in this disease.6 Our data also confirm the necessity of measuring a dilution marker in EBC analysis, since dilution (as assessed by urea measurements) varied widely in our samples and masked what were otherwise significant differences between groups.
Conclusions
We have demonstrated that LC/MS/MS can be used to simultaneously measure purine biomarkers and a dilution marker in EBC. Although further validation is needed, this methodology could be applied to create a simple and non-invasive method to quantify airway inflammation in human subjects.
Acknowledgments
This research was supported by the Program for Translational Science at UNC and a grant from the National Institute of Environmental Health Sciences (P30ES10126). HMJ was supported by the Holderness Fellowship Program.
References
- 1.Larsen GL, Holt PG. Am J Respir Crit Care Med. 2000;162:S2. doi: 10.1164/ajrccm.162.supplement_1.maic-1. [DOI] [PubMed] [Google Scholar]
- 2.Boucher RC. Eur Respir J. 2004;23:146. doi: 10.1183/09031936.03.00057003. [DOI] [PubMed] [Google Scholar]
- 3.Effros RM, Dunning MB, 3rd, Biller J, Shaker R. Am J Physiol Lung Cell Mol Physiol. 2004;287:L1073. doi: 10.1152/ajplung.00069.2004. [DOI] [PubMed] [Google Scholar]
- 4.Effros RM, Biller J, Foss B, Hoagland K, Dunning MB, Castillo D, Bosbous M, Sun F, Shaker R. Am J Respir Crit Care Med. 2003;168:1500. doi: 10.1164/rccm.200307-920OC. [DOI] [PubMed] [Google Scholar]
- 5.Rahman I, Biswas SK. Redox Rep. 2004;9:125. doi: 10.1179/135100004225005219. [DOI] [PubMed] [Google Scholar]
- 6.Huszar E, Vass G, Vizi E, Csoma Z, Barat E, Molnar Vilagos G, Herjavecz I, Horvath I. Eur Respir J. 2002;20:1393. doi: 10.1183/09031936.02.00005002. [DOI] [PubMed] [Google Scholar]
- 7.Effros RM, Peterson B, Casaburi R, Su J, Dunning M, Torday J, Biller J, Shaker R. J Appl Physiol. 2005;99:1286. doi: 10.1152/japplphysiol.00362.2005. [DOI] [PubMed] [Google Scholar]
- 8.Tanigawa T, Mizo-oku Y, Moriguchi K, Suzuki T, Osumi T, Odomi M. J Chromatogr B Biomed Appl. 1996;683:135. doi: 10.1016/0378-4347(96)00115-6. [DOI] [PubMed] [Google Scholar]
- 9.Esmans EL, Broes D, Hoes I, Lemiere F, Vanhoutte K. J Chromatogr A. 1998;794:109. [Google Scholar]
- 10.Ordonez CL, Henig NR, Mayer-Hamblett N, Accurso FJ, Burns JL, Chmiel JF, Daines CL, Gibson RL, McNamara S, Retsch-Bogart GZ, Zeitlin PL, Aitken ML. Am J Respir Crit Care Med. 2003;168:1471. doi: 10.1164/rccm.200306-731OC. [DOI] [PubMed] [Google Scholar]