Abstract
Arginase gene expression in the lung has been linked to asthma both in clinical studies of human patients and in the well-studied mouse model of ovalbumin-induced airway inflammation. Arginase is thought to regulate NO levels in the lung by its ability to divert arginine, the substrate for nitric oxide synthases that produce citrulline and NO, into an alternative metabolic pathway producing ornithine and urea. In the present study arginase I and arginase II concentrations were measured in isolated microdissected airway preparations from sensitized Balb/c mice exposed to ovalbumin aerosol. We found that arginase II was constitutively expressed in the airways of normal mice, whereas arginase I was undetectable in normal airways, while its expression was increased in airways of mice exposed to ovalbumin. The expression of arginase I strongly correlated with the presence of lung inflammation, as quantified by differential cell counts in lung lavage, suggesting that most, or all, of the arginase I in lungs of mice exposed to ovalbumin is present in the inflammatory cells rather than in the airway epithelium. There was also a significant correlation between increased expression of arginase I in the isolated airways and decreased lung compliance. On the other hand, while we found arginase II expression to also be significantly increased in airways from mice exposed to ovalbumin as compared with normal airways, the relative increase was much less than that observed for arginase I, suggesting that there was a smaller contribution of inflammatory cells to the arginase II content of the airways in mice exposed to ovalbumin. There was no apparent correlation between the content of arginase in isolated airways and exhaled NO concentration in the expired air from mice exposed to ovalbumin. However, there was a correlation between exhaled NO concentration from mice exposed to ovalbumin and the lymphocyte content of the lung lavage.
The concentration of arginine found in isolated airways from Balb/c mice exposed for 2 weeks to ovalbumin was about half of the value found in isolated microdissected airways from normal mice. Treatment of mice systemically with an arginase inhibitor significantly increased the amount of NO produced, as measured as the amount of nitrite + nitrate (NOx) in lung lavage supernatant prepared from mice exposed to ovalbumin. Our results are consistent with the hypothesis that the response of the lung to ovalbumin challenge includes an adaptive response in the large airways regulating the concentration of arginine within cells of the airway epithelium and subepithelial layer, by shunting of arginine into the metabolic pathway for increased synthesis of NO.
Keywords: asthma, eosinophils, nitric oxide, arginine, citrulline, airway inflammation
INTRODUCTION
The roles of nitric oxide (NO) in lung injury and repair are highly controversial. There is clinical wisdom that increased production of exhaled NO by asthmatic patients is a biomarker of disease severity; exhaled NO is presently being used as an American Thoracic Society/European Respiratory Society (ATS/ERS)-approved guideline (ATS/ERS, 2005) for assessing severity of asthma, and drugs that suppress the activity of nitric oxide synthases are in clinical trials for treatment of asthma and various other lung diseases. Lung NO may be produced from arginine by any of the three nitric oxide synthase isoforms (Vercelli, 2003). Thus, production of NO may be regulated by the amounts of nitric oxide synthase (NOS) enzyme available, and by the availability of the substrate for NOS, L-arginine. Arginine levels in lung are thought to be regulated by the availability of arginase I and arginase II, enzymes which convert L-arginine into L-ornithine + urea. Alternatively, L-arginine is converted by nitric oxide synthase into NO + L-citrulline.
Arginase gene expression in the lung has been linked to asthma both in clinical studies of human patients and in the well-studied mouse model of ovalbumin-induced airway inflammation. Expression of arginase is upregulated by IL-4 and Il-13 during allergic inflammation, which is believed to decrease the amount of arginine available for production of NO (Vercelli, 2003). It has been suggested that arginase contributes to the regulation of NO levels in the lung by its ability to catalyze the diversion of arginine, the substrate for nitric oxide synthases, into an alternative pathway producing ornithine (King et al., 2004; Ricciardolo, 2003). There is a potential for competition between these two enzymes for available arginine, and the interplay between these two pathways is thought to be rate limiting for the generation of NO (Meurs et al., 2003).
In a seminal study, Zimmerman et al. (2003) reported that lung tissue from Balb/c mice undergoing allergen (either ovalbumin or A. fumigatis)-induced experimental asthma expressed higher levels of arginase I and II mRNAs, as evaluated by gene array analysis. In situ hybridization analysis and immunohistochemistry localized arginase I mRNA staining to perivascular and peribronchial inflammatory cells, especially alveolar macrophages. The relative increase in mRNA expression for arginase I between ovalbumin- and saline-treated mice was about 10-fold higher than that for arginase II in these experiments (King et al., 2004). These observations have been confirmed at the protein level by Fajardo et al (2004), who found increased arginase I (but apparently not arginase II) in the lungs of C57BL mice treated with ovalbumin. At about the same time, Morris et al. (2004) studied alterations in L-arginine metabolism in human patients with asthma. In the population studied, serum arginase activity was elevated, and plasma arginine levels decreased; the specific arginase isoform(s) involved was not reported in this study.
These considerations encouraged us to determine arginase I and arginase II content in the lungs of sensitized mice exposed to ovalbumin aerosol. We attempted to localize a specific anatomical compartment in which the arginase enzymes were expressed within the lung in this well characterized mouse model. To do this, we examined arginase I and II levels in isolated, microdissected airway preparations prepared from the lungs (predominantly conducting airways below the level of the trachea), by examining correlations between the presence of specific inflammatory cells in lung lavage fluid and expression of each of the arginase isoforms. We then tested the hypothesis that an adaptive response of the large airways includes regulation of the concentration of arginine within cells of the airway epithelium and subepithelial layer of the lung upon ovalbumin challenge. We also examined whether average airway concentrations of arginine in the mouse ovalbumin model were altered in mice undergoing allergen-induced airway inflammation. Finally, we examined the effects on arginine metabolism of inhibiting arginase in normal and asthmatic mice with an arginine transition-state analogue, Nω-hydroxy-nor-arginine (nor-NOHA).
EXPERIMENTAL METHODS
Animals
Balb/c mice, 25–30 g, 8–12 wk old males, were purchased from Charles River Laboratories. Mice were certified as chronic respiratory disease free by the supplier, and were routinely screened for health status by serology and histology by our veterinary animal resources facility. There were no paramyxoviral, or other viral pathogens, present in these animals that might themselves provoke chronic airway inflammation (Walter et al., 2002; Schwarze et al., 1997). Animals were maintained in a HEPA-filtered laminar flow cage rack with a 12-hour light/dark cycle and allowed free access to food (Purina Rodent Chow) and water. Animals were housed and cared for by the veterinary staff of Animal Resource Services at UCD in AALAC- accredited facilities, in plastic cages over autoclaved bedding in HEPA-filtered cage racks.
Exposure of mice to ovalbumin aerosol
Mice were sensitized by an intraperitoneal (ip) injection of ovalbumin (2 × 10 µg/0.1 mL, 2 weeks apart, i.e. on day 0 and day 14) consisting of a chicken egg albumin (ovalbumin, grade V, ≥98% pure, Sigma, St. Louis, MO) with alum adjuvant as described by Temelkovski et al. (1998). After sensitization, the mice were divided into two groups; OVA sensitized/OVA exposed and OVA sensitized/filtered air (FA) exposed. One to three hours after the final air or ovalbumin aerosol exposure, subsets of mice in each cohort underwent physiological studies (see below). Immediately thereafter, these mice (and all others that did not undergo assessment of lung compliance/resistance) were euthanized and their lungs were lavaged for determination of biochemical and toxicological parameters. Subgroups of mice were analyzed for physiological responses and/or determination of biochemical parameters depending on the specific experimental protocol; Actual numbers of mice analyzed in any specific procedure are indicated on the Figures shown in the Results section.
For mice in the OVA sensitized/OVA exposed group, exposures to ovalbumin aerosols were performed using chambers and generators we have described in Kenyon et al.,2003a. Exposures to ovalbumin aerosol, 10 mL of a 10 mg/ml (1%) solution, began on day 28 (i.e. 14 days after the second ip OVA injection). The mice were exposed to the aerosol three times per week for 30 minutes per exposure for the duration of two weeks (6 exposures total). Mice in the OVA sensitized/filtered air exposed group were exposed to filtered air only.
All aerosol exposures utilized a side-stream nebulizer (Invacare Corporation, Elyria, OH) and Passport Compressor (Invacare, Sanford, FL) to generate the aerosols, which have a mass concentration of 56 mg/M3 and a size (MMAD) of 1.9±0.20 um, σg 2.6±0.2 (Kenyon et al., 2003a). Aerodynamic size distributions were determined from samples collected with a Mercer-type cascade impactor. The content of chloride anion derived from saline residue in the particles was measured on each of the seven impactor stages and the after-filter by ion chromatography (Model DX-120, Dionex Corp., Sunnyvale, CA). A log-normal distribution was fitted to each sample set of data. The values reported were the mass median aerodynamic diameter (MMAD) and the geometric standard deviation (σg) of the fitted distributions. Aerosol mass concentrations were determined by analysis of the protein concentration on filter samples collected over a known time interval. We routinely tested the generators for a 30-minute exposure interval.
Lung compliance and resistance measurements
The dynamic compliance and resistance of the respiratory system was measured with a plethysmograph for restrained animals (Buxco Inc., Troy, NY) 1–3 hours after termination of the final OVA exposure. Mice were deeply anesthetized and sedated with medetomidine, 0.5 mg/kg (Domitor, Orion Pharma, Finland), and tiletamine/zolpidem, 50 mg/kg (Telazol, Fort Dodge Laboratories, Fort Dodge, IA). Mice were ventilated at 7–8 cc/kg with a mouse ventilator (MiniVent, Harvard Apparatus, Cambridge, MA) for the duration of the procedure. Compliance (Cdyn as mL/cm of H2O) and resistance (Rrs, as cm of H2O*sec/mL) measurements were made at baseline and immediately following serial 3–5 minute nebulizations of saline and methacholine (0.1–2.0 mg/ml), with 3-minute recovery periods allowed after each exposure to methacholine.
Whole lung lavage
Immediately after the collection of pulmonary function data, the mice were killed by an ip overdose of phenobarbital and dilantin following AALAC guidelines for euthanasia. Animals were placed on a restraining board, whole blood was removed by cardiac puncture and processed to isolate plasma, which was stored at −80°C, and the lungs were lavaged with a total of 2 ml of phosphate-buffered saline (pH=7.4). Lavage samples were centrifuged at 2000 rpm on a tabletop centrifuge and lavage supernatant reserved and stored at −80°C for determination of nitrate and nitrite content. The remaining cell pellet was treated with ACK/RBC lysis buffer to remove red blood cells that may have been present, recentrifuged at 2000 rpm and the remaining cell pellet resuspended in 0.5 ml PBS. The total live, lavaged cell number was determined using a hemacytometer with trypan-blue exclusion to assess cell viability.
Cell differentials were examined in cytocentrifuge preparations. A 100 µl aliquot of the processed lavage cell suspension was processed onto a positive-charged glass slide in a cytocentrifuge at 1650 rpm for 7 minutes and stained as per manufacturer’s instructions using the Protocol Hema3 Stain Set (Fisher Scientific Company, Kalamazoo, MI) consisting of a hematoxylin and eosin counterstain. Cells were classified as pulmonary alveolar macrophages, polymorphonuclear leukocytes (neutrophils), lymphocytes, eosinophils, or “other” based upon staining color and characteristic morphology.
Measurement of exhaled NO and of nitrate/nitrite in lung lavage supernatant
Prior to the methacholine dose-response challenge, a five-minute sample of exhaled gases was collected from the exhalation port of the ventilator (immediately after insertion of a mouse into the plethysmograph) to determine baseline exhaled NO concentration. Samples were collected into a specially constructed Tyvek bag from the cannulated mice. This 5-minute sample was adequate for the measurement of NO concentration in the expired air, using a Sievers Nitric Oxide analyzer (Sievers Inst., Boulder, CO) (Silkoff et al., 1999). Nitrate and nitrite in the previously isolated lavage samples were measured as an indicator of NO production through reduction with acidified vanadium III using the Sievers NO Analyzer (Sievers, Boulder, CO).
Western blot analysis of arginase content in the conducting airway compartment
Mouse lungs that had been previously lavaged were excised and the left lobe was isolated at the carina and washed in ice-cold PBS. Right lungs were stored frozen or fixed in paraformaldehyde and not used for further studies reported in this paper. Isolated airways from the left lung lobe were prepared by blunt dissection, obtaining a preparation of the larger conducting airways consisting of the carina through the third generations of conducting airway, separate from adherent parenchyma and vasculature. Isolated airways were then sonicated in a homogenization buffer consisting 0.1% SDS, protease inhibitor cocktail (Sigma-Aldrich, MO) diluted as per manufacturer’s recommendation and 0.1 mg/ml phenylmethanesulfonyl fluoride (PMSF) in PBS. Homegenates were centrifuged at 10,000 rpm for 20 minutes. Supernatant total protein concentrations of individual samples were determined by MicroBCA Protein Assay Kit (Pierce Rockford, IL). Aliquots of 15 ug of total protein were removed, mixed with 4x SDS electrophoresis sample buffer, and then heated to 65°C for 15 minutes. Proteins present were then separated by SDS gel electrophoresis under reducing conditions using a 10% Bis-Tris Polyacrylamide gel (Bio-Rad Laboratories, Hercules, CA) in MES running buffer (Invitrogen Corp, Grand Island, NY) and then transferred to a PVDF membrane using an electroblotting apparatus. Membranes were blocked with 5% non-fat powdered milk in phosphate-buffered saline (PBS) for 60 minutes at room temperature. The membranes were then incubated with the primary antibodies (i.e. arginase I and II goat anti-rabbit primary antibodies from Santa Cruz Biotechnologies, Santa Cruz, CA; 1:200 dilution for both antibodies in 5% non-fat powdered milk in PBS) for 1 hour at room temperature. The membranes were then washed 6 times (5 min each with 0.05% Tween 20 in PBS [PBST]) and incubated with a horseradish peroxidase (HRP)-conjugated anti-goat secondary antibody (1:10,000) for 1 hour at room temperature. After 6 washes with PBST, the membranes were incubated with Immobilon Western Chemiluminescent HRP Substrate reagent (Millipore, Billerica, Massachusetts) for 1 minute. Chemiluminescence was measured by exposing the membranes to X-ray film and digitizing the resulting images after development of the film using a high-resolution flat bed scanner. Band densitometry analysis was performed using Kodak 1D software (Eastman Kodak, Rochester, NY).
Measurement of L-arginine and L-arginine metabolites in the conducting airway compartment
Aliquots of the supernatant derived from isolated, microdissected airway homogenates (each containing 50 µg of total protein) were deproteinized using acetone (4:1 [vol/vol] acetone: tissue supernatant). The resulting supernatant was removed and evaporated to dryness using a vacuum centrifuge. The samples were then analyzed for basic amino acid and polyamines by reverse-phase HPLC after pre-column derivatization with phenylisothiocyanate (PITC) (Sarwar and Botting, 1990) or dansyl chloride (Minocha and Long, 2004), respectively.
Inhibition of arginase activity
Thirty-two Balb/C mice of matching age and weight were sensitized to ovalbumin by ip injection as described above and divided into four groups of eight mice: PBS injected/filtered air-exposed, PBS injected/ovalbumin-exposed, Nω-hydroxy-nor-L-arginine (nor-NOHA) injected/filtered air-exposed, nor-NOHA injected/ovalbumin-exposed. In these studies, where the mice were then to be exposed (following the regimen above) to either filtered air or aerosolized ovalbumin, cohorts were administered either 100 ug of nor-NOHA/0.1ml PBS or 0.1 ml of PBS alone via ip injection 30 minutes prior to each challenge (ovalbumin aerosol or filtered air). All subsequent processing of mice in this experimental group after the final aerosol or filtered air challenge was the same as described above.
Statistical analysis of data
Results are presented as mean values±SEM. Means were compared by Student’s t-test or ANOVA, with Tukey’s correction for multiple comparisons applied where appropriate, using the Prism 4 software package (Graphpad, Inc., San Diego, CA). A P value of 0.05 or less was taken to indicate significance. Linear regression analysis data was derived from measurements from individual animals. Analysis of global data for correlation was by multiple regression analysis, again using the data from individual animals, with R, a common open-source statistical computing package (URL: http://www.R-project.org). We applied an appropriate Bonferroni correction to all of the data used for multiple comparisons in the constructed statistical models.
RESULTS
Characterization of ovalbumin sensitization model
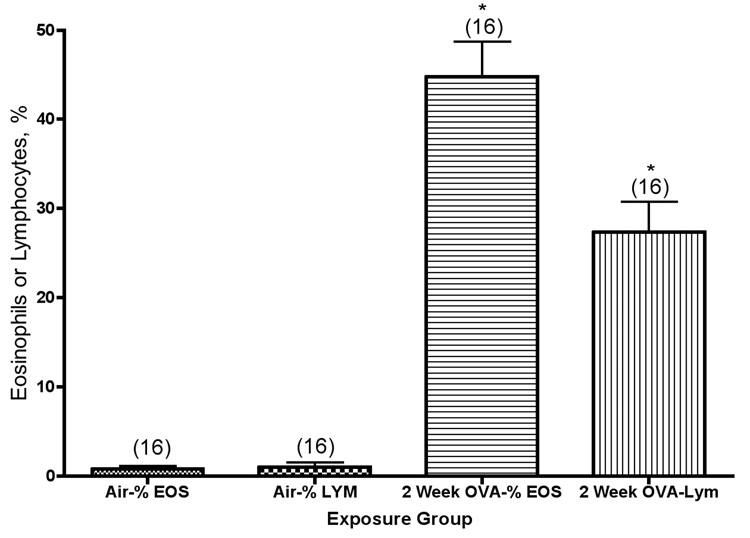
To ensure that mice were sensitized to ovalbumin after the ip sensitization protocol, we took blood samples from mice that had been exposed to ovalbumin aerosol for 2 weeks and measured plasma IgE concentration by ELISA. We found 0.048±0.005 ng/ml of IgE in normal controls, and 0.140±0.02 ng/ml of IgE in sensitized mice. Previously reported histological evaluations of exposed and control mice (Kenyon et al., 2003a) demonstrated that we induced airway inflammation, epithelial cell sloughing, and goblet cell hyperplasia in the similarly exposed mice. Balb/c mice were exposed to ovalbumin aerosol for 2 weeks (a total of 6 exposures), and their inflammatory response was quantified as the percentage of eosinophils, lymphoctes, or eosinophils + lymphocytes in their lung lavage fluid. Matched air control mice contained 98–99% alveolar macrophages in their lung lavage, with no detectable eosinophils or lymphocytes. As shown in Figure 1, there were significant increases in eosinophil and lymphocyte content in the lungs of mice after exposure to ovalbumin. The absolute number of macrophages present in the lung lavage fluid from mice exposed to ovalbumin is about the same as the number present in the air controls (Kenyon et al., 2003). The relative content of eosinophils and lymphocytes was significantly higher in exposed mice than in controls (P<0.001). Previous studies have shown persistence of inflammation, primarily elevated numbers of lymphocytes, for at least 10 weeks of exposure in this model (Kenyon et al., 2005).
Figure 1.
Eosinophil (Eos) and lymphocyte (Lym) percentages in the lung lavage fluid from Balb/c mice exposed to ovalbumin aerosol for 2 weeks. *, significantly higher than the corresponding air group (P<0.001). The values shown on the graph are group mean percentage of total cells ± SE, with experimental group size, N, represented as a bracketed number above the bar.
Exhaled NO and inflammation
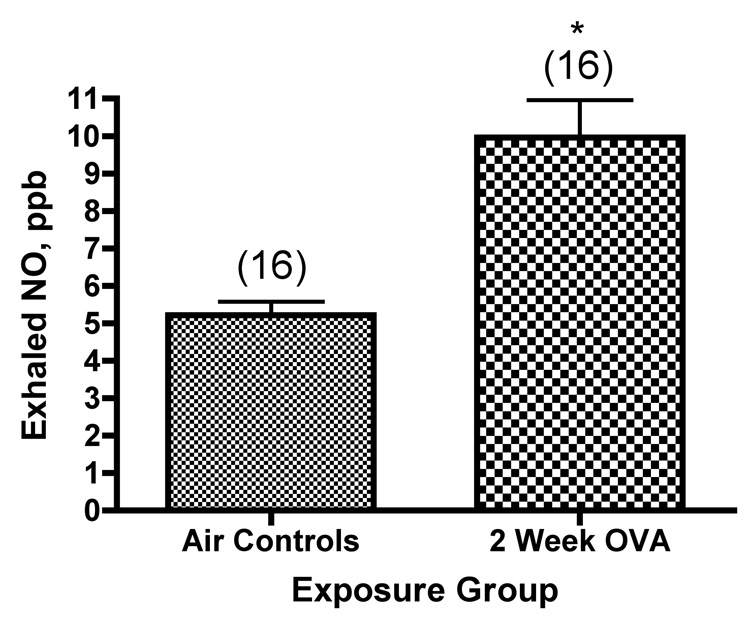
We also examined whether there was an increase in the concentration of exhaled NO when we compared exposed mice with matched controls exposed only to filtered air. There was significantly higher exhaled NO in the exposed mice (Figure 2). To ask whether there was a relationship between exhaled NO and specific inflammatory cells in the lung lavage, we built linear models to test for the effects of lymphocytes or eosinophils on observed concentrations of expired NO in the mice. Eosinophils had no significant effect, and were therefore dropped from the model. The final model was:
Figure 2.
Exhaled NO (ppb) from mice exposed to ovalbumin. *, significantly greater than air controls (P<0.0001). The values shown on the graph are group mean concentration of exhaled NO ± SE, with experimental group size, N, represented as a bracketed number above the bar.
This model was highly significant, having a p value of 0.000063, assuming a normal distribution of the data. The p value for the specific coefficient describing the effect of lymphocytes was 0.034 making the same assumptions. These p values are probably underestimated (see discussion); any underestimation of the true p values would not change our conclusions. This model allowed for a different slope and intercept for each experiment, allowing us to control statistically for inter-experimental variables introduced by using data pooled from multiple individual experiments. The size of the effect varied greatly between different experiments, but in all experiments with a significant effect, the effect was positive. Thus, we conclude that there is a significant statistical correlation between the number of lymphocytes in the lung lavage fluid from mice exposed 6 times over 2 weeks to ovalbumin aerosol and the concentration of exhaled NO in the breath of these mice. We can not draw any conclusions as yet about whether this is a direct or an indirect effect since correlations do not establish causality, and further experiments will be necessary to definitively assign the exact cell source(s) of NO in the Balb/c mouse ovalbumin model.
Airway hyperreactivity
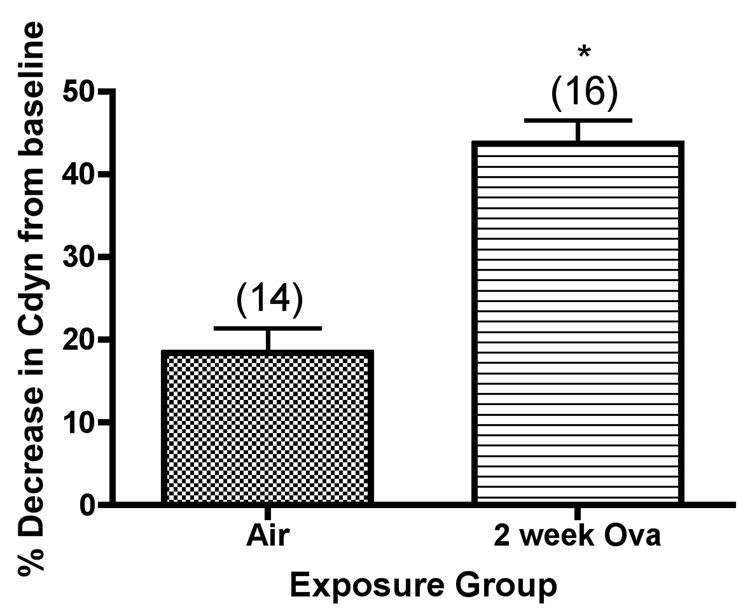
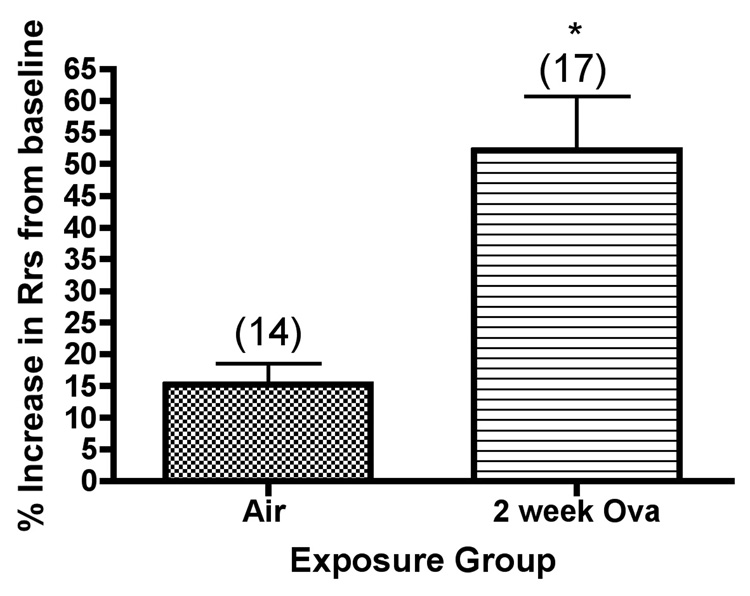
We also analyzed dynamic compliance and total resistance of the respiratory system of Balb/c mice at baseline and after bronchoprovocation testing with methacholine aerosol, as shown in Figure 3. Both baseline compliance (compliance prior to methacholine challenge) and lung compliance after challenge with the highest dose of methacholine used (2 mg/ml) were determined. Significant differences were observed in the mice exposed to ovalbumin, where both lung compliance (Figure3a) and airway reactivity (Figure 3b) values after methacholine challenge, expressed as a percentage change from the baseline values, were significantly increased as compared with the corresponding values in mice exposed to filtered air.
Figure 3.
Dynamic lung compliance (Cdyn) and lung resistance (Rrs) of Balb/c mice after bronchoprovocation testing with methacholine aerosol *, significantly greater than air controls (Rrs, P=0.0007; Cdyn,P<0.0001). The values shown on the graphs are the group mean percentage decrease in Cdyn, or the group mean percentage increase in Rrs from baseline values (without methacholine challenge) ± SE at the highest concentration of methacholine tested, with experimental group size, N, represented as a bracketed number above the bar.
Arginase I expression in airways of Balb/c mice exposed to ovalbumin
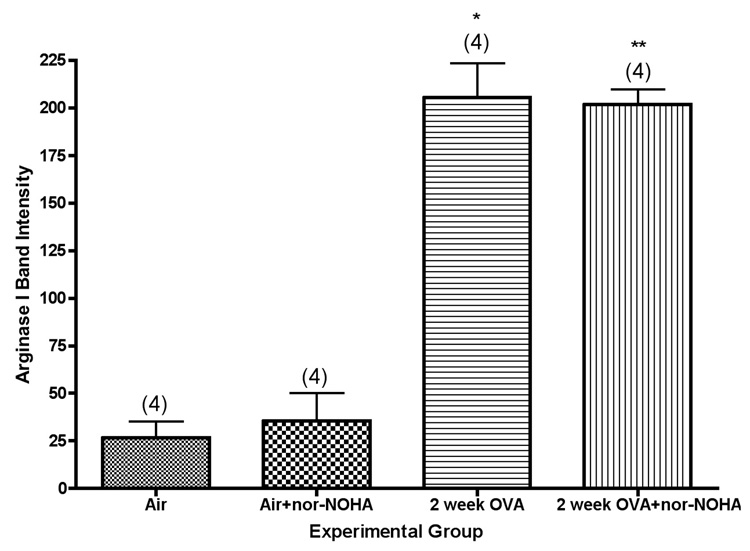
Expression of arginase I in isolated airways was quantified by western blot analysis. Arginase I protein content in the airways was relatively low in lungs from air control mice, but was significantly upregulated in lungs from mice exposed to ovalbumin (Figure 4). Actual amounts of arginase I as estimated by densitometry were about 8-fold higher in the mice exposed to ovalbumin (P<0.001).
Figure 4.
Arginase I content of isolated airways from Balb/c mice exposed for 0 or 2 weeks to ovalbumin aerosol, +/− nor-NOHA. *, significantly greater than air control (P<0.001); **, significantly greater than air + nor-NOHA control (P<0.001). Values shown on the graph are group mean intensity ± SE, with experimental group size, N, represented as a bracketed number above the bar.
Statistical analysis of interactions between the various responses we measured in mice exposed to ovalbumin was potentially confounded by the interrelationships between lung inflammation and these responses. Thus, we constructed a model containing all of the measured responses and examined each of the possible interactions individually. To ask whether there was a relationship between expression of arginase I and lung compliance, we built a linear model to estimate arginase 1 based on lung compliance. The final model was:
From this model, we conclude that increased baseline dynamic lung compliance is associated with decreased levels of Arginase 1 (P=0.0000883), with a highly significant correlation between increased NO production and increased lung compliance.
Arginase II expression in airways from BALB/c mice exposed to ovalbumin
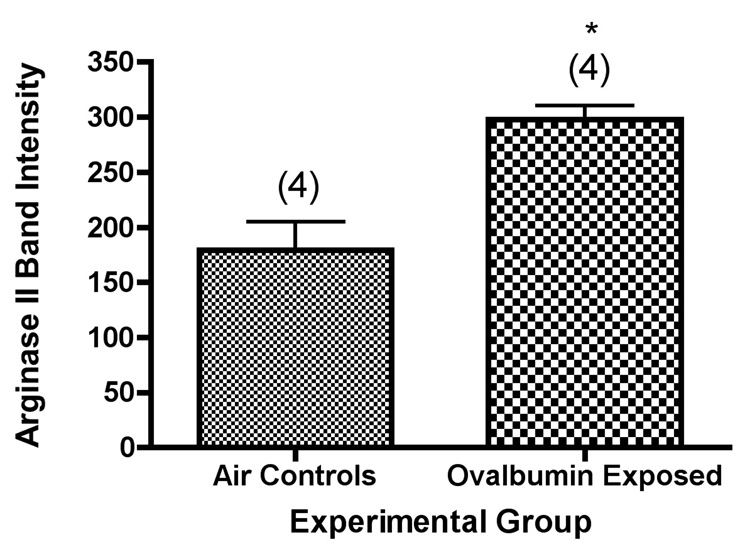
We used western blot analysis to determine the amount of arginase II in isolated airways from control mice and from mice exposed to ovalbumin aerosol over a 2 week period (6 total exposures).Arginase II expression in the airways was significantly increased in mice exposed to ovalbumin aerosol as compared with the mice breathing only filtered air (Figure 5). In these experiments, the relative increase in airway arginase II content in the mice exposed to ovalbumin was about 70%, as contrasted with arginase I, which was increased about 8-fold. Our results are consistent with expression of arginase II in both the distal and peripheral lung, including the conducting airways. We did not have enough data for arginase II levels and lung compliance in the same animals in this study to perform a statistical analysis for correlation comparable to the analysis performed with arginase I.
Figure 5.
Arginase II content of isolated airways from Balb/c mice exposed for 0 or 2 weeks to ovalbumin aerosol. *, significantly greater than air control (P=0.006). Values shown on the graph are group mean intensity ± SE, with experimental group size, N, represented as a bracketed number above the bar.
Relationship between airway content of arginase I and II and the concentration of exhaled NO
We examined whether there was any relationship between exhaled NO concentration and the amount of each of the arginase isoforms present. There appeared to be no correlation between exhaled NO concentration and either arginase I or arginase II content in the isolated airways from the Balb/c strain, as evaluated by linear regression analysis.
Arginine content of isolated airways
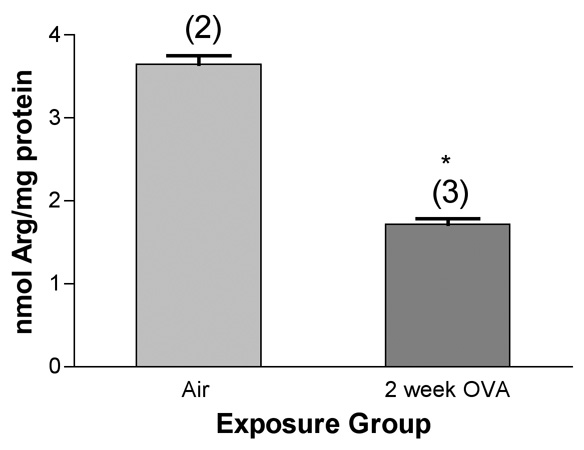
We first measured the concentration of arginine in our preparations of isolated, microdissected airways using a centralized facility doing amino acid analysis by standard techniques (Beckman 6300 analyzer: ion-exchange chromatography to separate amino acids followed by a "post-column" ninhydrin reaction). We found an average concentration of about 13 uM arginine in normal airways from the Balb/c mouse lung, with a significant decrease (from 3.6±0.1 to 1.7±0.1 nmol of arginine per mg of soluble protein) in the isolated airways from mice exposed a total of 6 times over 2 weeks to ovalbumin (Figure 6). The content of citrulline in isolated airways was beneath the limits of detection in the air controls using this method.
Figure 6.
Arginine content of isolated, microdissected airways from mice exposed to ovalbumin, as determined by ion-exchange chromatography followed by detection with ninhydrin. *, significantly less than air control (P<0.01). Values shown on the graph are group mean concentrations (nmol/mg total protein) ± SE, with experimental group size, N, represented as a bracketed number above the bar.
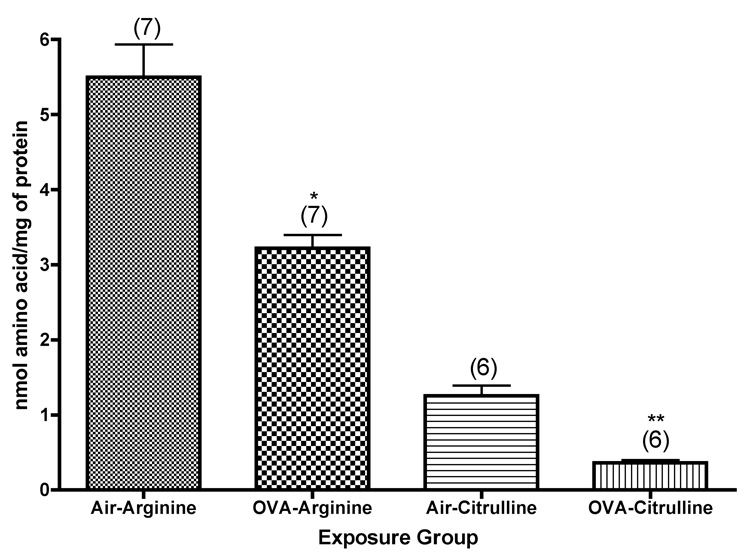
To further explore the metabolic pathways involving arginine in isolated airways from mice exposed to ovalbumin, we used reversed-phase HPLC to analyze arginine and its metabolites (after derivatization with PITC) in tissue samples. We were able to confirm the significant decrease (P=0.0004) in arginine concentration in the isolated airways from mice exposed to ovalbumin aerosol (Figure 7). In addition, we were able to determine the concentration of citrulline in these tissues. There was a significant decrease (about 71%, P<0.0001) in citrulline concentration in the airways of mice exposed to ovalbumin aerosol (Figure 7). We also found decreased concentrations of ornithine, putrescine, and agmatine in the airway preparations from these mice. On the other hand, we found increased concentrations of proline, cadaverine, and spermine, all end products of the arginase pathway, in these airways, suggesting that arginase activity was stimulated in the airways of these mice.
Figure 7.
Arginine and citrulline content of isolated, microdissected airways from mice exposed to ovalbumin, as determined by HPLC after pre-column derivatization with o-phthaldialdehyde. *, significantly less than air control (Arginine, P=0.0004; Citrulline, P<0.0001). Values shown on the graph are group mean concentrations (nmol/mg total protein) ± SE, with experimental group size, N, represented as a bracketed number above the bar.
Effects of treatment of mice with an arginase inhibitor
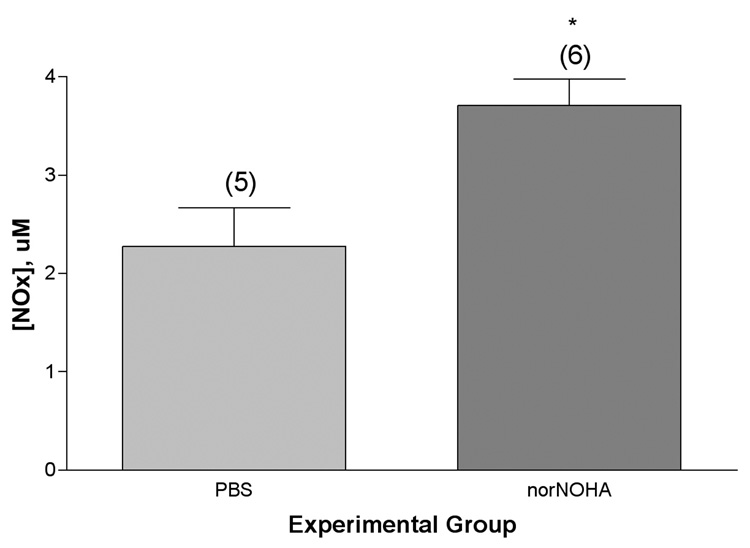
We treated mice systemically with N(omega)-hydroxy-nor-L-arginine (nor-NOHA), a competitive inhibitor of both arginase isoforms (Ki ~ 0.5 uM). Our working hypothesis was that inhibition of arginase with nor-NOHA would decrease the metabolism of arginine to ornithine and urea which, in turn, would shunt more arginine into the NOS pathway for metabolism to NO and citrulline. Direct experimental evidence that this was indeed the case was obtained by measurement of the nitrite + nitrate content of the supernatant solution obtained from lung lavage of the animals. Mice exposed to ovalbumin and treated with nor-NOHA had significantly (P=0.0128) higher concentrations of NOx in their lung lavage supernatants than matched mice that had not received the inhibitor (Figure 8). There was also an apparent trend (not statistically significant) towards increased NOx concentration in the blood plasma of mice treated with nor-NOHA. Arginase levels in isolated airways, as determined by Western blot analysis, were not affected by systemic treatment with nor-NOHA (see Figure 4). Amino acid analysis of the isolated airways showed apparent trends towards decreases in the concentrations of arginine and citrulline (not statistically significant) in the control mice given nor-NOHA that breathed only filtered air, while ornithine concentrations were the same in both groups. In the mice exposed to ovalbumin and nor-NOHA, as compared to mice exposed only to ovalbumin, we observed trends towards apparent decreases in the concentrations of arginine, ornithine, and ADMA with comparable amounts of citrulline in the airways.
Figure 8.
Nitrate/nitrite (NOx) content of lung lavage supernatant from mice exposed to ovalbumin with or without treatment with the arginase inhibitor, nor-NOHA (100 ug/mouse, about 5 mg/Kg, administered ip in a total volume of 100 uL 30 minutes before each ovalbumin aerosol challenge commenced, a total of 6 injections over 2 weeks). *, significantly greater than OVA alone, P=0.0128. Values shown on the graph are group mean concentrations (uM) ± SE, with experimental group size, N, represented as a bracketed number above the bar.
DISCUSSION
The response of mice to ovalbumin exposure in the experiments reported herein was consistent with our previously reported results in the Balb/c strain (Kenyon et al., 2003a). We observed a characteristic cellular inflammatory response in the lung lavage analysis, where eosinophils predominated at two weeks of exposure, constituting about 40–50% of the total cells recovered. Exhaled NO concentration was significantly higher in the mice exposed to ovalbumin than in the matched controls breathing only filtered air. However, the only significant correlation we found between specific inflammatory cells and exhaled NO concentrations was with the lymphocytes. Mice exposed to ovalbumin also had greater decreases in dynamic lung compliance and increases in total lung resistance after methacholine challenge than the air controls.
We observed very faint bands corresponding to barely detectable arginase I expression, but found detectable levels of arginase II, by western blot analysis of whole lungs of normal, unexposed mice. Is this reasonable? We can answer this question by reference to findings by gene array analysis of lungs from mice. Arginase II mRNA is expressed constitutively in the lungs of normal Balb/c mice, while arginase I mRNA is beneath the limits of detection (Zimmerman et al., 2003), which is consistent with our observations by Western blot analysis.
Based upon the existing literature, which is predominantly based upon gene expression (mRNA) analyses, we initially hypothesized that under conditions of increased NO production (e.g. ovalbumin exposure) we would observe increased amounts of arginase, especially of the isoform I, in the lung. Our results strongly implicate the presence of inflammatory leukocytes, especially eosinophils and lymphocytes, and pulmonary macrophages as major sources, directly or indirectly, of arginase I in the lungs of mice exposed to ovalbumin. We cannot, however, rule out eosinophils and/or macrophages as significant sources of arginase I in these experiments. The apparent statistical correlation between arginase I expression and lymphocytes, but not eosinophils, may reflect the relatively greater variability among individual mice in lymphocyte content at the 2-week time point (Figure 1), thereby giving the regression model a wider range of values to work with. Arginase I expression in macrophages is known to be regulated by Th2 cytokines such as IL-4 and IL-13 (Pauleau et al., 2004). Thus, it is likely that alveolar macrophages contribute to the observed levels of arginase I in the lungs of mice exposed to ovalbumin in our experiments. These results suggest that the relative contribution of the airway epithelium to producing arginase I in our model is minimal. On the other hand, the large airways would appear to be a significant source of the arginase II we observe in the lungs of mice in our experiments, suggesting a relatively minor role, if any, for inflammatory cells as sources of arginase II in our model. The occurrence of arginase II constitutively in airway epithelial cells is reasonable if we consider another important role for arginase in the cell, catalysis of the synthesis of proline and glutamate, which play an important role in protein biosynthesis. Since we know that there is airway epithelial cell hyperplasia and proliferation in the ovalbumin model, it is reasonable to assume that there is an obligatory need for baseline levels of arginase in the airway epithelium (Li et al., 2001; 2002) and that this role is played by arginase II in the mouse.
Arginase I is a cytosolic enzyme, while arginase II is located in the mitochondria (Grody et al., 1987; Li et al., 2001; Levillain et al., 2005). It is thought that arginase I is mainly responsible for detoxification of ammonia as urea via the urea cycle (at least in the liver); it has also been suggested to play a major role in the synthesis of polyamines such as spermidine and putrescine due to its cytosolic location (Li et al., 2001). Arginase II is thought to be mainly involved in synthesis of proline and glutamate via ornithine (Grody et al., 1987; Li et al, 2001). It thus appears to be reasonable that the arginase isoform responsible for biosynthesis of amino acids necessary for protein biosynthesis is expressed constitutively in the lung. We observed a statistically significant correlation between decreased lung compliance and increased content of arginase I in isolated airways, consistent with a relationship between increased airway NO production and increased lung compliance. We should note that the overall statistical model used to examine correlations between the various measurements that we used in this study was broken down into subsets of data to examine individual interactions, raising the issue of how best to correct the resulting P values for multiple comparisons. We tested a total of fewer than 15 models in the analysis of this data. Since terms within a model are only analyzed if the model itself is significant, we do not need to correct for every term within every model. Therefore, to make a Bonferroni correction, we conservatively multiplied model p-values by 15. For the lymphocyte×exhaled NO model, the p-values are underestimated. Examination of Q-Q Plots of the residuals indicated that the residuals had slightly heavier tails than the normal distribution. This would cause us to underestimate the true p-value, and, as such, we should not claim that the baseline effect of lymphocytes is significantly different from zero. It is different from zero for several of the experiments, and the effect is significant overall. To follow the dichotomy of Nassim Taleb in Black Swan (2007), we are in Mediocristan, where distributions are still well behaved, as opposed to Extremistan, where analysis based on normal assumptions breaks down. Surprisingly, the residuals from the lung compliance×arginase I model appear to be normal.
The concentration of arginine within the cells of the large airways and within inflammatory leukocytes is an important determinant of the selective role of arginase versus nitric oxide synthase in its metabolism. The intracellular concentration of Larginine in endothelial cells is thought to be 0.1–1 mM (Ogonowski et al., 2000), but this value is probably critically dependent on the arginine content of the medium in which these cells are cultured or isolated. Circulating levels of arginine in plasma from normal human subjects have been reported as about 94 uM, while the corresponding value in asthmatic subjects was 45 uM (Morris et al., 2004). The corresponding value in rat plasma is 83 uM arginine (Kitiyakara et al., 2001), and in mouse plasma is 90 uM (Mattson, 1998). There is no a priori reason to assume that plasma levels can be equated with intracellular concentrations, as arginine is actively transported into cells against a concentration gradient and there is strong evidence that different intracellular compartments exist with respect to arginine concentration (McDonald et al., 1997). Our direct measurements of arginine concentration in tissue homogenates prepared from isolated, microdissected airways gave apparent values of about 13 uM arginine from mice exposed to saline aerosols and about 6 uM in mice exposed to ovalbumin aerosol for 2 weeks. In preliminary experiments we have performed at other time points, we see a smaller decrease in airway arginine concentration after 1 week of ovalbumin exposure, suggesting a progressive decrease over time, and a restoration of normal concentrations of airway arginine at 4 weeks of exposure. Thus, the decreases we observe in airway arginine content coincide with the period of maximal eosinophilic inflammation (Kenyon et al., 2003a), and recovery of normal airway arginine concentration occurs during a period of decreased overall inflammation, with a shift to a more lymphocytic identity. However, there are limitations to this experimental approach that are worth noting here. We are sampling a dynamic metabolic system in vivo at an arbitrary time point, and there is good reason to assume that the lung maintains homeostasis with exogenous arginine from the blood. Thus, metabolic flux of amino acids and polyamines may be tightly regulated via multiple metabolic pathways and not demonstrate a simple pattern of precursor and product concentration consistent with what we would observe with purified enzymes and substrates in the test tube.
Since the microdissected airways are homogenized in saline solution, the concentrations we observe are lower than the actual concentrations in vivo (we would estimate they are of the order of 10% of the true values we would observe in undiluted airways). In this context we should note that plasma arginine values (mouse and human) that we determine with the same HPLC methodology (but without dilution of samples prior to analysis) are consistent with the reported values in the literature. Thus, the absolute values we report in Figure 6 and Figure 7 can’t be directly related to intracellular concentrations in vivo; however, the relative changes are almost certainly an accurate reflection of what is actually occurring in the airways in vivo. The apparent correlation between the decrease in concentration of arginine we report in the airways of mice exposed to ovalbumin, about 53% (Figure 6), and the decrease of 52% in the concentration of circulating arginine in the blood of asthmatic patients reported by Morris et al. (2004) is worthy of note.
Treatment of mice systemically with an arginase inhibitor, nor-NOHA, significantly increased the amount of NO produced, measured as the amount of nitrite + nitrate (NOx) in lung lavage supernatant prepared from mice exposed to ovalbumin. Our results in these experiments, especially the increased production of NO and the trends observed in amino acid concentrations were consistent with inhibition of lung arginase by nor-NOHA, with shunting of arginine into increased metabolism by NOS enzymes. Further studies will be required to determine how the balance of metabolism of arginine is regulated in airway cells, and which of these metabolic pathways are critical in arginine metabolism in the mouse ovalbumin model, especially in light of the known complexity of the pathways for arginine metabolism in mammalian cells, which include not only metabolism by the both the arginase and the NOS pathways, but also resynthesis of arginine from ornithine and/or citrulline via argininosuccinate.
Our results are consistent with the hypothesis that the lung responds to ovalbumin challenge with an adaptive response of the large airways that includes regulation of the concentration of arginine within cells of the airway epithelium and subepithelial layer. Our findings are consistent and reproducible at 2 weeks of exposure to ovalbumin aerosol (6 total exposures), a time point at which eosinophilic inflammation is maximal in this model (Kenyon et al., 2003a), and therefore probably corresponds to an episode of exacerbation of asthma in human disease. Preliminary experiments at other time points suggest that restoration of the normal airway concentration of arginine occurs in parallel with changes in the inflammatory cell population occurring in this model in mice exposed for longer times to ovalbumin aerosol.
ACKNOWLEDGMENTS
We thank Lisa Franzi, Sarah Liu, and Erin O’Roark for their skilled technical assistance. This work was funded in part through grants from the NIEHS (ES-05707, J.A.L.), NHLBI (K08 HL076415, N.J.K.), and NCRR Grant UL1RR024146, a component of the NIH Roadmap for Medical Research (N.J.K.). Michael Last was supported by NIH training grant (TW-05718) and Jennifer Bratt and Angela Linderholm by NIH training grant (HL-07013) during parts of this study.
Footnotes
Publisher's Disclaimer: This is a PDF file of an unedited manuscript that has been accepted for publication. As a service to our customers we are providing this early version of the manuscript. The manuscript will undergo copyediting, typesetting, and review of the resulting proof before it is published in its final citable form. Please note that during the production process errors may be discovered which could affect the content, and all legal disclaimers that apply to the journal pertain.
Conflict of Interest Statement: None of the authors have any conflicts of interest to disclose.
REFERENCES
- ATS/ERS recommendations for standardized procedures for the online and offline measurement of exhaled lower respiratory nitric oxide and nasal nitric oxide. Am. J. Respir. Crit. Care Med. 2005;171:912–930. doi: 10.1164/rccm.200406-710ST. [DOI] [PubMed] [Google Scholar]
- Fajardo I, Svensson L, Bucht A, Pejler G. Increased levels of hypoxia-sensitive proteins in allergic airway inflammation. Am. J. Respir. Crit. Care Med. 2004;170:477–484. doi: 10.1164/rccm.200402-178OC. [DOI] [PubMed] [Google Scholar]
- Jones BN, Gilligan JP. o-phthaldialdehyde precolumn derivatization and reversed-phase high-performance liquid chromatography of polypeptide hydrolysates and physiological fluids. J. Chromatogr. 1983;266:471–482. doi: 10.1016/s0021-9673(01)90918-5. [DOI] [PubMed] [Google Scholar]
- Kenyon NJ, Gohil K, Last JA. Susceptibility to ovalbumin-induced airway inflammation and fibrosis in inducible nitric oxide synthetase-deficient mice: mechanisms and consequences. Toxicol. Appl. Pharmacol. 2003b;191:2–11. doi: 10.1016/s0041-008x(03)00227-8. [DOI] [PubMed] [Google Scholar]
- Kenyon NJ, Last JA. Reversible and irreversible airway inflammation and fibrosis in mice exposed to inhaled ovalbumin. Inflammation Res. 2005;54:57–65. doi: 10.1007/s00011-004-1325-6. [DOI] [PubMed] [Google Scholar]
- Kenyon NJ, Ward RW, Last JA. Airway fibrosis in a mouse model of airway inflammation. Toxicol. Appl. Pharmacol. 2003a;186:90–100. doi: 10.1016/s0041-008x(02)00025-x. [DOI] [PubMed] [Google Scholar]
- King NE, Rothenberg ME, Zimmermann N. Arginine in asthma and lung inflammation. J. Nutr. 2004;134:2830S–2836S. doi: 10.1093/jn/134.10.2830S. [DOI] [PubMed] [Google Scholar]
- Li H, Meininger CJ, Hawker JR, Jr, Haynes TE, Kepka-Lenhart D, Mistry SK, Morris SM, Jr, Wu G. Regulatory role of arginase I and II in nitric oxide, polyamine, and proline syntheses in endothelial cells. Am. J. Physiol. Endocrinol. Metab. 2001;280:E75–E82. doi: 10.1152/ajpendo.2001.280.1.E75. [DOI] [PubMed] [Google Scholar]
- Lindemann D, Racke K. Glucocorticoid inhibition of interleukin-4 (IL-4) and interleukin-13 (IL-13) induced up-regulation of arginase in rat airway fibroblasts. Naunyn Schmiedebergs Arch. Pharmacol. 2003;368:546–550. doi: 10.1007/s00210-003-0839-8. [DOI] [PubMed] [Google Scholar]
- Meurs H, Maarsingh H, Zaagsma J. Arginase and asthma: novel insights into nitric oxide homeostasis and airway hyperresponsiveness. Trends Pharmacol. Sci. 2003;24:450–455. doi: 10.1016/S0165-6147(03)00227-X. [DOI] [PubMed] [Google Scholar]
- Minocha R, Long S. Simultaneous separation and quantitation of amino acids and polyamines of forest tree tissues and cell cultures within a single high-performance liquid chromatography run using dansyl derivatization. J. Chromatogr. A. 2004;1035:63–73. doi: 10.1016/j.chroma.2004.02.026. [DOI] [PubMed] [Google Scholar]
- Morris CR, Poljakovic M, Lavrisha L, Machado L, Kuypers FA, Morris SM., Jr Decreased arginine bioavailability and increased serum arginase activity in asthma. Am. J. Respir. Crit. Care Med. 2004;170:148–153. doi: 10.1164/rccm.200309-1304OC. [DOI] [PubMed] [Google Scholar]
- Ricciardolo FL. cNOS-iNOS paradigm and arginase in asthma. Trends Pharmacol. Sci. 2003;24:560–561. doi: 10.1016/j.tips.2003.09.007. [DOI] [PubMed] [Google Scholar]
- Sarwar G, Botting HG. Rapid analysis of nutritionally important free amino acids in serum and organs (liver, brain, and heart) by liquid chromatography of precolumn phenylisothiocyanate derivatives. J. Assoc. Off. Anal. Chem. 1990;73:470–475. [PubMed] [Google Scholar]
- Schwarze J, Hamelmann E, Bradley KL, Takeda K, Gelfand EW. Respiratory syncytial virus infection results in airway hyperresponsiveness and enhanced airway sensitization to allergen. J. Clin. Invest. 1997;100:226–233. doi: 10.1172/JCI119516. [DOI] [PMC free article] [PubMed] [Google Scholar]
- Silkoff PE, Wakita S, Chatkin J, Ansarin K, Gutierrez C, Caramori M, McClean P, Slutsky AS, Zamel N, Chapman KR. Exhaled nitric oxide after beta2-agonist inhalation and spirometry in asthma. Am. J. Resp. Crit. Care Med. 1999;150:940–944. doi: 10.1164/ajrccm.159.3.9805044. [DOI] [PubMed] [Google Scholar]
- Taleb NN. The Black Swan: The Impact of the Highly Improbable. New York: Random House; 2007. [Google Scholar]
- Vercelli D. Arginase: marker, effector, or candidate gene for asthma? J. Clin. Invest. 2003;111:1815–1817. doi: 10.1172/JCI18908. [DOI] [PMC free article] [PubMed] [Google Scholar]
- Walter MJ, Morton JD, Kajiwara N, Agapov E, Holtzman MJ. Viral induction of a chronic asthma phenotype and genetic segregation from the acute response. J. Clin. Invest. 2002;110:165–175. doi: 10.1172/JCI14345. [DOI] [PMC free article] [PubMed] [Google Scholar]
- Wu G, Morris SM., Jr Arginine metabolism: nitric oxide and beyond. Biochem. J. 1998;336:1–17. doi: 10.1042/bj3360001. [DOI] [PMC free article] [PubMed] [Google Scholar]
- Zimmermann N, King NE, Laporte J, Yang M, Mishra A, Pope SM, Muntel EE, Witte DP, Pegg AA, Foster PS, Hamid Q, Rothenberg ME. Dissection of experimental asthma with DNA microarray analysis identifies arginase in asthma pathogenesis. J. Clin. Invest. 2003;111:1863–1874. doi: 10.1172/JCI17912. [DOI] [PMC free article] [PubMed] [Google Scholar]


