

Summary
Alzheimer’s disease is characterized by the deposition of senile plaques and progressive dementia. The molecular mechanisms that couple plaque deposition to neural system failure, however, are unknown. Using transgenic mouse models of AD together with multiphoton imaging, we measured neuronal calcium in individual neurites and spines in vivo using the genetically-encoded calcium indicator YC3.6. Quantitative imaging revealed elevated [Ca2+]i (calcium overload) in ~20% of neurites in APP mice with cortical plaques, compared to less than 5% in wildtype mice, PS1-mutant mice, or young APP mice (animals without cortical plaques). Calcium overload depended on the existence and proximity to plaques. The downstream consequences included the loss of spino-dendritic calcium compartmentalization (critical for synaptic integration) and a distortion of neuritic morphologies mediated, in part, by the phosphatase calcineurin. Together, these data demonstrate that senile plaques impair neuritic calcium homeostasis in vivo and result in the structural and functional disruption of neuronal networks.
Introduction
[Ca2+]i has a ubiquitous role as an intracellular messenger in myriad electro-chemical signaling cascades in the central nervous system (Hara and Snyder, 2007; Kennedy et al., 2005; Khachaturian, 1994; LaFerla, 2002; Malenka and Bear, 2004; Mattson, 2004). Mammalian neurons use cues from [Ca2+]i to initiate such disparate actions as guided growth of axonal fibers during development (Wen et al., 2004) to initiation of long-term depression or potentiation in synaptic plasticity (Malenka and Bear, 2004). The role of intracellular calcium in the pathogenesis of Alzheimer’s Disease has also been postulated (Mattson, 2007; Smith et al., 2005a). In vitro, both APP and PS1 mutations have been linked to alterations in calcium handling—but it is unclear which mechanism is relevant in vivo. Existing evidence has shown that exogenous application of synthetic amyloid-beta or oligomeric aggregates leads to a rapid, and sustained rise in [Ca2+]i in cultured cells (Demuro et al., 2005; Guo et al., 1999b; Mattson et al., 1993; Mattson et al., 1992). Similarly, the presenilins (PS1 and PS2) have been closely linked with aberrant [Ca2+]i handling and appear to result in exaggerated IP3 calcium signaling (Chan et al., 2000; Stutzmann et al., 2004), enhanced ryanodine-receptor mediated calcium release (Chan et al., 2000; Smith et al., 2005b), a deficit in capacative calcium entry (Akbari et al., 2004; Leissring et al., 2000; Yoo et al., 2000), and vulnerability to excitotoxic insult (Guo et al., 1999a; Guo et al., 1999b). Finally, PS1-mediated effects on calcium regulation might also occur independently of gamma secretase activity (Akbari et al., 2004; Tu et al., 2006).
However, no direct in vivo data exist to support the proposed role of calcium in AD pathophysiology. Specifically, technical limitations have prevented examining the relationship between classical AD pathological alterations and [Ca2+]i, so that the fundamental question of whether senile plaques disrupt calcium homeostasis has not been addressed. We have now developed a multiphoton microscopy based method to measure [Ca2+]i in neuronal perykaria and processes in adult living mice, and demonstrate marked elevations of [Ca2+]i in neurites in the immediate vicinity of senile plaques in aged APP or APP/PS1 overexpressing transgenic mice. We have recently shown that plaque deposition is critical for the subsequent development of neuritic abnormalities in these models (Meyer-Luehmann et al., 2008). Our current experiments demonstrate that the plaque associated disruption in calcium homeostasis is directly coupled to the development of advanced morphological changes, including neuritic beading or blebbing, via activation of calcineurin (CaN, PP2B), providing for the first time a molecular link between amyloid deposition and neuritic abnormalities that underlie neural system dysfunction in AD.
We packaged yellow cameleon 3.6, a Fluorescence Resonant Energy Transfer (FRET) based probe (Nagai et al., 2004), into an adeno-associated virus (AAV2) and expressed this reporter in vivo in the brains of adult, transgenic mice. YC3.6 fills soma, dendrites, axons and dendritic spines thereby allowing coincident measurement of [Ca2+]i and structural morphology—a unique measurement that would be difficult with small-molecule calcium indicators such as Fura-2 or Oregon Green BAPTA. Moreover, we show that YC3.6-expressing neurons respond robustly to stimulation in vivo with relatively fast temporal kinetics. We also show that, unlike other protein-based calcium sensitive probes, we can accurately measure spontaneous somatic calcium transients. Most importantly, YC3.6 is a FRET-based ratiometric probe, that allows quantitative measurement of calcium concentration—something not possible with single wavelength dyes or fluorescent proteins.
Using the functional calcium-sensitive fluorescent protein targeted to clusters of neurons in the intact brain, we show that [Ca2+]i is tightly regulated in the brain in vivo. We found that the resting [Ca2+]i of layer 1 apical tufted dendrites was ~80 nM. Conversely, in mice containing amyloid-plaques we observed that nearly 20% of dendrites and axons exhibited moderate or severe calcium overload—the severity of which correlated with the structural integrity of the dendrite or axon. Amyloid plaque deposition was required for persistent calcium overload, and the effect was most pronounced in the local vicinity of individual plaques. Young APP or PS1 mutant mice did not have resting calcium levels different than wildtype mice. The neuronal processes with the most pronounced calcium overload in APP mice exhibited neuritic blebbing and beading—a hallmark of neuronal degeneration which is nearly identical to those found by classical histopathological methods in AD. Neuronal processes with moderate levels of calcium overload maintained their structural integrity, however, we found that in calcium overloaded dendrites, the dendritic spines no longer compartmentalized [Ca2+]i, thereby precluding independent spine signaling along the dendritic cable. The elevations in [Ca2+]i correlated with neurite beading and calcium-induced cell death—a process consistent with activation of CaN. Inhibition of CaN-activity with FK-506 in vivo led to a steep reduction in neuritic beading—while moderate elevations seen in spiny dendrites and aspiny processes remained unchanged. Thus, CaN inhibition blocks neuritic beading and prevents further accumulation of [Ca2+]i. Our data support the hypothesis that amyloid-beta aggregates induce pathological increases to [Ca2+]i which then triggers CaN-dependent degenerative processes.
Results
YC3.6 Expressed in Cultured Cells
YC3.6 is a ratiometric calcium indicator with a dynamic range that covers the “normal” physiological range of neuronal [Ca2+]i—this makes it particularly well suited for measuring resting [Ca2+]i. We calibrated YC3.6 in CHO cells by varying extracellular [Ca] in the presence of the calcium ionophore, ionomycin (Figure 1). YC3.6 reports increases in [Ca2+]i as an increase in the ratio of YFP to CFP fluorescence (construct in Figure 1A). We saw a nearly four-fold increase in ratio at high [Ca2+]i (R0 = 0.87, RMAX = 3.32). We calculated the Kd of YC3.6 to be 277 nM with a Hill coefficient of 1.1 (Figure 1E). These values of KD and n match well with the published in vitro data (Kd = 250 nM, n = 1.7) (Nagai et al., 2004); our measured values were used for all subsequent [Ca2+]i calibrations. Cultured mouse neocortical neurons were transfected with YC3.6 and the resting [Ca2+]i of proximal processes was determined to be 41 nM ± 7 nM (n = 5 dishes, 48 neurons, Supplementary Figure 1) which corresponds well with published reports—this confirms that YC3.6 accurately reports [Ca2+]i in neocortical neurons (Cox et al., 2000; Helmchen et al., 1996).
Figure 1. Expression and calibration in CHO Cells.
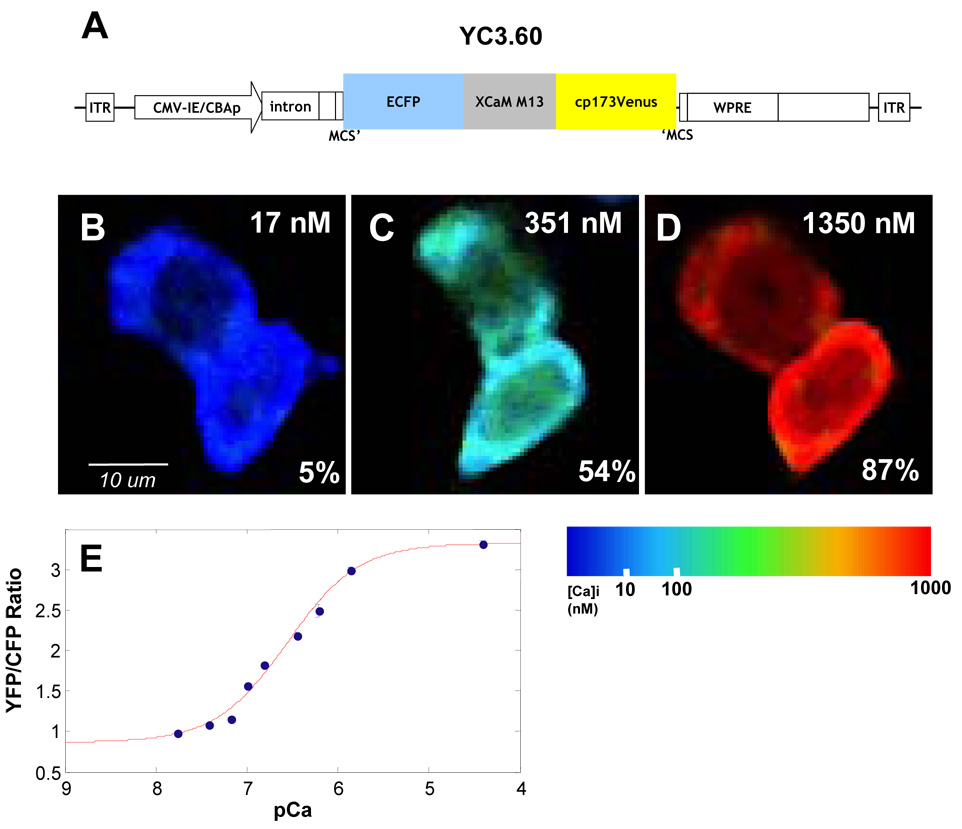
A) Diagram of construct pAAV-CBA-YC3.6-WPRE. See methods for details. B–D) CHO cells were incubated with varying [Ca], indicated in upper right corner, and ionomycin. Relative changes in YFP/CFP ratio are indicated as ΔR/ΔRmax in the bottom right corner. Images are pseudocolored according to the colorbar. E) Ca2+ titration curve of YC3.6 in CHO cells (number of observations: 0 nM = 1,088 cells; 17 nM = 395 cells; 38 nM = 484 cells; 65 nM = 712 cells; 100 nM = 1,223 cells; 150 nM = 1,518 cells; 351 nM = 425 cells; 602 nM = 144 cells; 1350 nM = 1,016 cells; 39 uM = 585 cells). Kd was determined to be 277 nm with a Hill coefficient of 1.1.
Functional Expression of YC3.6 in the Murine Brain
YC3.6-AAV2 was stereotactically targeted to layer 5 pyramidal neurons of the neocortex of mice in vivo. Figure 2 shows in vivo expression in layer 5 neuronal soma (2A) and superficial (< 120 um below the surface) dendrites and axons (2B–D). Hundreds of neurons were infected from a single injection, with YC3.6 evident within two weeks and lasting more than 8 months after viral injection. Dendritic spines were easily resolved at higher magnification and spiny dendrites in layer 1 were prevalent. We examined the response characteristics of YC3.6 in vivo by local micropipette injections of glutamate (Figure 3). Areas with neurites and spines expressing YC3.6 were identified and calcium transients were measured in response to application of glutamate (Figure 3A). Single puffs of glutamate (10 mM in the pipette) were sufficient to evoke [Ca2+]i transients in dendrites (Figure 3B); peak, non-averaged, responses in all dendrites had an average amplitude (ΔR/R) of 56 ± 1% (mean +/− SEM, n = 16). In all cases, the dendritic [Ca2+]i returned to the baseline ratio with an average decay constant of 1.30 ± 0.04 s (mean +/− SEM, n = 16). [Ca2+]i increased, on average, from 78 nM to three times that, 243 nM, during glutamate stimulation. Increasing amounts of glutamate (approximated by co-injection with a red-fluorescent dye) yielded larger amplitude and longer duration calcium responses (Figure 3C).
Figure 2. In vivo expression of YC3.6-AAV.
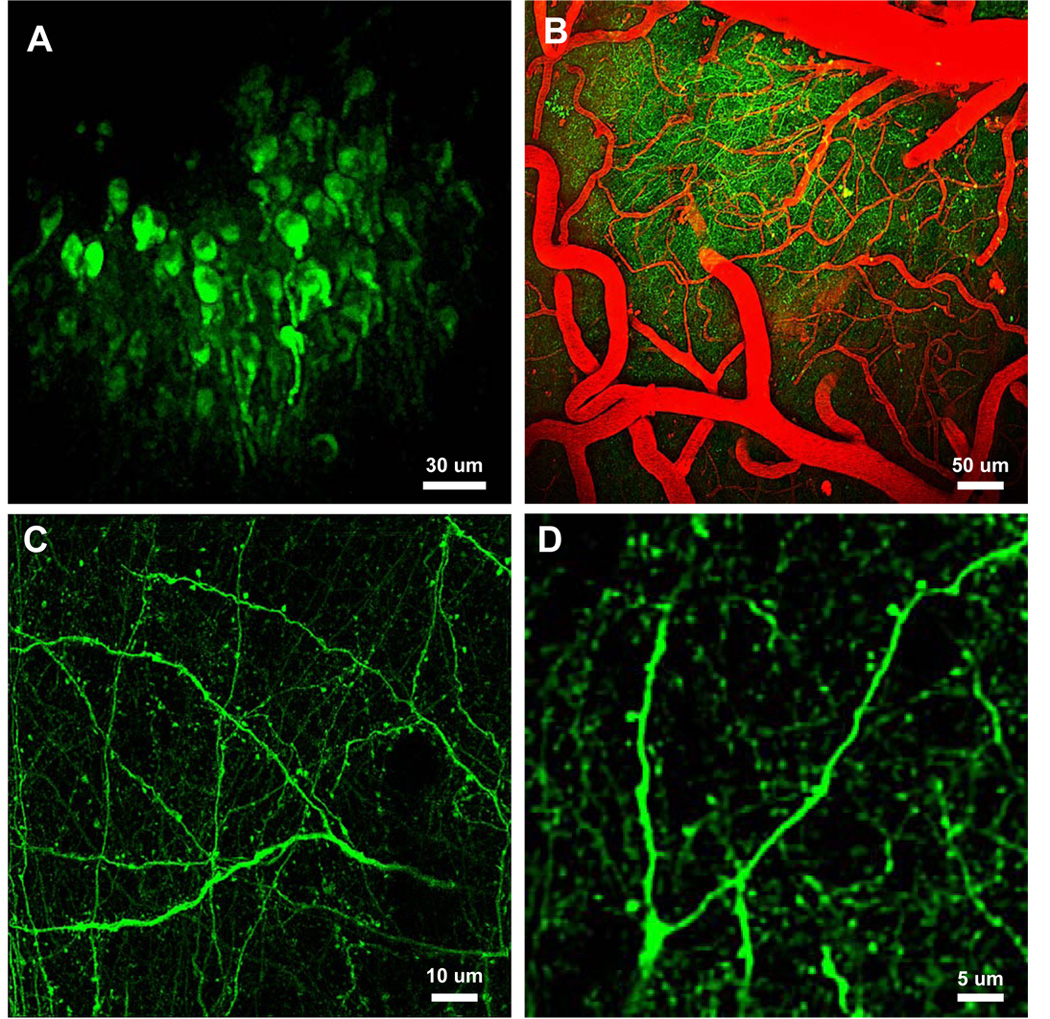
A–D) In vivo multiphoton images deep in the neocortex of adult mice. A) Cell bodies 300–550 microns below the brain surface. B) Full field images of YC3.6-filled neuritis and fluorescent angiogram (red). C) High-resolution images of axons, dendrites and spines in layer I of a wildtype mouse. D) Higher magnification images of a dendritic tree and corresponding spines. Detailed analysis of cellular and sub-cellular morphology was possible with YC3.6.
Figure 3. In Vivo Imaging of Glutamate-evoked Ca2+ transients.
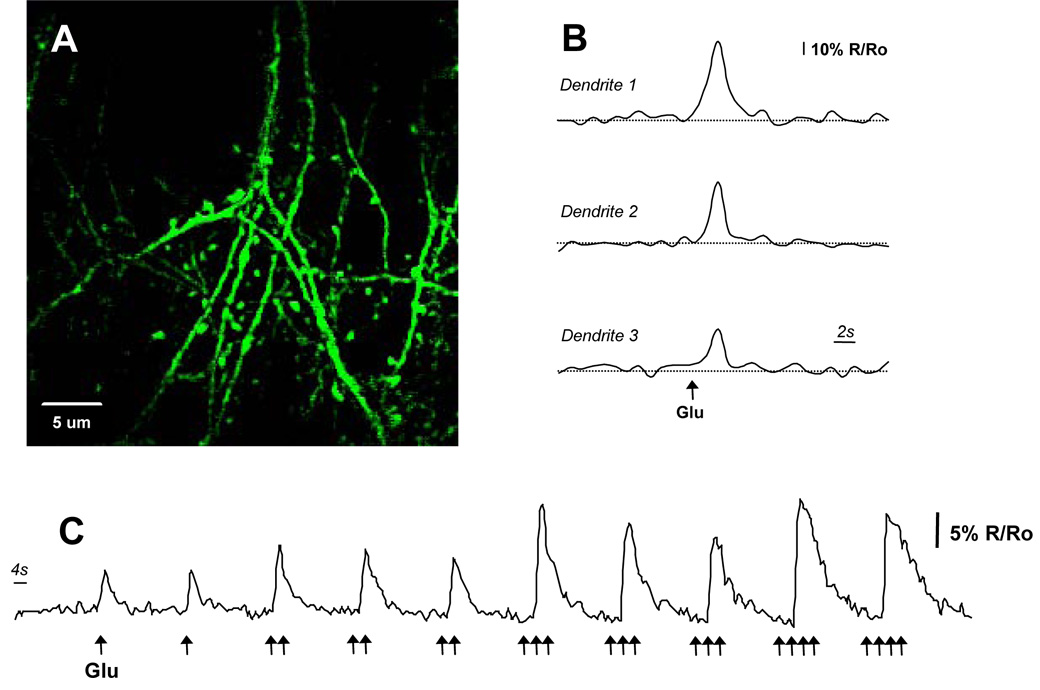
A) High-resolution multiphoton image of dendrites and spines in vivo. The calcium response to micropipette injections of glutamate is described in trace (C). B) Dendrites from three different animals showing responses to small puffs of glutamate (10 mM). Calcium transients were measured as ΔR/R and averaged 56% ± 1% (n=16 dendrites). C) Peak calcium response and the decay constant increased with increased glutamate. Local glutamate concentration was approximated by co-injecting a red-fluorescent synthetic dye.
One concern with fluorescent calcium-sensitive proteins involves their limited efficacy in measuring spontaneous activity known to be present in cortical neurons. We imaged somatic spontaneous calcium transients in layer 5 pyramidal neurons and confirmed that YC3.6-AAV2 exhibited good temporal kinetics (τdecay = 0.43 +/− 0.05 seconds, duration = 0.86 +/− 0.06 seconds, n = 68 transients in 2 mice) and robust changes in YFP/CFP ratio (ΔR/R = 68.7 +/− 3.8 %, n = 68 transients in 2 mice, see Supplementary Figure 2). The robust expression, response to glutamate, concomitant return to baseline concentration, and measurable spontaneous activity provide evidence that the cameleon-based indicator, YC3.6, not only expresses in vivo but provides a quantitative functional readout of neuronal [Ca2+]i dynamics.
Intracellular Calcium is Highly Regulated in vivo
The [Ca2+]i in neurites in WT mice was tightly regulated (Fig 4A,C): the resting [Ca2+]i in all morphologically normal spiny and aspiny processes was 77 nM (65 – 91 nM) (range is one geometric SD away from the geometric mean). There was no appreciable difference between 3.5 month old and 6.5 month old animals (see Supplementary Figure 1). Rare examples (~2.2%) of neurites with calcium overload were observed in these mice (defined as a sustained [Ca2+]i greater than 2 geometric SD above the geometric mean of all processes in WT mice, 147 nM). A log-normal distribution of [Ca2+]i accurately described the range of [Ca2+]i seen in WT mice (r2 = 0.99). To confirm that our [Ca2+]i measurements reflected resting [Ca2+]i, we imaged a subset of neuritis several minutes after the first measurement and confirmed that a similar [Ca2+]i was maintained (p = 0.57, Wilcoxon signed-rank test, n=28). Furthermore, we used relatively slow (~8 seconds per frame), high resolution (512 × 512 or 1024 × 1024 pixels) scans—our measurements reflect, therefore, an integrated “resting” [Ca2+]i that is unlikely to be significantly affected by transient increases in [Ca2+]i in neurites.
Figure 4. Calcium Overload in Neurites of APP/PS1 Transgenic Mice with Cortical Plaques.
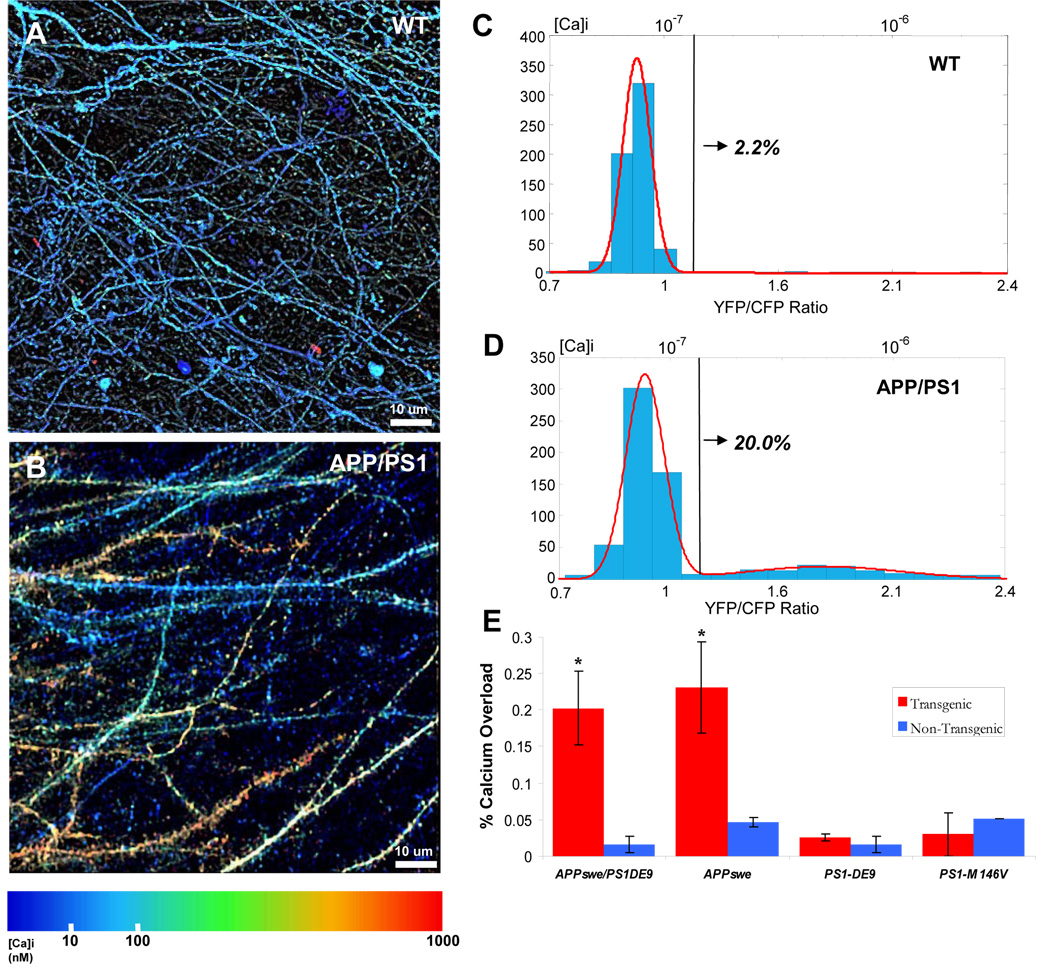
In vivo image of dendrites and axons in aged non-transgenic (A) and transgenic (B) mice. Images are pseudocolored according to [Ca2+]i. C–D) Histograms of [Ca2+]i (YFP/CFP ratio on lower x-axis and [Ca2+]i on upper x-axis). Tg mice had a distinct distribution (D)—modeled as the sum of two Gaussians (red line, r2=0.99)—compared to Non-Tg mice (C, single Gaussian, red line, r2=0.99 ). The black line corresponds to 2 standard deviations above the mean [Ca2+]i in non-Tg mice (147 nM)—above this line was classified as calcium-overloaded. 20.0% of neurites in Tg mice were overloaded compared to only 2.2% in non-Tg mice—a 10-fold increase (n= 3 mice in each group). E) A comparison of the percentage of calcium overloaded neurites across 4 different transgenic mouse lines. Only the APP/PS1 and the Tg-2576 (APPswe only) transgenic mice had significantly higher number of neurites with elevated calcium (*, p < 0.001, Chi-Squared test). PS1 mutant mice that did not exhibit plaques showed no appreciable calcium overload when compared to their respective controls (p = 0.77 for PS1-ΔE9 and p = 0.21 for PS1M146V). The PS1-ΔE9 mice are on the same background as the APP/PS1 transgenic mice—directly comparing the calcium overload between these mice and the APP/PS1 shows that the APP/PS1 mice that develop plaques have a significantly higher calcium overload (20.2% vs. 2.6%, p < 0.001, Chi-square test).
Calcium Overload in Neurites of APP/PS1 Transgenic Mice with Cortical Plaques
We next sought to determine whether calcium overload occurred in the dendrites and axons in transgenic mice with mutations relevant to AD. To do this, we measured the resting [Ca2+]i in four transgenic mouse lines (and associated controls): APPswe/ PS1-ΔE9 double mutants, Tg-2576 (APPswe only), PS1-ΔE9 only and PS1M146V only. The 9 APP/PS1 mutant mice typically develop amyloid-β plaques at 4.5–5 months of age (Garcia-Alloza et al., 2006) whereas the Tg-2576 develop them later—at approximately 14–15 months. Neither of the PS1 mutant mice develops any amyloid-β plaque pathology.
In the APP/PS1 transgenic mouse line, a large number of dendrites and axons exhibited far higher [Ca2+]i than wildtype mice (see Figure 4B and 4D, p < 0.001, n = 1275 total neurites, Mann-Whitney U test). As before, calcium overload was defined as a [Ca2+]i at least two SD above the mean of neurites from non-transgenic mice (147 nM). APP/PS1 mice had nearly 10 times the number of processes that crossed this threshold when compared to non-transgenic mice (20% vs. 2.2%, Figure 4e, p < 0.001, Chi-Squared Test). Different populations of neurites were readily apparent in images pseudo-colored for calcium concentration (see Figure 4B and 4D). Examination of histograms of [Ca2+]i for all axons and dendrites suggested that the transgenic mice had a bimodal distribution, which allowed us to model the data as a sum of two log-normal distributions (r2 = 0.99, Fig. 4D). The first Gaussian exactly matched that seen in non-transgenic mice: mean = 77 nM (63–94 nM). The second peak was shifted far to the right, was 6-fold higher, and was broadened: mean = 499 nM (162–1535 nM).
To test whether APP/PS1 mutations effect calcium overload before plaque deposition, we examined whether [Ca2+]i-elevated neurites existed in younger, 3–3.5 month old APP/PS1 mice – an age prior to the development of plaques but consistent with robust transgene expression (Garcia-Alloza et al., 2006; Jankowsky et al., 2001). [Ca2+]i was not appreciably disturbed in the neurites of these mice (see Supplementary Figure 3). The distribution of [Ca2+]i was significantly different from APP/PS1 mice with plaques (p < 0.001, Student’s T-test, see Supplementary Figure 3 for comparison of distributions). Only 2.3% of neurites in these young transgenic animals had a [Ca2+]i greater than 2 SD above the nontransgenic mean (p = 0.731 when comparing 3–3.5 mo-old APP/PS1 transgenic and > 6.0 mo-old APP/PS1 non-transgenic) which was significantly less than in APP/PS1 mice with plaques (20.2%, p < 0.001).
Calcium Overload Requires Amyloid-β Plaques
The APP/PS1 transgenic mouse model provided clear evidence for calcium overload in a subpopulation of neurites. The primary advantage of this mouse model is the accelerated plaque deposition (by 4.5–5 months of age) compared to the Tg-2576 (APPswe only). Since both the APPswe and PS1-ΔE9 have been implicated in impaired calcium regulation, we next tested which of these mutations might be responsible for the calcium overload by measuring the resting [Ca2+]i in aged Tg-2576 (APPswe) mice and, separately, PS1-ΔE9 mice. To ensure that there is no effect of background strain, and age, on resting levels of calcium, we compared the Tg-2576 against age-matched non-transgenic from the same background strain (n = 3 transgenic mice, n = 2 non-transgenic mice). The PS1-ΔE9 mutant mouse line shares the same background as the APP/PS1 double transgenics so we use age-matched mice in this instance (n=2 transgenic mice, n = 3 non-transgenic).
The Tg-2576 mice exhibited severe calcium overload in the dendrites and axons that were measured, nearly identical to that seen in APP/PS1 mice (p < 0.001, Mann-Whitney U-test, see supplementary figure 4a,c for image and histogram). 22% of all dendrites and axons exhibited calcium overload, compared to 4.5% in the non-transgenics (p < 0.001, Chi-square test, Figure 4e). The 4.5% in the age matched controls is higher than in the APP/PS1 mice (2.2%, p = 0.045) but this small difference can be attributed to the difference in age (6–8 months for the APP/PS1 vs. >17 months for the Tg-2576) and background strain.
We imaged calcium concentration in transgenic mice expressing different mutant PS1 transgenes in the absence of human APP mutations. These mice do not develop amyloid-β plaques despite strong expression of the transgene. Neither the PS1-ΔE9, nor the PS1M146V mutant mice exhibited any appreciable calcium overload compared to their respective controls (p = 0.77 for PS1-ΔE9, p = 0.21 for PS1M146V, Figure 4e). In the PS1-ΔE9 mice, 2.6% of neurites were overloaded with calcium compared to 2.2% in control (see supplementary figure 5a,b for image and histogram). This suggests that although the PS1 mutation helps accelerate plaque deposition in the APP/PS1 transgenic line, a PS1 mutation alone is not sufficient to induce the calcium overload that we observe. These data suggest that mutant forms of PS1, known to have strong effects in fibroblasts and other reduced preparations, do not impact resting neuronal [Ca2+]i in neurites in vivo. This does not preclude, however, more subtle changes in intracellular calcium handling, perhaps in the perikarya, or the existence of compensatory mechanisms that may mask the effect of presenilin mutations on calcium handling.
Aβ Plaques are a focal source of toxicity leading to calcium overload
To examine the cause of the increased [Ca2+]i in APP mice, we next determined whether Aβ plaques had a localized effect on [Ca2+]i. Plaques were concurrently imaged by injecting methoxy-XO4, a fluorescent amyloid binding dye (Klunk et al 2002). We classified the [Ca2+]i neurites as either overloaded (2 SD above the average resting [Ca2+]i in non-transgenic mice) or normal, and then determined the fraction of calcium overloaded neurites at discrete distances from the nearest senile plaque. A greater proportion of neurites with calcium overload existed near plaques when compared to further away. 30% of all neurites within 25 microns of a plaque exhibited strongly elevated [Ca2+]i compared to 17% farther away (p<0.05, Fischer exact test, n=430). Furthermore, a gradient of [Ca2+]i overload was evident (Figure 5), with the fraction of calcium-impaired neurites highest closest to plaques (0–10 microns: 33%, n=30) and slightly less at greater distances (10–30 microns: 26%, n=78). Beyond 30 microns away from the plaque there was no relationship between plaque distance and impaired calcium (30–55 microns: 17%; 55–85 microns: 18%,; p > 0.5, n=352). These results indicate that the immediate micro-environment of an Aβ plaque focally disrupts neuronal [Ca2+]i handling and function, and that calcium overload can be detected (although in a lower percentage of neurites) even at distances farther from a plaque. The extent of disruption is marked: compared to the number of neurites with [Ca2+]i > 2 SD from the mean in controls, the number near a plaque is elevated about 15-fold.
Figure 5. Aβ Plaques are a focal source of toxicity leading to calcium overload.
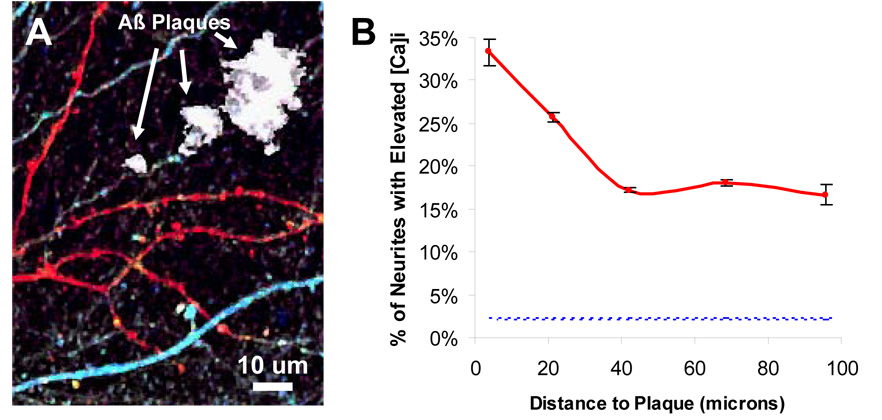
A) In vivo image YC3.6 expressing dendrites and axons surrounding Aβ plaques (labeled in white). Elevated calcium was seen in neurites (in red) alongside neurites with normal calcium (in blue). B) Within 25 microns of a plaque, there was a significantly higher probability of finding a calcium overloaded neurite (p < 0.05, Fisher-Irwin test). The fraction of impaired neurites in non-Tg mice (2.2%) is shown as reference (blue-dotted line). Note that even far from a plaque, the percentage of calcium-overloaded neurites is much greater than in non-Tg mice.
Spino-Dendritic calcium compartmentalization is disrupted in mice with plaques
Calcium overload might have several downstream functional consequences. One such consequence would be altered spino-dendritic compartmentalization. The ability of the dendritic spine to compartmentalize calcium has been shown to be important for proper neuronal signaling and synaptic communication (Araya et al., 2006). A large fraction of the calcium overloaded processes imaged in the APP mice maintained their spino-dendritic morphology, so we used high-resolution 3-dimensional images of dendrites and axons to investigate spine-level calcium effects. 3,438 dendritic spines (n = 5 transgenic and 5 non-transgenic mice) were manually identified and their local calcium concentration was measured alongside the parent dendritic base (see Figures 6A for schematic). Figure 6B shows that, like dendrites and axons, a large number of dendritic spines in transgenic animals have a markedly elevated calcium concentration. To test whether the spine acts as a distinct compartment from the parent dendrite (as has been postulated) (Carter et al., 2007), we paired each spine with its local dendritic base and created a scatter plot of the respective [Ca2+]i values. A slope (m) of 1.0 with a strong correlation (R2) would indicate that the spine and the parent dendrite have the same [Ca2+]i—a slope of zero or a weak correlation would provide evidence that the spine operates independently of the dendritic base. For all normal-calcium dendrites (n=2,977 spines), the associated spines act as independent compartments in which there is no significant correlation between the spine and dendritic base (R2 = 0.26). This holds true for normal-calcium dendrites in both non-transgenic (n = 1647 spines in 5 animals, R2=0.25) and transgenic mice (n = 1,330 spines in 5 animals, R2=0.26, Fig. 6C). In dendrites with elevated-calcium ([Ca2+]i > 147 nM), present uniquely in the cortex of mice containing plaques, this compartmentalization is lost (Fig. 6D, n = 461 spines in 5 animals). Indeed, there is a strong correlation between the spine and dendrite [Ca2+]i (R2 = 0.77) with a slope nearing one (m = 0.85). In this case, spine and dendrite [Ca2+]i scale with each other, no longer allowing independent calcium signaling, suggesting the loss of a crucial mechanism important for dendritic signal integration (Carter et al., 2007).
Figure 6. Disrupted Spino-Dendritic calcium compartmentalization in mice with plaques.
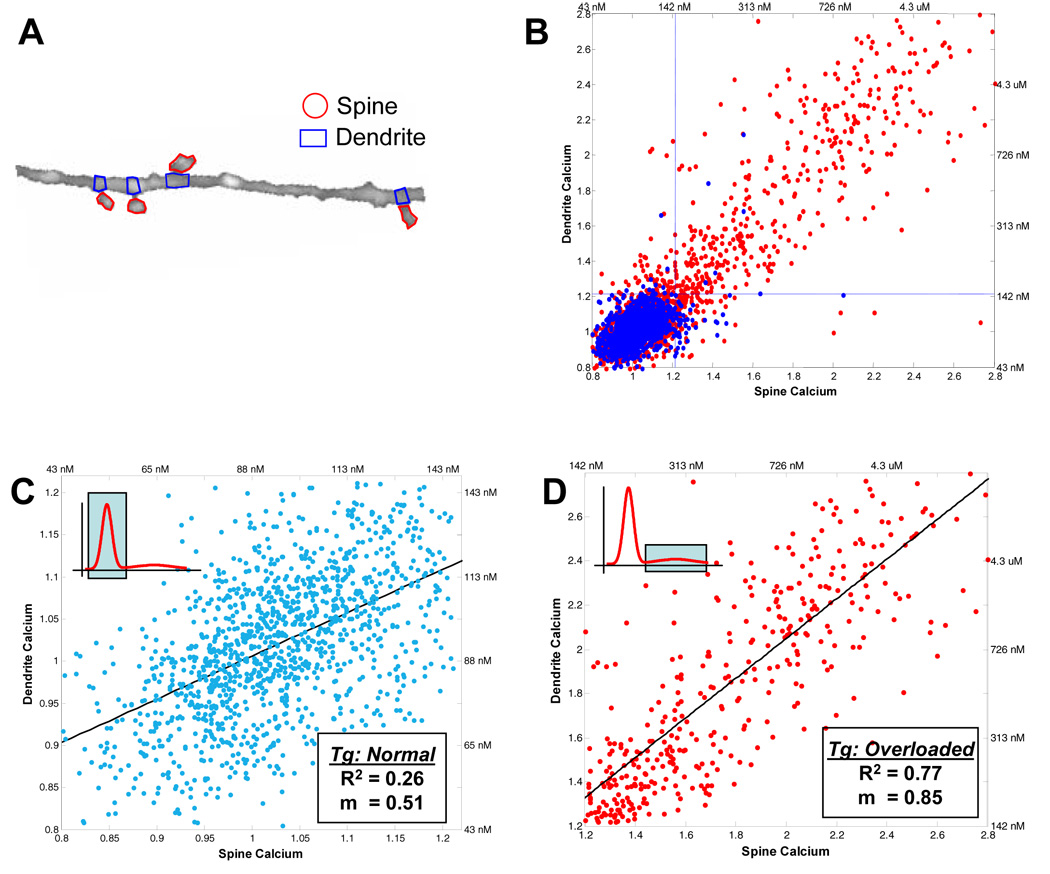
A) Dendritic spines were identified and regions of interest were drawn in ImageJ to isolate the spine from the dendritic compartment at the base of the spine. B) The spine calcium is plotted against the dendrite calcium for each spine-dendrite pair for spines from transgenic (red) and non-transgenic (blue) animals. The blue dotted lines demarcate the threshold for being calcium-elevated ([Ca2+]i > 147 nM). Unlike in the non-transgenic animals (blue), a large number of transgenic spines have a significantly elevated [Ca2+]i, consistent with data from dendrites and axons. C) The inset schematic highlights which part of the calcium distribution is being analyzed in the figure. Calcium is compartmentalized between normal-calcium spines and the local dendritic base—there was no statistically significant correlation between the spine vs. dendrite calcium (R2 = 0.26). C) Spine calcium is plotted against dendrite calcium for all elevated-calcium dendrites in the APP/PS1 mice. The inset highlights the part of the calcium distribution that is being analyzed. A strong correlation exists between the spine calcium and the associated dendritic compartment (R2 = 0.77) with a slope of 0.85 suggesting that the spine and dendrite are nearly completely coupled. Data are from n = 5 transgenic, n = 5 non-transgenic mice.
Elevations in [Ca2+]i Underlie the Morphological Changes in Neuronal Processes
We have recently shown that plaques induce neuritic dystrophies within a radius of ~25 microns, similar to the region noted to have neurites with an increased chance of elevated [Ca2+]i (Meyer-Luehmann et al., 2008). Using a detailed morphometric analysis, we determined that calcium overload occurred in neurites with normal (both aspiny and spiny) and altered (beaded) morphology (Figure 7A–C). 83.1% of all neuritic processes in Layer 1 were spiny dendrites, aspiny processes made up 15.4%, and beaded and dysmorphic neurites were rarely seen (< 1.5%). We next separated neurites from mice with amyloid plaques into two functional groups (normal and calcium overloaded) and classified the morphology for both groups. The normal [Ca2+]i processes had a nearly identical morphological distribution as neurites in wildtype mice (figure 7D). In contrast, neurites with abnormal morphology were strongly over-represented in the calcium overloaded group (Figure 7D). About half of all identified processes were either beaded, blebbed or dysmorphic. The remaining half maintained a normal morphology—26% were classified as spiny dendrites and 21% as aspiny dendrites. As expected, the spiny:aspiny ratio fell from 4:1 to 1:1 near plaques—more processes lacked spines near plaques (Spires et al., 2005). We then compared the[Ca2+]i of the different morphological classes in the calcium overloaded group and found that there was a strong relationship between morphology and resting [Ca2+]i (figure 6E). Calcium overloaded aspiny processes and spiny dendrites (normal morphology) had an average [Ca2+]i of 395 nM (195–801 nM) (6-fold greater than normal [Ca2+]i). [Ca2+]i in beaded and dysmorphic neurites was significantly different than this—955 nM (406–2240 nM) (p < 0.001, Wilcoxon Mann-Whitney test, n = 135)—a striking 12-fold elevation of [Ca2+]i. The observation that [Ca2+]i increased as the morphology shifted from normal to abnormal suggests that profound morphological changes are associated with sustained increases in [Ca2+]i. Since we also observed large numbers of neurites that were morphologically normal but had marked [Ca2+]i elevations, morphological changes appear to represent only a subset of functionally altered dendrites in the cortex of mice with amyloid plaques. Thus, our in vivo functional pathology approach provided a window into diseased processes that could not be readily identified on the basis of morphological inspection alone.
Figure 7. Calcium overload underlies distortions to neuritic morphologies.
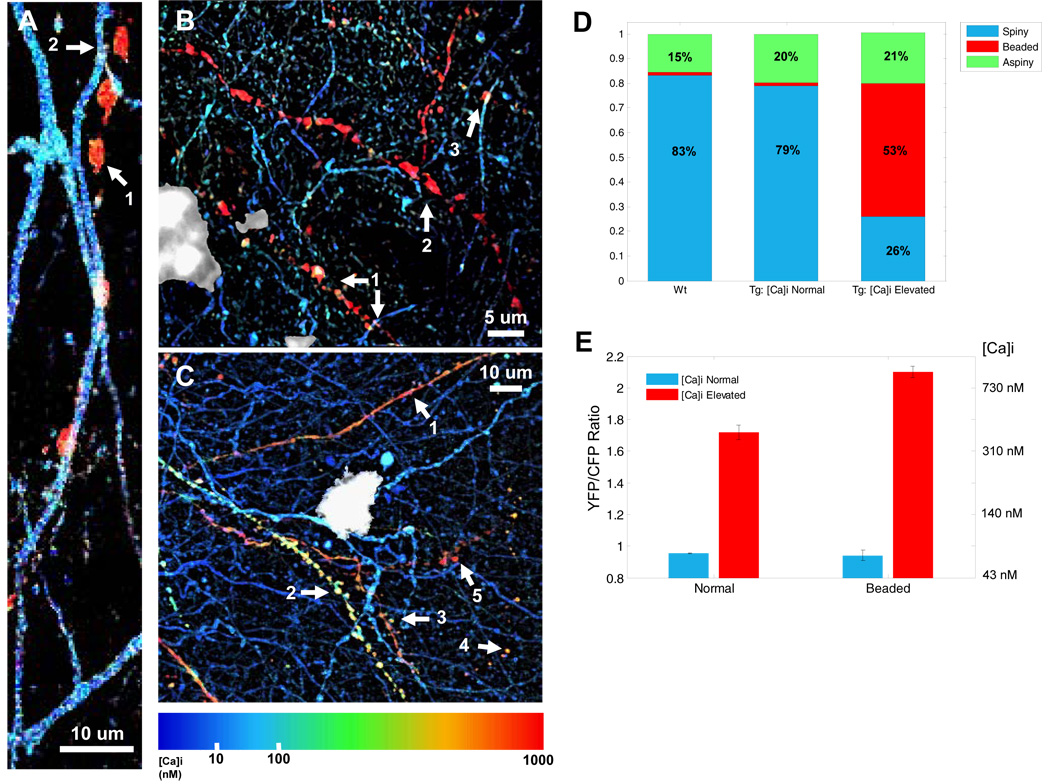
A) A [Ca2+]i-elevated “beaded” neurite (1) interdigitates with a morphologically, and functionally, normal dendrite (2). B) Beaded (1–3) neurites adjacent to a senile plaque (in white) exhibit high [Ca2+]i. C) Structurally intact spiny dendrites (1 – 3) and structurally compromised beaded neurites (4 and 5) adjacent to a senile plaque (in white) exhibit significantly elevated [Ca2+]i. D) The morphological breakdown of non-transgenic neurites matches that seen in [Ca2+]i normal neurites in transgenic mice. [Ca2+]i -elevated neurites, however, show a marked difference in morphological categorization. E). Resting [Ca2+]i differs between morphologically normal and abnormal neurites in the calcium-overloaded neurite population (p < 0.001, Mann-Whitney test).
Calcineurin Inhibition Prevents Neuritic Beading and Severe Calcium Overload
Elevated [Ca2+]i might also lead to downstream activation of signaling pathways important for cell death or survival. We next asked the question of whether the neuritic beading morphology, and corresponding severe elevations in intracellular calcium, could be antagonized by inhibiting the Ca++/Calmodulin-dependent protein phosphatase 2B (calcineurin, CaN). We postulated that a moderate rise in intracellular calcium would be sufficient to activate CaN (Shankar et al., 2007; Wen et al., 2004)—in certain conditions, increased CaN activity has been shown to lead to neurite degeneration and, more specifically, neuritic beading (Zeng et al., 2007). Moreover, recent behavioral data suggests that inhibiting CaN restores associative learning and memory in adult APP mice (Dineley et al., 2007). Taken together, we posited that a moderate elevation in [Ca2+]i, induced by amyloid-beta initiates a signaling cascade that triggers excessive CaN activity.
We treated animals with FK-506 (10 mg/kg, ip), a potent CaN inhibitor, daily for 7 days in APP/PS1 transgenic mice with established senile plaques. On day 7, we performed a craniotomy and measured, in vivo, the resting [Ca2+]i in the dendrites and axons of neurons in the cortex. As with un-treated APP/PS1 mice, we found a substantial subset of dendrites and axons with calcium overload (n = 3 FK-506 treated mice and 290 neurites, n = 3 sham-treated mice and 578 neurites, Fig 8a). However, the average resting [Ca2+]i in the calcium-overloaded group of processes was substantially reduced when compared to sham-treated mice (p < 0.01, Mann-Whitney U-test, Fig 8c). To understand this reduction, we visually identified the morphology of all of the processes and separated them into three classes, as in Figure 6: aspiny, spiny or beaded/dysmorphic. In Figure 6, we showed that calcium overload is more pronounced when the axon or dendrite appeared abnormal—either as a beaded or dysmorphic morphological structure. In the FK-506 treated mice there was a marked reduction in the number of beaded and dysmorphic processes (Figure 8b,d). Only 33% of calciume-levated processes exhibited an abnormal morphology—compared to 54% in untreated and sham-treated mice, a reduction of almost 55% (p < 0.05, Chi-Squared Test). Thus, we see a shift in the “class” of calcium-overload (from severely overloaded beaded processes to moderately overloaded normal processes). Surprisingly, this is augmented by a downwards shift in the intracellular calcium of beaded processes but not in those that are morphologically intact suggesting a feedback loop between calcineurin and [Ca2+]i (p < 0.05 for beaded processes and p = 0.6087 for normal processes, Student’s T-Test, Figure 8e). This provides clear evidence that CaN plays an important role downstream of the pathological elevations in [Ca2+]i we observed in the transgenic mice. Thus, CaN inhibition partially retards the progressive structural and functional degeneration of vulnerable axons and dendrites.
Figure 8. Calcineurin Inhibition Prevents Neuritic Beading and Severe Calcium Overload.
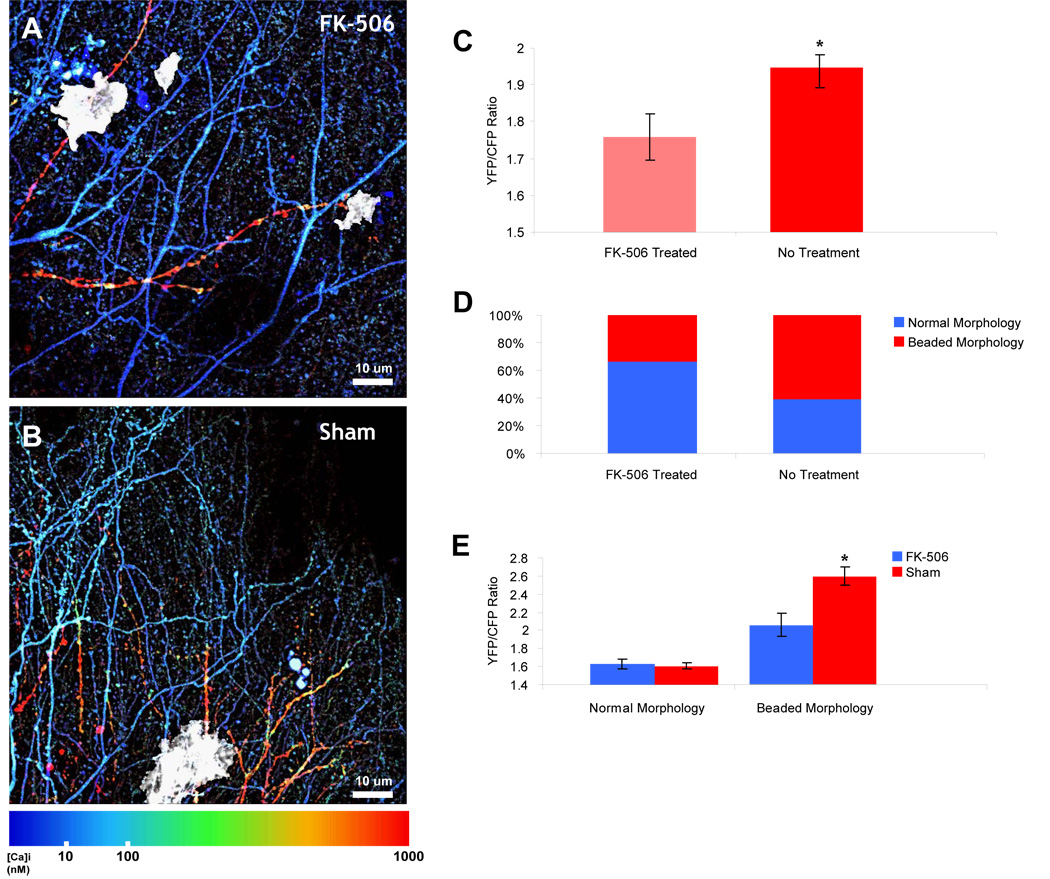
A) Pseudocolored multiphoton image of transgenic mouse treated with FK-506. Daily intraperitoneal injection of FK-506 (10 mg/kg) prevented the neuritic beading and severe calcium overload typically seen in APP/PS1 mice near plaques (in white). B) Multiphoton image of APP/PS1 mouse that was sham-treated. Moderate and severe calcium overloaded neurites surround a plaque with varying morphologies. C) In the calcium-overloaded neurites, there was a significant reduction in the resting calcium (p< 0.01, Mann-Whitney U-test). D) The reduction in [Ca2+]i can be explained by a reduction in the percentage of neurites that exhibit neuritic beading—only 33% of calcium-overloaded neurites exhibit a beaded and severe elevation of [Ca2+]i compared to 54% in sham-treatment (n = 3 mice in each group, n = 159 calcium-overloaded neurites, p < 0.05, Chi-Squared Test). E) Morphologically normal processes (spiny dendrites and aspiny processes) exhibit nearly the same [Ca2+]i in FK-506 treated or sham-treated mice (n = 82 neurites, p = 0.6807, students T-test) whereas there is a slight, but significant, reduction in the [Ca2+]i in those neurites with an abnormal morphology (n = 87 neurites, p < 0.05, student’s T-test).
Discussion
Alzheimer’s Disease is defined by the deposition of senile plaques, neurofibrillary tangles and progressive neuronal loss. A longstanding controversy surrounds what precedes the neurodegeneration—what is the trigger, or series of triggers, that leads to neuronal dysfunction and, subsequently, neural system failure? Pinpointing the discrete stages at which neurons degenerate will elucidate targets for therapeutic intervention. A growing body of evidence has suggested that calcium dyshomeostasis might be an important, and possibly critical, step towards initiating cell death mechanisms. Most of this evidence, however, comes from reduced systems in which cultured cell lines, or acute brain slices are used to study the intracellular regulation of calcium. These reports demonstrated that exogenous amyloid-β application or expression of mutant PS1 can lead to altered calcium levels. Without measuring such changes in an intact neural system, and alongside AD-relevant pathology, it is difficult to draw conclusions as to whether calcium overload is indeed relevant in AD and, just as importantly, which mechanisms might be responsible.
In vivo multiphoton microscopy provides an ideal approach to measure changes to brain structure and function in aged, adult mouse models. To accurately measure intracellular changes in calcium in neuronal processes, along with neuritic morphology requires a fluorescent probe that can fill not only soma, but also dendrites, axons and spines. We found that yellow-cameleon 3.6 when expressed via an adeno-associated vector (AAV2) allowed such a measurement. As a FRET-based probe, it is capable of reporting quantitative [Ca2+]i when calibrated appropriately. Just as importantly, it exhibits relatively fast kinetics and robust response properties to physiologically relevant stimuli making it useful for a wide variety of neuroscientific applications. We exploited gene transfer and intravital multiphoton microscopy to image YC3.6 in layer 5 pyramidal neurons in transgenic mice that have mutations associated with AD—both mutations in APP and PS1.
We found that amyloid-β plaque deposition was required to induce calcium overload. This was confirmed using four different mouse models—two of which develop plaques, the APPswe/PS1- ΔE9 mouse line which has an accelerated deposition of plaques and the Tg-2576 (APPswe) line. No calcium overload was seen in either of the PS1-mutant mice (PS1-ΔE9 or PS1-M146V) that we investigated. Importantly, neither of these FAD-linked mutations alone leads to plaque deposition. Furthermore, in 3.5 mo-old APP/PS1 transgenic mice, an age before plaque deposition, there was no appreciable calcium overload. These data provide evidence that mutant PS1, though important in accelerating plaque deposition when coupled with mutant APP, does not play a role in the calcium overload in neurites that we measured. It does not preclude, however, a more subtle role for mutant PS1 in calcium handling. In fact, based on recent evidence from acute brain slices in multiple transgenic mouse lines, it is likely that PS1 mutations might affect intracellular calcium signaling by modulating release from the ER (Stutzmann et al., 2006). These more subtle changes to intracellular calcium might work alongside the calcium overload we describe.
The calcium overload we observed in vivo in transgenic mouse models was coupled to the deposition of senile plaques, and was most pronounced in the immediate vicinity of senile plaques. This suggests that senile plaques are the proximal event in the cascade, but does not preclude a diffusible toxic species, e.g. Aβ oligomers, enriched near plaques. We propose a multi-stage degenerative process in which amyloid-β aggregates induce calcium influx as an initial acute trigger. The resulting moderate calcium overload initiates a second pathological stage that activates the phosphatase, CaN. Increased CaN activity then triggers the final stage of neurite structural degeneration and even more severe calcium overload. Recent evidence suggests that CaN activation is directly linked to dendritic structural degeneration and neuritic beading (Zeng et al., 2007). By inhibiting CaN with FK-506, we showed that we can prevent the third stage—structural degradation of calcium overloaded morphologically-intact dendrites and axons—thereby halting the progressive degeneration at an intermediate phase. In behavioral studies, CaN inhibition with FK-506 partially restored learning and memory in Tg-2576 mice (Dineley et al., 2007). Our data now allow a mechanistic interpretation of these results. We suggest that the restoration of behavioral deficits may reflect the prevention of neuritic beading and severe calcium overload that otherwise would irreversibly interrupt neural circuit function important for learning and memory.
We have also shown another major functional consequence of calcium overload: disruption of the spino-dendritic signaling interface. Normally, spines compartmentalize calcium from the local parent dendrite thereby allowing independent signaling of multiple spines along the same dendritic cable. Dendrites overloaded with calcium no longer have spines that can compartmentalize their calcium. Rather, the dendrite and spine are fully coupled, no longer allowing independent signaling events. This deficit may underlie the neuronal network dysfunction in AD.
Taken together, the activation of CaN and the alterations of spino-dendritic coupling suggest another important consequence—one with specific implications for cellular mechanisms of learning and memory. The calcium overload in layer 1 spiny dendrites in APP mice was approximately 500 nM; this range is similar in magnitude to levels that have been associated with long-term depression (LTD) of synaptic strength (Sabatini et al., 2002), suggesting a link between the cellular mechanisms of LTD and the pathophysiology of AD. Multiple lines of evidence have shown that activation of CaN leads to LTD (Malenka and Bear, 2004; Mulkey et al., 1994)—taken together, we posit that the calcium overload and subsequent CaN activation is sufficient to induce LTD. This hypothesis is further supported by evidence that a sustained increase in [Ca2+]i can initiate LTD (Tanaka et al., 2007) and that local application of Aβ can induce LTD-like mechanisms in vitro (Snyder et al., 2005).
The calcium overload we observed in the transgenic animals and associated LTD mechanisms could contribute to the reduced spine density present throughout the cortex and which is particularly striking within 25 microns of a senile plaque (Spires et al., 2005). Our in vivo data suggest that calcium overload is also most acute near plaques, reinforcing the idea that senile plaques are focal sources of toxicity. Neurites with highly elevated [Ca2+]i are more likely to lack spines; in neurites from WT or APP/PS1 mice with normal [Ca2+]i, the ratio of spiny to aspiny processes is ~4:1. This ratio changes almost four-fold to nearly 1:1 among neurites with calcium overload—consistent with the hypothesis that calcium overload is associated with spine loss via a CaN-mediated pathway (Hsieh et al., 2006). Taken together with recent studies, this suggests that [Ca2+]i -elevations might yield changes in the strength of synaptic connections which might, in turn, lead to the chronic loss of spines. Thus amyloid-β accumulation impacts spines in at least two ways: the structural loss of spiny processes near plaques as well as marked functional impairment of calcium compartmentalization at the spino-dendritic interface. The magnitude of these changes in the cortex is remarkable, with nearly 20% of all neurites exhibiting calcium overload. These data provide novel in vivo support for synaptic plasticity mediated changes to network properties that are crucial for learning and memory.
We have determined at least three specific downstream functional consequences of calcium overload—spino-dendritic calcium de-compartmentalization, structural neuritic alterations and CaN activation—and highlighted an important intermediary stage that can be targeted for therapeutic intervention—inhibiting CaN activity leads to amelioration of the structural and functional deficits and may have behavioral implications. A critical factor that remains to be determined is the specific pathway that amyloid-β activates to induce calcium influx. The effect may be mediated by the formation of calcium-conducting pores comprised of the Aβ peptide (Arispe et al., 1993a; Arispe et al., 1993b; Pollard et al., 1993; Simakova and Arispe, 2006), modulation of voltage-gated calcium channels (Brorson et al., 1995; Ekinci et al., 1999; MacManus et al., 2000), or an Aβ-mediated oxidative stress that results in altered calcium regulation (Behl et al., 1994; Yan et al., 1996; Yuan and Yankner, 2000). Nonetheless, we show that mutant APP processing and subsequent plaque deposition play a critical role in inducing calcium overload in these AD models and activating calcineurin-dependent neurodegenerative processes.
Experimental Procedures
In Situ Calibration of YC3.6 in CHO Cells
CHO cells were maintained in Opti-MEM (Invitrogen, Carlsbad CA) supplemented with 5% FBS (Invitrogen, Carlsbad CA) and 5% CO2 at 37 °C. After adherence to 35-mm glass-bottom dishes (MatTek, Ashland MA), cells were transiently transfected with FuGene (Roche, Indianapolis IN) dissolved in DMEM (Invitrogen, Carlsbad CA), and 5ug Yellow Cameleon-pAAV construct. Prior to imaging, cells were washed with PBS. In situ calibration of YC3.6 was performed by incubating dishes in mixed EGTA/CaEGTA (Invitrogen) solutions and ionomycin (20 uM) at 37 degrees. Hundreds of cells were sampled under multiphoton excitation at 860 nM at 10 different [Ca] conditions (0 nM – 39 uM) and custom-written ImageJ software was used to automate cell identification and calculate YFP-CFP ratios. A histogram of the YFP-CFP ratios always showed a bimodal distribution with one peak (~35% of the cells on average) not sensitive to changes in [Ca]—these cells were excluded from the analysis. The second peak shifted to higher ratios with increasing [Ca]i and we extracted this second peak to determine the mean YFP/CFP ratio for a given [Ca]i. The apparent Kd and Hill coefficient (n) were determined using standard equations (Grynkiewicz et al., 1985).
Neuronal Culture Preparation
Primary neuronal cultures were prepared as described elsewhere (Berezovska et al., 2003). In brief, mixed cortical-hippocampal neurons were generated from CD1 mice at embryonic day 15–16. The cells were plated on four-well poly-l-lysine-coated glass slides in chemically defined Neurobasal media (Invitrogen) containing 10% fetal bovine serum for 1 h. The neurons were maintained in Neurobasal media containing 2% B27 supplement (Invitrogen) for 6–12 days in vitro prior to transient transfection of Yellow Cameleon-pAAV construct with FuGene. At 5–7 days in vitro, 5 µg/ml cytosine arabinoside (Sigma) was added to the culture media to suppress the growth of non-neuronal cells.
Yellow-Cameleon AAV preparation
We used the construct pAAV-CBA-YC3.6-WPRE. The plasmid contained the AAV terminal repeats (ITRs), the only remaining feature of the wild-type AAV genome. Flanked by the ITRs, the expression cassette included the following components in 5’ to 3’ order: 1) a 1.7-kb sequence containing hybrid cytomegalovirus (CMV) immediate-early enhancer/chicken beta-actin promoter/exon1/intron; 2) yellow cameleon 3.60 cDNA; and 3) woodchuck hepatitis virus posttranscriptional regulatory element (WPRE). The virus titer was 1.1×10^12 viral genomes/mL.
Animals and Surgery
Four transgenic mouse lines were used. 1) APP/PS1: mutant human PS1- ΔE9 and a chimeric mouse/human APPswe and age-matched non-transgenic controls (Borchelt et al., 1997). Two different age groups of these mice were used (6–8 months with plaques and 3–3.5 months without plaques). 2) Tg-2576: 695 aa isoform of APP containing the Swedish mutation and non-transgenic controls. These mice were used at 17–20 months of age. 3) PS1-ΔE9: mutant human PS1- ΔE9 alone. These mice were used at 5–6 months of age. 4) PS1M146V. All studies were conducted with approval of the Massachusetts General Hospital Animal Care and Use Committee and in compliance with NIH guidelines for the use of experimental animals.
Intracortical injections and cranial window implantation have been described previously (Skoch et al., 2005; Spires et al., 2005). For intracortical injections of YC-AAV2, mice were anesthetized with isoflurane and placed in a custom made, heated stereotaxic apparatus. The surgical site was sterilized with betadyne and isopropyl alcohol, and a 2–3 mm incision was made in the scalp along the midline between the ears. Burr holes were drilled in the skull, 1 mm lateral to bregma bilaterally. Using a Hamilton syringe, 4 µl of virus (titer, 4.2 × 10¹² viral genomes/ml) was injected 1.2 mm deep in somatosensory cortex (targeting layer 5 neurons) at a rate of 0.2 µl/min. After one injection in each burr hole, the scalp was sutured, and the mouse was allowed to recover from anesthesia on a heating pad.
After a > 3-week incubation period to allow expression of YC3.6 in neurons, mice received an intraperitoneal injection of methoxy-XO4 (10 mg/kg), a fluorescent compound that crosses the blood-brain barrier and binds to amyloid plaques (Klunk et al., 2002 ). The following day, a cranial window 6 mm in diameter was installed under isoflurane anesthesia as described previously.(Bacskai et al., 2002; Klunk et al., 2002) In a subset of experiments, Texas Red dextran (70,000 Da molecular weight; 12.5 mg/ml in sterile PBS; Invitrogen) was injected into a lateral tail vein to provide a fluorescent angiogram.
Multiphoton Imaging
Images of YC3.6-filled neuronal processes, amyloid pathology, and blood vessels were obtained using one of two microscopes: 1) a Bio-Rad 1024ES multiphoton microscope (Bio-Rad), mounted on an Olympus (Tokyo, Japan) BX50WI upright microscope (details have been described previously, (Skoch et al., 2005)) or 2) Olympus Fluoview 1000MPE with pre-chirp optics and a fast AOM mounted on an Olympus BX61WI upright microscope. A wax ring was placed on the edges of the coverslip of the cortical window and filled with distilled water to create a well for an Olympus 20x dipping objective (numerical aperture, 0.95). A mode-locked titanium/sapphire laser (MaiTai; Spectra-Physics, Fremont, CA) generated two-photon fluorescence with 860 nm excitation, and detectors containing three photomultiplier tubes (Hamamatsu, Ichinocho, Japan) collected emitted light in the range of 380–480, 500–540, and 560–650 nm (Bacskai et al., 2002). The average power reaching the brain tissue ranged from 20–60 milliwatts. Neurites were typically sampled 0–100 microns below the surface of the brain and, when possible, cell soma were sampled 350–550 microns below the surface.
Image Processing and Data Analysis
3D image stacks were processed using ImageJ and MATLAB. We exhaustively sampled neuritic area using two techniques, 1) visual identification and neurite tracing, and 2) automated segmentation. Data were collected from 2–4 volumes for each animal and statistics, non-parametric and multiple comparisons where appropriate, were performed between groups. Ratios were converted to [Ca2+]i using the in situ Kd and Hill coefficient with standard ratiometric equations (RMIN = 0.58, median of lowest 5% of plaque-associated dystrophies;0020RMAX = 2.48, median of top 5% of calcium overloaded processes) (Grynkiewicz et al., 1985). Geometric mean, standard deviation and standard error were used to describe [Ca2+]i as they more effectively capture the central tendencies of log-normal distributions. Distances to plaques were measured based on the closest approach of a neurite to the edge of the nearest plaque. Pseudocolored images were created in Matlab based on the YFP/CFP ratio which was then converted to calcium concentration. Ratio images were created first: R = [(YFP-Background)/(CFP-Background)]. We then applied a calibrated color lookup table and converted the map to HSV colorspace. We used the ratio values to supply the Hue and Saturation (color) and the reference image to supply the Value (intensity). For the high-resolution analysis of dendritic spines, individual ROIs were manually traced for each spine and associated dendrite in ImageJ. The data were imported and analyzed in MATLAB.
Supplementary Material
Acknowledgements
This work was supported by NIH EB000768 (BJB), AG08487 (BTH), and NIH NS580752 (KVK). We would like to thank Dr. Frosch and Dr. Ohki for reviewing the manuscript, Dr. Miyawaki for providing the YC3.6 plasmid, Laura Borrelli and Katie Bercury for assistance, and Scott Raymond for help with data analysis.
Footnotes
Publisher's Disclaimer: This is a PDF file of an unedited manuscript that has been accepted for publication. As a service to our customers we are providing this early version of the manuscript. The manuscript will undergo copyediting, typesetting, and review of the resulting proof before it is published in its final citable form. Please note that during the production process errorsmaybe discovered which could affect the content, and all legal disclaimers that apply to the journal pertain.
REFERENCES
- Akbari Y, Hitt BD, Murphy MP, Dagher NN, Tseng BP, Green KN, Golde TE, LaFerla FM. Presenilin regulates capacitative calcium entry dependently and independently of gamma-secretase activity. Biochem Biophys Res Commun. 2004;322:1145–1152. doi: 10.1016/j.bbrc.2004.07.136. [DOI] [PubMed] [Google Scholar]
- Araya R, Eisenthal KB, Yuste R. Dendritic spines linearize the summation of excitatory potentials. Proceedings of the National Academy of Sciences. 2006;103:18799–18804. doi: 10.1073/pnas.0609225103. [DOI] [PMC free article] [PubMed] [Google Scholar]
- Arispe N, Pollard HB, Rojas E. Giant multilevel cation channels formed by Alzheimer disease amyloid beta-protein [A beta P-(1–40)] in bilayer membranes. Proc Natl Acad Sci U S A. 1993a;90:10573–10577. doi: 10.1073/pnas.90.22.10573. [DOI] [PMC free article] [PubMed] [Google Scholar]
- Arispe N, Rojas E, Pollard HB. Alzheimer disease amyloid beta protein forms calcium channels in bilayer membranes: blockade by tromethamine and aluminum. Proc Natl Acad Sci U S A. 1993b;90:567–571. doi: 10.1073/pnas.90.2.567. [DOI] [PMC free article] [PubMed] [Google Scholar]
- Bacskai BJ, Klunk WE, Mathis CA, Hyman BT. Imaging amyloidbeta deposits in vivo. J Cereb Blood Flow Metab. 2002;22:1035–1041. doi: 10.1097/00004647-200209000-00001. [DOI] [PubMed] [Google Scholar]
- Behl C, Davis JB, Lesley R, Schubert D. Hydrogen peroxide mediates amyloid beta protein toxicity. Cell. 1994;77:817–827. doi: 10.1016/0092-8674(94)90131-7. [DOI] [PubMed] [Google Scholar]
- Berezovska O, Ramdya P, Skoch J, Wolfe MS, Bacskai BJ, Hyman BT. Amyloid precursor protein associates with a nicastrin-dependent docking site on the presenilin 1-gamma-secretase complex in cells demonstrated by fluorescence lifetime imaging. J Neurosci. 2003;23:4560–4566. doi: 10.1523/JNEUROSCI.23-11-04560.2003. [DOI] [PMC free article] [PubMed] [Google Scholar]
- Borchelt DR, Ratovitski T, van Lare J, Lee MK, Gonzales V, Jenkins NA, Copeland NG, Price DL, Sisodia SS. Accelerated amyloid deposition in the brains of transgenic mice coexpressing mutant presenilin 1 and amyloid precursor proteins. Neuron. 1997;19:939–945. doi: 10.1016/s0896-6273(00)80974-5. [DOI] [PubMed] [Google Scholar]
- Brorson JR, Bindokas VP, Iwama T, Marcuccilli CJ, Chisholm JC, Miller RJ. The Ca2+ influx induced by beta-amyloid peptide 25–35 in cultured hippocampal neurons results from network excitation. J Neurobiol. 1995;26:325–338. doi: 10.1002/neu.480260305. [DOI] [PubMed] [Google Scholar]
- Carter AG, Soler-Llavina GJ, Sabatini BL. Timing and location of synaptic inputs determine modes of subthreshold integration in striatal medium spiny neurons. J Neurosci. 2007;27:8967–8977. doi: 10.1523/JNEUROSCI.2798-07.2007. [DOI] [PMC free article] [PubMed] [Google Scholar]
- Chan SL, Mayne M, Holden CP, Geiger JD, Mattson MP. Presenilin-1 mutations increase levels of ryanodine receptors and calcium release in PC12 cells and cortical neurons. J Biol Chem. 2000;275:18195–18200. doi: 10.1074/jbc.M000040200. [DOI] [PubMed] [Google Scholar]
- Cox CL, Denk W, Tank DW, Svoboda K. Action potentials reliably invade axonal arbors of rat neocortical neurons. Proc Natl Acad Sci U S A. 2000;97:9724–9728. doi: 10.1073/pnas.170278697. [DOI] [PMC free article] [PubMed] [Google Scholar]
- Demuro A, Mina E, Kayed R, Milton SC, Parker I, Glabe CG. Calcium dysregulation and membrane disruption as a ubiquitous neurotoxic mechanism of soluble amyloid oligomers. J Biol Chem. 2005;280:17294–17300. doi: 10.1074/jbc.M500997200. [DOI] [PubMed] [Google Scholar]
- Dineley KT, Hogan D, Zhang WR, Taglialatela G. Acute inhibition of calcineurin restores associative learning and memory in Tg2576 APP transgenic mice. Neurobiol Learn Mem. 2007;88:217–224. doi: 10.1016/j.nlm.2007.03.010. [DOI] [PMC free article] [PubMed] [Google Scholar]
- Ekinci FJ, Malik KU, Shea TB. Activation of the L voltage-sensitive calcium channel by mitogen-activated protein (MAP) kinase following exposure of neuronal cells to beta-amyloid. MAP kinase mediates beta-amyloid-induced neurodegeneration. J Biol Chem. 1999;274:30322–30327. doi: 10.1074/jbc.274.42.30322. [DOI] [PubMed] [Google Scholar]
- Garcia-Alloza M, Robbins EM, Zhang-Nunes SX, Purcell SM, Betensky RA, Raju S, Prada C, Greenberg SM, Bacskai BJ, Frosch MP. Characterization of amyloid deposition in the APPswe/PS1dE9 mouse model of Alzheimer disease. Neurobiol Dis. 2006;24:516–524. doi: 10.1016/j.nbd.2006.08.017. [DOI] [PubMed] [Google Scholar]
- Grynkiewicz G, Poenie M, Tsien RY. A new generation of Ca2+ indicators with greatly improved fluorescence properties. J Biol Chem. 1985;260:3440–3450. [PubMed] [Google Scholar]
- Guo Q, Fu W, Sopher BL, Miller MW, Ware CB, Martin GM, Mattson MP. Increased vulnerability of hippocampal neurons to excitotoxic necrosis in presenilin-1 mutant knock-in mice. Nat Med. 1999a;5:101–106. doi: 10.1038/4789. [DOI] [PubMed] [Google Scholar]
- Guo Q, Sebastian L, Sopher BL, Miller MW, Ware CB, Martin GM, Mattson MP. Increased vulnerability of hippocampal neurons from presenilin-1 mutant knock-in mice to amyloid beta-peptide toxicity: central roles of superoxide production and caspase activation. J Neurochem. 1999b;72:1019–1029. doi: 10.1046/j.1471-4159.1999.0721019.x. [DOI] [PubMed] [Google Scholar]
- Hara MR, Snyder SH. Cell signaling and neuronal death. Annu Rev Pharmacol Toxicol. 2007;47:117–141. doi: 10.1146/annurev.pharmtox.47.120505.105311. [DOI] [PubMed] [Google Scholar]
- Helmchen F, Imoto K, Sakmann B. Ca2+ buffering and action potentialevoked Ca2+ signaling in dendrites of pyramidal neurons. Biophys J. 1996;70:1069–1081. doi: 10.1016/S0006-3495(96)79653-4. [DOI] [PMC free article] [PubMed] [Google Scholar]
- Hsieh H, Boehm J, Sato C, Iwatsubo T, Tomita T, Sisodia S, Malinow R. AMPAR removal underlies Abeta-induced synaptic depression and dendritic spine loss. Neuron. 2006;52:831–843. doi: 10.1016/j.neuron.2006.10.035. [DOI] [PMC free article] [PubMed] [Google Scholar]
- Jankowsky JL, Slunt HH, Ratovitski T, Jenkins NA, Copeland NG, Borchelt DR. Co-expression of multiple transgenes in mouse CNS: a comparison of strategies. Biomol Eng. 2001;17:157–165. doi: 10.1016/s1389-0344(01)00067-3. [DOI] [PubMed] [Google Scholar]
- Kennedy MB, Beale HC, Carlisle HJ, Washburn LR. Integration of biochemical signalling in spines. Nat Rev Neurosci. 2005;6:423. doi: 10.1038/nrn1685. [DOI] [PubMed] [Google Scholar]
- Khachaturian ZS. Calcium hypothesis of Alzheimer's disease and brain aging. Ann N Y Acad Sci. 1994;747:1–11. doi: 10.1111/j.1749-6632.1994.tb44398.x. [DOI] [PubMed] [Google Scholar]
- Klunk WE, Bacskai BJ, Mathis CA, Kajdasz ST, McLellan ME, Frosch MP, Debnath ML, Holt DP, Wang Y, Hyman BT. Imaging Abeta plaques in living transgenic mice with multiphoton microscopy and methoxy-X04, a systemically administered Congo red derivative. J Neuropathol Exp Neurol. 2002;61:797–805. doi: 10.1093/jnen/61.9.797. [DOI] [PubMed] [Google Scholar]
- LaFerla FM. Calcium dyshomeostasis and intracellular signalling in Alzheimer's disease. Nat Rev Neurosci. 2002;3:862–872. doi: 10.1038/nrn960. [DOI] [PubMed] [Google Scholar]
- Leissring MA, Akbari Y, Fanger CM, Cahalan MD, Mattson MP, LaFerla FM. Capacitative calcium entry deficits and elevated luminal calcium content in mutant presenilin-1 knockin mice. J Cell Biol. 2000;149:793–798. doi: 10.1083/jcb.149.4.793. [DOI] [PMC free article] [PubMed] [Google Scholar]
- MacManus A, Ramsden M, Murray M, Henderson Z, Pearson HA, Campbell VA. Enhancement of (45)Ca(2+) influx and voltage-dependent Ca(2+) channel activity by beta-amyloid-(1–40) in rat cortical synaptosomes and cultured cortical neurons. Modulation by the proinflammatory cytokine interleukin-1beta. J Biol Chem. 2000;275:4713–4718. doi: 10.1074/jbc.275.7.4713. [DOI] [PubMed] [Google Scholar]
- Malenka RC, Bear MF. LTP and LTD: an embarrassment of riches. Neuron. 2004;44:5–21. doi: 10.1016/j.neuron.2004.09.012. [DOI] [PubMed] [Google Scholar]
- Mattson MP. Pathways towards and away from Alzheimer's disease. Nature. 2004;430:631–639. doi: 10.1038/nature02621. [DOI] [PMC free article] [PubMed] [Google Scholar]
- Mattson MP. Calcium and neurodegeneration. Aging Cell. 2007;6:337–350. doi: 10.1111/j.1474-9726.2007.00275.x. [DOI] [PubMed] [Google Scholar]
- Mattson MP, Barger SW, Cheng B, Lieberburg I, Smith-Swintosky VL, Rydel RE. beta-Amyloid precursor protein metabolites and loss of neuronal Ca2+ homeostasis in Alzheimer's disease. Trends Neurosci. 1993;16:409–414. doi: 10.1016/0166-2236(93)90009-b. [DOI] [PubMed] [Google Scholar]
- Mattson MP, Cheng B, Davis D, Bryant K, Lieberburg I, Rydel RE. beta-Amyloid peptides destabilize calcium homeostasis and render human cortical neurons vulnerable to excitotoxicity. J Neurosci. 1992;12:376–389. doi: 10.1523/JNEUROSCI.12-02-00376.1992. [DOI] [PMC free article] [PubMed] [Google Scholar]
- Meyer-Luehmann M, Spires-Jones TL, Prada C, Garcia-Alloza M, de Calignon A, Rozkalne A, Koenigsknecht-Talboo J, Holtzman DM, Bacskai BJ, Hyman BT. Rapid appearance and local toxicity of amyloid-beta plaques in a mouse model of Alzheimer's disease. Nature. 2008;451:720–724. doi: 10.1038/nature06616. [DOI] [PMC free article] [PubMed] [Google Scholar]
- Mulkey RM, Endo S, Shenolikar S, Malenka RC. Involvement of a calcineurin/inhibitor-1 phosphatase cascade in hippocampal long-term depression. Nature. 1994;369:486–488. doi: 10.1038/369486a0. [DOI] [PubMed] [Google Scholar]
- Nagai T, Yamada S, Tominaga T, Ichikawa M, Miyawaki A. Expanded dynamic range of fluorescent indicators for Ca(2+) by circularly permuted yellow fluorescent proteins. Proc Natl Acad Sci U S A. 2004;101:10554–10559. doi: 10.1073/pnas.0400417101. [DOI] [PMC free article] [PubMed] [Google Scholar]
- Pollard HB, Rojas E, Arispe N. A new hypothesis for the mechanism of amyloid toxicity, based on the calcium channel activity of amyloid beta protein (A beta P) in phospholipid bilayer membranes. Ann N Y Acad Sci. 1993;695:165–168. doi: 10.1111/j.1749-6632.1993.tb23046.x. [DOI] [PubMed] [Google Scholar]
- Sabatini BL, Oertner TG, Svoboda K. The life cycle of Ca(2+) ions in dendritic spines. Neuron. 2002;33:439–452. doi: 10.1016/s0896-6273(02)00573-1. [DOI] [PubMed] [Google Scholar]
- Shankar GM, Bloodgood BL, Townsend M, Walsh DM, Selkoe DJ, Sabatini BL. Natural oligomers of the Alzheimer amyloid-beta protein induce reversible synapse loss by modulating an NMDA-type glutamate receptor-dependent signaling pathway. J Neurosci. 2007;27:2866–2875. doi: 10.1523/JNEUROSCI.4970-06.2007. [DOI] [PMC free article] [PubMed] [Google Scholar]
- Simakova O, Arispe NJ. Early and late cytotoxic effects of external application of the Alzheimer's Abeta result from the initial formation and function of Abeta ion channels. Biochemistry. 2006;45:5907–5915. doi: 10.1021/bi060148g. [DOI] [PubMed] [Google Scholar]
- Skoch J, Hickey GA, Kajdasz ST, Hyman BT, Bacskai BJ. In vivo imaging of amyloid-beta deposits in mouse brain with multiphoton microscopy. Methods Mol Biol. 2005;299:349–363. doi: 10.1385/1-59259-874-9:349. [DOI] [PubMed] [Google Scholar]
- Smith IF, Green KN, LaFerla FM. Calcium dysregulation in Alzheimer's disease: recent advances gained from genetically modified animals. Cell Calcium. 2005a;38:427–437. doi: 10.1016/j.ceca.2005.06.021. [DOI] [PubMed] [Google Scholar]
- Smith IF, Hitt B, Green KN, Oddo S, LaFerla FM. Enhanced caffeine-induced Ca2+ release in the 3xTg-AD mouse model of Alzheimer's disease. J Neurochem. 2005b;94:1711–1718. doi: 10.1111/j.1471-4159.2005.03332.x. [DOI] [PubMed] [Google Scholar]
- Snyder EM, Nong Y, Almeida CG, Paul S, Moran T, Choi EY, Nairn AC, Salter MW, Lombroso PJ, Gouras GK, Greengard P. Regulation of NMDA receptor trafficking by amyloid-beta. Nat Neurosci. 2005;8:1051–1058. doi: 10.1038/nn1503. [DOI] [PubMed] [Google Scholar]
- Spires TL, Meyer-Luehmann M, Stern EA, McLean PJ, Skoch J, Nguyen PT, Bacskai BJ, Hyman BT. Dendritic spine abnormalities in amyloid precursor protein transgenic mice demonstrated by gene transfer and intravital multiphoton microscopy. J Neurosci. 2005;25:7278–7287. doi: 10.1523/JNEUROSCI.1879-05.2005. [DOI] [PMC free article] [PubMed] [Google Scholar]
- Stutzmann GE, Caccamo A, LaFerla FM, Parker I. Dysregulated IP3 signaling in cortical neurons of knock-in mice expressing an Alzheimer's-linked mutation in presenilin1 results in exaggerated Ca2+ signals and altered membrane excitability. J Neurosci. 2004;24:508–513. doi: 10.1523/JNEUROSCI.4386-03.2004. [DOI] [PMC free article] [PubMed] [Google Scholar]
- Stutzmann GE, Smith I, Caccamo A, Oddo S, LaFerla FM, Parker I. Enhanced Ryanodine Receptor Recruitment Contributes to Ca2+ Disruptions in Young, Adult, and Aged Alzheimer's Disease Mice. J. Neurosci. 2006;26:5180–5189. doi: 10.1523/JNEUROSCI.0739-06.2006. [DOI] [PMC free article] [PubMed] [Google Scholar]
- Tanaka K, Khiroug L, Santamaria F, Doi T, Ogasawara H, Ellis-Davies GC, Kawato M, Augustine GJ. Ca2+ requirements for cerebellar long-term synaptic depression: role for a postsynaptic leaky integrator. Neuron. 2007;54:787–800. doi: 10.1016/j.neuron.2007.05.014. [DOI] [PubMed] [Google Scholar]
- Tu H, Nelson O, Bezprozvanny A, Wang Z, Lee SF, Hao YH, Serneels L, De Strooper B, Yu G, Bezprozvanny I. Presenilins form ER Ca2+ leak channels, a function disrupted by familial Alzheimer's disease-linked mutations. Cell. 2006;126:981–993. doi: 10.1016/j.cell.2006.06.059. [DOI] [PMC free article] [PubMed] [Google Scholar]
- Wen Z, Guirland C, Ming GL, Zheng JQ. A CaMKII/calcineurin switch controls the direction of Ca(2+)-dependent growth cone guidance. Neuron. 2004;43:835–846. doi: 10.1016/j.neuron.2004.08.037. [DOI] [PubMed] [Google Scholar]
- Yan SD, Chen X, Fu J, Chen M, Zhu H, Roher A, Slattery T, Zhao L, Nagashima M, Morser J, et al. RAGE and amyloid-beta peptide neurotoxicity in Alzheimer's disease. Nature. 1996;382:685–691. doi: 10.1038/382685a0. [DOI] [PubMed] [Google Scholar]
- Yoo AS, Cheng I, Chung S, Grenfell TZ, Lee H, Pack-Chung E, Handler M, Shen J, Xia W, Tesco G, et al. Presenilin-mediated modulation of capacitative calcium entry. Neuron. 2000;27:561–572. doi: 10.1016/s0896-6273(00)00066-0. [DOI] [PubMed] [Google Scholar]
- Yuan J, Yankner BA. Apoptosis in the nervous system. Nature. 2000;407:802–809. doi: 10.1038/35037739. [DOI] [PubMed] [Google Scholar]
- Zeng LH, Xu L, Rensing NR, Sinatra PM, Rothman SM, Wong M. Kainate seizures cause acute dendritic injury and actin depolymerization in vivo. J Neurosci. 2007;27:11604–11613. doi: 10.1523/JNEUROSCI.0983-07.2007. [DOI] [PMC free article] [PubMed] [Google Scholar]
Associated Data
This section collects any data citations, data availability statements, or supplementary materials included in this article.