

Abstract
A critical function of the brain’s orienting response is to evaluate novel environmental events in order to prepare for potential behavioral action. Here, measures of synchronization (power, coherence) and nonlinear cross-frequency phase coupling (m:n phase locking measured with bicoherence and cross-bicoherence) were computed on 62-channel electroencephalographic (EEG) data during a paradigm in which unexpected, highly-deviant, novel sounds were randomly intermixed with frequent standard and infrequent target tones. Low frequency resolution analyses showed no significant changes in phase coupling for any stimulus type, though significant changes in power and synchrony did occur. High frequency resolution analyses, on the other hand, showed significant differences in phase coupling, but only for novel sounds compared to standard tones. Novel sounds elicited increased power and coherence in the delta band together with m:n phase locking (bicoherence) of delta:theta (1:3) and delta:alpha (1:4) rhythms in widespread fronto-central, right parietal, temporal, and occipital regions. Cross-bicoherence revealed that globally synchronized delta oscillations were phase coupled to theta oscillations in central regions and to alpha oscillations in right parietal and posterior regions. These results suggest that globally synchronized low frequency oscillations with phase coupling to more localized higher frequency oscillations provide a neural mechanism for the orienting response.
Keywords: Bicoherence, cross-frequency coupling, orienting response, novelty, P3, coherence
1. Introduction
The orienting response is a fundamental biological mechanism that is necessary for survival (Luria, 1973). It is a rapid response to new, unexpected or unpredictable events that entails the involuntary (so-called “bottom up”) capture of attention and essentially functions as a “what-is-it” detector (Sokolov, 1990). The neural correlates of the orienting response in humans have been most often studied by recording event-related potentials (ERPs) during the auditory novelty oddball paradigm. In that paradigm, stimuli consist of a frequent tone (the standard) randomly interspersed with less frequent target tones and novel sounds. The latter are a set of unexpected environmental sounds that occur only once per experiment. A great deal of research has indicated that the P3 component of the ERP elicited by novel sounds is an electrophysiological correlate of the orienting response (Friedman et al., 2001). This novelty P3 (called P3a) is distinct from the P3 elicited by equally-infrequent targets tones (called P3b) in its cognitive correlates, surface topography and intracranial sources. Widespread posterior, parietal, and temporal areas contribute to the P3b and widespread frontal, parietal, and temporal areas contribute to the P3a (Friedman et al., 2001; Ranganath and Rainer, 2003). These electrophysiological studies of the orienting response have primarily been carried out in the time domain by analyzing amplitudes, latencies, and intracranial source models of ERP components. Complementary analysis of EEG recordings in the frequency domain makes it possible to directly quantify known neural mechanisms such as synchronization and cross-frequency coupling of field potential oscillations (Isler et al., 2007). Such analyses provide a framework to investigate how the distributed neuronal networks that underpin the orienting response act in concert to determine what the deviant, environmental perturbation represents, evaluate its significance, and prepare for a possible behavioral response.
Synchronization of oscillations in electric field potentials within and between brain regions is an efficient mechanism for coalescing local and regional assemblies into more widespread networks (Varela et al., 2001). Oscillatory synchrony can function as a fundamental mechanism in both perception (Gray et al., 1989; Tallon-Baudry et al., 1996) and behavior control (Pfurtscheller et al., 1994; von Stein et al., 2000). Membrane potential oscillations precipitate plasticity (LTP/LTD) even in the absence of post-synaptic action potentials, i.e. without Hebbian plasticity (Golding et al., 2002). Furthermore, at least for some brain rhythms and regions, information is encoded in the phase of oscillatory activity (O’Keefe and Recce, 1993). Phase encoding offers a rich modality for “putting oscillations to work” in the brain and has been proposed as a potential mechanism for working memory (Buzsaki, 2005; Jensen and Lisman, 1998). We hypothesized that it could be a brain mechanism for the orienting response.
Increasingly, there is evidence that oscillations in the traditional EEG frequency bands (delta 1-4Hz, theta 4-8Hz, alpha 8-12Hz, beta 12-25Hz, gamma >25Hz) are manifestations of, and may even facilitate, different cognitive functions (Buschman and Miller, 2007; Buzsaki and Draguhn, 2004), although the mapping from function to frequency may not be unique and may be dynamically and spatially variable (Palva and Palva, 2007). For example, the theta band is associated with memory and information transfers between neocortex and hippocampus (Kahana et al., 2001) while the gamma band is associated with stimulus feature binding, localized representations, and awareness (Bertrand and Tallon-Baudry, 2000; Lachaux et al., 2000; Rodriguez et al., 1999). Consequently, coupling of oscillatory activity across frequency bands (cross-frequency coupling) provides a simple mechanism whereby distinct cognitive functions can operate conjointly to perform a given task (Jensen and Colgin, 2007). Cross-frequency coupling in which the amplitude of one frequency is modulated by the phase of another frequency (phase-amplitude coupling) has been observed in intracortical recordings (Canolty et al., 2006) in both spontaneous and task-related activity and has led to the idea of an oscillatory hierarchy made up of nested phase-amplitude relationships (Lakatos et al., 2005). Another form of cross-frequency coupling is phase-phase coupling (or m:n phase locking, or simply phase coupling) which occurs as the result of nonlinear interactions between frequencies, though it can also arise due to nonlinear distortions, autoresonance, and other nonlinear processes. Demonstration of this form of coupling has been made in vitro (Gloveli et al., 2005) and in vivo (Palva et al., 2005; Schack et al., 2002). With phase coupling, information encoded in the phase of the higher frequency is preserved across multiple cycles of the lower frequency rhythm. This provides a mechanism for multiplexing the activity in a single neuron or local neuronal population because the same neuron(s) can simultaneously phase-encode at multiple frequencies.
The goal of the present study was to determine if cross-frequency phase coupling of electric potential oscillations occurs as part of the brain’s orienting response to unexpected environmental stimuli. We hypothesized that it would, under the assumption that neuronal networks exhibiting synchronized oscillations at different frequencies (perhaps subserving distinct cognitive functions) would be interacting during the orienting response. We tested our hypothesis by quantifying synchronizaton and cross-frequency phase coupling of brain oscillations in the auditory novelty oddball paradigm. Specifically, we hypothesized that cross-frequency phase coupling would be greater for novel sounds than for target and standard tones. Furthermore, we expected regional synchronization to be greater for target than standard tones, and even greater for novel sounds than targets, with a spatial distribution that was more anterior for novels and more posterior for targets.
2. Results
Figure 1 shows grand-averaged waveforms for frontal (Fz, top) and posterior electrodes (Pz, bottom) for the three stimulus types. As in previous studies, all three stimuli elict a P1-N1-P2 complex at early latencies (< 200ms) while novel sounds elicit a large positive potential over frontal regions at approximately 300ms post-stimulus whereas target tones elicit a somewhat later and broader positive potential over posterior regions (Friedman et al., 2001). Frequency domain measures of synchrony and coupling were then the focus of subsequent analyses to further differentiate these three types of stimuli.
1. Averaged waveforms.
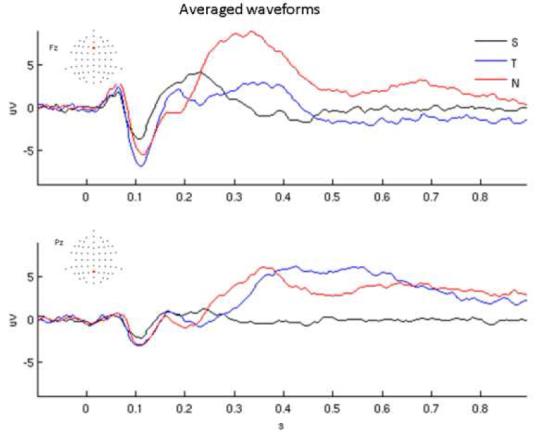
Grand average waveforms for standard tones (S, black), target tones (T, blue), and novel, environmental sounds (N, red) Top: frontal electrode (Fz); bottom: posterior electrode (Pz).
Low frequency resolution analysis (10Hz frequency resolution, 100ms intervals, 50ms overlap)
Significant differences were determined as change from a pre-stimulus 100ms interval. In the lowest frequency bin (0-5Hz, not shown) power results were similar to those shown for the 10Hz band. In the 10Hz band (5-15Hz, Figure 2), significant increases in power occurred over frontal regions for all three stimulus types at 100 and 150 ms (i.e. 50-200 ms). The magnitude of the increase was greatest for the novel (∼100%), smaller for the target (∼50%) and lowest for the standard (∼25%). Only the novel had a significant power increase at 200ms (i.e. 150-250ms). Significant power decreases (“desynchronization”, (Pfurtscheller and Andrew, 1999)) of 20 to 40% occurred at later latencies (>250-300ms) for both the novel and target but not for the standard. This decrease continued beyond 500ms (not shown). There were no significant changes in coherence for the standard but there were widespread increases in coherence over frontal and central regions for the target at 150ms and for the novel at 150, 200, and 250ms. Interestingly, the widespread increase in coherence for the novel at 250ms occurred when there was no (significant) concomitant increase in power, and furthermore all increases in coherence for the novel and target occurred before 300ms.
2. 5 to 15 Hz power and coherence.

Low frequency resolution analysis at a center frequency of 10Hz. Fractional change from pre-stimulus power in overlapping 100ms windows is shown by balls at the scalp electrode locations with fractional values shown in color. Large ball sizes denote significant changes. At the blue arrows, significant changes from baseline coherence are shown by lines connecting electrode locations, with increases in coherence shown by black lines (no significant decreases in coherence occurred). In determining significance, p-values were corrected for multiple comparisons with a false discovery rate of 0.05. Note: power in the 0 to 5 Hz band was similar to that shown here, but coherence could not be measured in that band.
In the 20Hz band (15-25Hz, Figure 3) the only significant increase in coherence occurred for the novel at 250ms when there was a concomitant significant 10 to 20% decrease in power. In higher frequency bands there were no significant changes in coherence and there were no power increases, though there continued to be decreased power for the target and novel stimuli at later latencies (>250ms). Bicoherence and cross-bicoherence showed no significant changes for any frequency pairs.
3. 15 to 25Hz power and coherence.
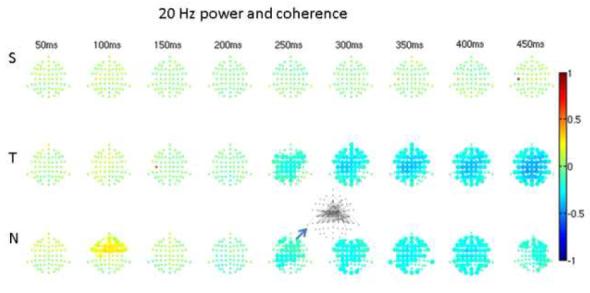
As in Figure 2, but at a center frequency of 20Hz. The only significant change in coherence occurred for novel sounds as increased coherence over widespread frontal areas at 200-300ms poststimulus. Note that during the same interval there was a concomitant decrease in band power.
To summarize, low frequency resolution analyses revealed widespread synchronization over frontal areas that was greatest for novel sounds and least for standard tones at early (< 200ms) latencies while at later times (>200 ms) widespread frontal synchronization occurred only for novel sounds. There was no evidence of cross-frequency phase coupling.
High frequency resolution analysis (2.2Hz frequency resolution, 448ms intervals, 224ms overlap)
Significant differences were determined by comparisons between stimulus types. At the lowest frequency of approximately 2.2Hz (Figure 4), novel and target power were higher than that of the standard. The largest differences (∼500%) occurred for novel vs. standard at 224ms (i.e. 0-448ms). Generally, less pronounced differences were found with increasing post-stimulus time. Novel power was greater than target power over frontal regions at 224 ms while it was less than target power over posterior regions at 448ms (i.e. 326-570ms). Coherence was significantly greater for target than standard across predominantly posterior regions over the entire post-stimulus interval. At 224ms, coherence was greater for the novel than standard across the entire scalp, while coherence was greater for the novel than target over most of the scalp except occipital regions.
4. 2.2Hz power and coherence.
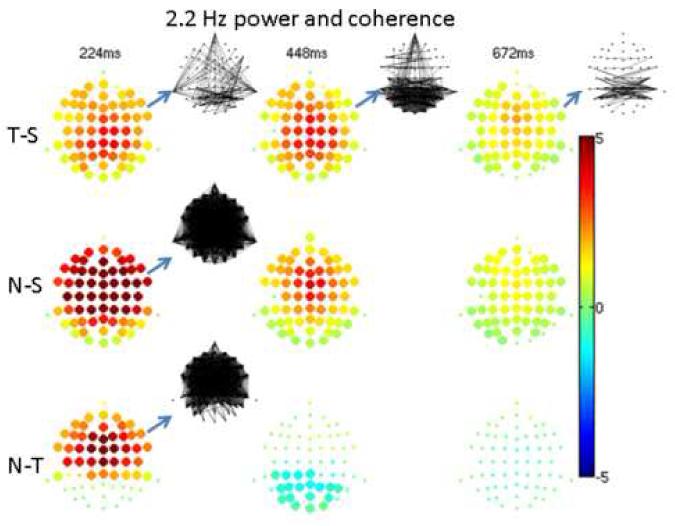
High frequency resolution (2.2Hz bandwidth) analysis at the lowest frequency of 2.2Hz. The fractional difference in power between conditions in overlapping 448ms windows is shown by balls at the scalp electrode locations with fractional values shown in color. Large ball sizes denote significant differences. At the blue arrows, significant differences in coherence are shown by lines connecting electrode locations, with positive differences shown by black lines (no significant negative differences occurred). Differences were taken as target minus standard (denoted T-S), novel minus standard (N-S), and novel minus target (N-T). In determining significance, p-values were corrected for multiple comparisons with a false discovery rate of 0.05.
At 4.5Hz (Figure 5), power differences were similar to those at 2.2Hz except there were fewer significant differences at longer latencies. Target vs. standard coherence differences were similar to those at 2.2Hz, whereas the novel produced significantly greater coherence than the standard for all post-stimulus intervals. These included widespread posterior coherence at 448ms when concomitant power differences were modest. There was no significant coherence difference between novel and target. At 6.7Hz (not shown) novel and target power were greater than that of the standard over fronto-central regions at 224ms; there were no significant coherence differences. At 9.0Hz (not shown) there was a modest target-standard contrast at 224ms over orbito-frontal regions and a widespread novel-standard difference (standard > novel) at 448ms over frontal regions; there were no significant coherence contrasts. In higher frequency bands, power and coherence contrasts failed to meet the false discovery rate criterion of 0.05.
5. 4.5 Hz power and coherence.
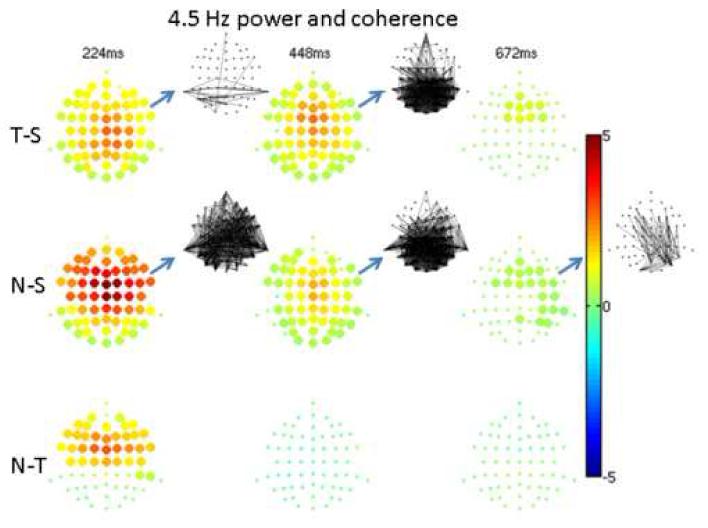
As in Figure 4, but at 4.5Hz.
Bicoherence and cross-bicoherence were significantly different between stimulus types only at 224 ms (0-448ms) for novel-standard (but not for target-standard or novel-target) in two frequency couplings: 1:3 phase locking (2.2Hz to 6.7Hz, Figure 6, and 1:4 phase locking (2.2Hz to 9.0Hz, Figure 7). In both cases, bicoherence (Figures 6A and 7A, respectively) was widespread over the head but showed the largest coupling effects (∼0.1) over central and parietal regions with a rightward bias. The region showing the largest 1:4 phase locking (delta:alpha) was slightly more posterior than the region showing the largest 1:3 phase locking (delta:theta). Matrices of cross-bicoherence for the corresponding cases (Figures 6B and 7B) have a sparse columnar structure, showing that the higher frequency (6.7Hz or 9.0Hz) within a localized region (central-parietal or posterior-right-central-parietal, respectively) was phase-coupled to the lower frequency (2.2Hz) over the entire head (insets in Figures 6B and 7B). Note that 4.5Hz showed significant within-frequency synchronization (power and coherence) differences between conditions (Figure 5) yet this frequency did not couple to other frequencies, illustrating that synchrony and nonlinear coupling are distinct mechanisms.
6. 1:3 phase locking. Delta:theta bicoherence (A) and cross-bicoherence (B) differences at 0-450ms.
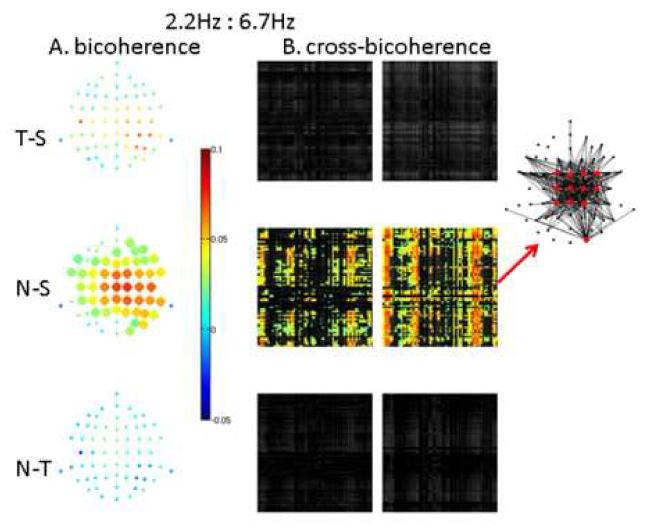
A. Difference in 1:3 phase locking (bicoherence between 2.2 and ∼6.7 Hz) is shown by balls at all electrode locations, with difference values shown in color. Large ball sizes denote significant differences. As in Figures 4 and 5, T-S denotes target minus standard, N-S denotes novel minus standard, and N-T denotes novel minus target. In determining significance, p-values were corrected for multiple comparisons with a false discovery rate of 0.05. B. Difference in cross-electrode 1:3 phase locking (cross-bicoherence between 2.2 and ∼6.7Hz) is shown for all electrode pairs by 62x62 (electrode by electrode) matrices, with 2.2Hz in the row electrode, 6.7Hz in the column electrode, and the sum frequency in the row electrode (left) or column electrode (right). Significant differences are shown in color with the same color scale as in A. In determining significance, p-values were corrected for multiple comparisons with a false discovery rate of 0.05. The columnar structure of the cross-bicoherence matrices shows that theta (6.7Hz) oscillations at a discreet set of locations (predominantly central and parietal regions) couple to a global delta (2.2Hz) oscillation. At the red arrows, the topography of cross-bicoherence is illustrated by lines connecting electrode locations for pairs involving the 12 electrodes (red) with the highest pairwise mean differences.
7. 1:4 phase locking. Delta:alpha bicoherence (A) and cross-bicoherence (B) differences at 0-450ms.
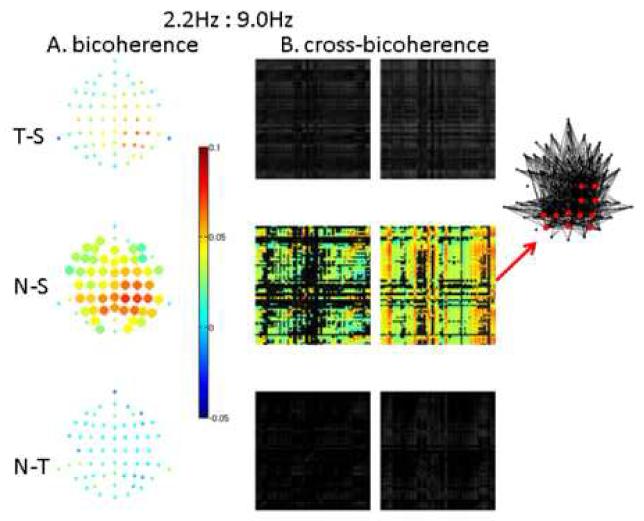
As in Figure 6, but for 1:4 phase locking (bicoherence and cross-bicoherence between 2.2 and 9.0Hz). In B, 9.0Hz is in the column electrode and 2.2Hz is in the row electrode . Note in A that the distribution of bicoherence differences is more posterior than in Figure 6A, while in B localized alpha (9.0Hz) oscillations, predominantly in posterior and right central and parietal regions, couple to a global delta (2.2Hz) oscillation.
To summarize, high frequency resolution analyses revealed widespread synchronization contrasts across all three conditions, primarily in the delta and theta bands, with the greatest differences for the novel-standard comparison. Further, for the novel-standard comparison, there was evidence of widespread cross-frequency phase coupling of delta:theta and delta:alpha rhythms, with globally distributed delta oscillations phase coupled to more localized theta and alpha oscillations in central and right parietal/posterior regions, respectively.
3. Discussion
We hypothesized that cross-frequency phase coupling of electric field potential oscillations would occur for novel environmental sounds but not for target and standard tones in an auditory novelty oddball experiment. In support of our hypothesis, there was widespread coupling of delta:theta and delta:alpha rhythms for novel sounds compared to standard tones, but no significant coupling was observed for targets compared to standards. The lack of coupling in the latter case suggests that cross-frequency phase coupling is a neural mechanism underlying the orienting response because target tones, unlike novel environmental sounds, do not elicit the orienting response (reflected in its neural correlate, the frontally-biased P3a).
As noted in the Introduction, there is recent evidence that different frequency bands of field potential oscillations correlate with different cognitive functions, albeit with the caveat that the mapping from function to frequency may not be unique and may be dynamically and spatially variable. The findings presented here are in accord with this emerging view of functionally distinct roles for oscillations in electric field potential. When a novel sound is heard, arousal and attention are heightened and memory and sensory networks are engaged to determine identity. The phase coupling between field potential oscillations observed in this study could provide a mechanism for the coordination of these activities across specialized networks.
Complementary analysis windows were used for high temporal or frequency resolution, suitable for the FFT-based methods used here. At high temporal resolution, frequency resolution was too poor (10Hz) to capture significant changes in phase coupling between frequencies (bicoherence and cross-bicoherence). This is perhaps not surprising, since putatively distinct network oscillations (e.g. theta and alpha) would be merged into one frequency band. Similarly, delta band phase could not be resolved (occurring in the DC frequency bin) so phase coupling between delta and other frequencies could not be measured. In contrast, changes in synchronization (power and coherence) were significant at high temporal resolution. In support of our expectation and previous ERP studies, synchronization increases were greatest for novel sounds, lesser for targets, and lesser still for standard tones. Interestingly, power and coherence at 10 and 20 Hz distinguished the three stimulus types at early latencies (50-150ms), much earlier than the prominent P3a and P3b components at approximately 300ms. Indeed, targets and novels produced decreased power at longer latencies. What distinguished novel sounds from both target and standard tones at approximately 300ms was widespread 10 and 20 Hz coherence across frontal regions. These results demonstrate the value of frequencydomain analysis compared to traditional time-domain (ERP) analysis, as mentioned in the Introduction, viz., frequency domain measures directly quantify known neural mechanisms such as synchronization and cross-frequency coupling of field potential oscillations (Isler et al., 2007).
At high frequency resolution, temporal resolution is too low (448ms) to allow for a comparison with a pre-stimulus interval in these data. However, comparisons could be made between stimulus types with sufficient frequency resolution to measure phase in the delta band and dissociate theta and alpha rhythms. As expected, novels elicited a more frontal pattern of synchronization than targets (N-T in Figures 4 and 5). Furthermore, in support of our phase coupling hypothesis, bicoherence and cross-bicoherence analyses revealed significantly greater delta:theta and delta:alpha phase coupling for novel sounds compared to standard tones. Phase coupling (bicoherence) contrasts were widespread with largest magnitudes over central and right parietal areas for delta:theta coupling (Figure 6A) but over right central, parietal and posterior areas for delta:alpha coupling (Figure 7A). Cross-regional phase coupling (cross-bicoherence) contrasts revealed a global (i.e. over the entire scalp) delta oscillation coupling to theta (Figure 6B) and alpha (Figure 7B) oscillations localized to central and right parietal/posterior regions, respectively. This coupling suggests a mechanism whereby a cognitive property of the global network (e.g., arousal) affects processing in more localized and specialized networks, though it is impossible in the present study to associate specific cognitive correlates to the observed delta:theta and delta:alpha coupling. Interestingly, the narrow 4.5Hz band (high delta/low theta) does not participate in any significant phase coupling with other bands despite its robust synchronization response in power and coherence. These findings support the view that the distinct frequency bands serving cognitive functions can be quite narrow (Buzsaki and Draguhn, 2004). This is of importance because a narrow band would allow for more precise and reliable phase encoding.
Taken together, the two time-frequency analyses complement each other. High temporal resolution analysis revealed widespread but transient synchronization that persisted longest in response to novelty, while low temporal resolution analysis revealed phase coupling of brain rhythms that was narrow-band frequency specific and topographically differentiated. However, it should be noted that care must be taken when comparing results across the two time-frequency analyses. For example, there are only modest alpha power contrasts in the high frequency resolution (448 ms window) analysis while there are large changes in alpha power and coherence in the low frequency resolution (100 ms window) analysis. The 448ms analysis assesses differences between stimulus types and is most sensitive to narrow band activity that persists for several hundred milliseconds. The 100 ms analysis measures a change from pre-stimulus levels for a given stimulus type and is better able to detect broad band transient (<∼100 ms) activity. Indeed, it can be seen in the latter case (Figure 2) that alpha power and coherence vary considerably across the first 500 ms, with initial power increases for novels and targets followed by decreased power. This variability could account for the lack of significant contrast in alpha power between stimulus types across a 448 ms window. It should also be noted that the lack of significant synchrony and coupling involving gamma band frequencies may have more to do with the difficulty of observing that band in adult scalp data than in the absence of such synchrony and coupling per se. Finally, bivariate measures (coherence and cross-bicoherence) can be biased by volume conduction when nearby electrodes have overlapping source regions. As mentioned in the Experimental procedure section below, evaluation of differences removes baseline bias. However, if power (or bicoherence) changes from its baseline level (or between conditions), that change will confound changes in coherence (or cross-bicoherence) because the area of overlapping source regions will increase. However, the coherence and cross-bicoherence results presented here include many pairs of distant electrodes, making volume conduction an unlikely explanation of the effect for these numerous distant pairs.
In summary, the results presented here suggest that cross-frequency phase coupling, specifically delta oscillations synchronized globally and phase coupled to more localized higher frequency oscillations, is a neural mechanism underlying the brain’s orienting response. This mechanism links globally distributed but localized theta and alpha oscillations without the necessity for global synchrony in those bands. Through phase coupling, information encoded locally in the phase of the higher frequency oscillation is preserved across cycles of the global delta oscillation, providing a mechanism for multiplexing the phase encoding of single neurons or clusters of functional neuronal columns. We speculate that this mechanism could be the substrate for the cooperative interaction of the multiple networks engaged in processing and identifying novelty.
4. Experimental procedure
Subjects
The subjects were 13 normal right-handed older adults (5 male) aged 54 to 83 (mean 72) who provided informed consent in accord with the Institutional Review Board at the New York State Psychiatric Institute. This was a secondary analysis of a dataset studying aging. We used this dataset because it offered sufficient power to test our hypotheses and not as a study of aging per se.
Protocol, recording, pre-processing
Subjects were seated in a sound-damped, electrically-shielded room. Sound trains were presented in 10 blocks (80 trials per block) and consisted of frequent, standard (p = 0.8) infrequent, target tones (p = 0.1) and 48 novel, environmental sounds (p = 0.1). The tones were 700 and 1000 Hz (counterbalanced between target and standard across subjects). Sounds were presented via headphones at approximately 80dB sound pressure level at the subject’s ears. The inter-stimulus-interval was 1s. Subjects were instructed to press a response button (emphasizing speed) only to the target tone. EEG was recorded with sintered Ag/AgCl electrodes mounted in an elastic cap (Neuromedical Supplies) from 62 scalp sites in accordance with the extended 10-20 system. Vertical electrooculogram (EOG) was recorded from electrodes placed above and below the left eye and horizontal EOG from electrodes placed at the outer canthus of each eye. Electrode impedance was kept below 5kOhm. The activity at all scalp electrodes was recorded referenced to the nosetip and re-referenced offline to averaged mastoids. EEG and EOG were recorded continuously with Synamp amplifiers (0-100Hz; 500 Hz digitization). Trials were segmented into 100ms pre- and 900ms post-stimulus intervals. Muscular and other artifact was rejected by visual inspection on a trial by trial basis. If single channels showed artifacts, up to 3 channels on a given trial were rebuilt by spherical spline interpolation (Perrin et al., 1987). Blinks and horizontal eye movements were corrected (Gratton et al., 1983).
Data analysis
Because of time-frequency tradeoffs, frequency domain analyses were performed twice. Low frequency resolution analysis used overlapping 100ms intervals and comparisons were made to the pre-stimulus interval. High frequency resolution analysis used three 448ms intervals (with 50% overlap) and comparisons were made between stimulus types (i.e. standards, targets, novels). The number of standard trials used in both analyses was reduced to be approximately the same as the other stimuli (by taking the first 1/8) to avoid confounding statistical effects in comparisons between stimulus types. Averaged waveforms were computed as the mean voltage across trials at each electrode with the removal of the mean voltage over the 100ms pre-stimulus interval.
Synchronization of oscillations within a frequency band was quantified by power and coherence. Transmembrane currents due to EPSP/IPSP activity produce the electric field recorded on the scalp (Nunez, 1981); thus power at a single electrode quantifies the degree of synchronized input in the underlying cortical region. Coherence between pairs of electrodes was used to quantify the degree of synchrony between the corresponding regions, albeit biased by volume conduction effects dependent on inter-electrode distance (Srinivasan et al., 1998). This baseline bias is removed when coherence differences are taken, as in this study, though changes from baseline power confound coherence differences except for distant pairs of electrodes. Fast Fourier transforms (FFTs) were taken for each interval after de-meaning and application of a Hanning window (Bendat and Piersol, 2000). Power spectra were the magnitude-squared FFTs averaged across trials (the numerator of equation 1 (below) with i = j). Cross spectra were calculated by averaging the product of one channel FFT with the complex conjugate FFT of another channel for all possible pairs (i,j) of channels across trials; coherence, Cij(f), was defined as the magnitude of the cross spectrum normalized by the square root of the product of the channel powers (Bendat and Piersol, 2000), viz.
| (1) |
where Xi(f) and Xj(f) are the frequency(f)-dependent complex Fourier transforms of the two time(t) series xi(t) and xj(t) and the brackets represent an expectation value.
Coupling of oscillations across frequency bands was quantified by bicoherence and cross-bicoherence. Bicoherence measures the degree of quadratic phase coupling between frequencies in a single time series; cross-bicoherence measures quadratic phase coupling between frequencies across two times series. Quadratic phase coupling occurs as a result of nonlinear (second-order) interactions between oscillators which give rise to sum frequencies. It is expressed as
| (2) |
which requires both f3 = f1 + f2 and φ3 = φ1 + φ2; in other words not only is a sum frequency present but its phase (φ) is not randomly distributed with respect to the other phases. Bicoherence was calculated using the product of the FFT at two different frequencies times the complex conjugate of the FFT at the sum of the two frequencies, normalized by the product of FFTs at the three frequencies(equation 3 below, with i = j) (Nikias and Petropulu, 1993). Cross-bicoherence, Bij(f1,f2), between electrode pairs (i,j) was calculated using the product of the FFT at two different frequencies (f1,f2) and electrodes multiplied by the complex conjugate of the FFT at the sum of the two frequencies at one of the electrodes, normalized by the product of FFTs at the three frequencies, viz.
| (3) |
The cross-bicoherence for a pair of frequencies is thus represented by two electrode by electrode matrices: one where the sum frequency is detected in the row electrode and one where it is in the column electrode.
Subsequently, change scores were either the difference taken against a baseline interval in the low-frequency resolution analysis or the difference between conditions in the highfrequency resolution analysis. Fractional differences were used for power. Group statistics (mean, standard error) were calculated for all change scores and t-tests were used to determine significance for each electrode (for power and bicoherence) or pair of electrodes (for coherence and cross-bicoherence). To correct for multiple comparisons across electrodes (or across all electrode pairs for coherence and cross-bicoherence), a false discovery rate of 0.05 was used (Genovese et al., 2002). It is important to note that all phase-dependent measures (i.e. coherence, bicoherence, and cross-bicoherence, but not power spectra) are ill-defined for the lowest (DC) frequency and so results are not presented at those frequencies.
Acknowledgements
National Institutes of Health (NINDS 5K25NS052230 to J.I., NIA AG005213 to D.F.) Corresponding author: Joseph R. Isler, Department of Pediatrics, Columbia University, P&S 3-440, 630 W. 168th St, New York, NY 10032, 212-342-4151; fax 212-305-0956, jri2101@columbia.edu.
Footnotes
Publisher's Disclaimer: This is a PDF file of an unedited manuscript that has been accepted for publication. As a service to our customers we are providing this early version of the manuscript. The manuscript will undergo copyediting, typesetting, and review of the resulting proof before it is published in its final citable form. Please note that during the production process errors may be discovered which could affect the content, and all legal disclaimers that apply to the journal pertain.
Classification terms
Section: Cognitive and behavioral neuroscience
References
- Bendat JS, Piersol AG. Random data : analysis and measurement procedures. Wiley; New York: 2000. [Google Scholar]
- Bertrand O, Tallon-Baudry C. Oscillatory gamma activity in humans: a possible role for object representation. Int J Psychophysiol. 2000;38:211–23. doi: 10.1016/s0167-8760(00)00166-5. [DOI] [PubMed] [Google Scholar]
- Buzsaki G, Draguhn A. Neuronal oscillations in cortical networks. Science. 2004;304:1926–9. doi: 10.1126/science.1099745. [DOI] [PubMed] [Google Scholar]
- Canolty RT, Edwards E, Dalal SS, Soltani M, Nagarajan SS, Kirsch HE, Berger MS, Barbaro NM, Knight RT. High gamma power is phase-locked to theta oscillations in human neocortex. Science. 2006;313:1626–8. doi: 10.1126/science.1128115. [DOI] [PMC free article] [PubMed] [Google Scholar]
- Friedman D, Cycowicz YM, Gaeta H. The novelty P3: an event-related brain potential (ERP) sign of the brain’s evaluation of novelty. Neurosci Biobehav Rev. 2001;25:355–73. doi: 10.1016/s0149-7634(01)00019-7. [DOI] [PubMed] [Google Scholar]
- Genovese CR, Lazar NA, Nichols T. Thresholding of statistical maps in functional neuroimaging using the false discovery rate. Neuroimage. 2002;15:870–8. doi: 10.1006/nimg.2001.1037. [DOI] [PubMed] [Google Scholar]
- Gloveli T, Dugladze T, Rotstein HG, Traub RD, Monyer H, Heinemann U, Whittington MA, Kopell NJ. Orthogonal arrangement of rhythm-generating microcircuits in the hippocampus. Proc Natl Acad Sci U S A. 2005;102:13295–300. doi: 10.1073/pnas.0506259102. [DOI] [PMC free article] [PubMed] [Google Scholar]
- Golding NL, Staff NP, Spruston N. Dendritic spikes as a mechanism for cooperative long-term potentiation. Nature. 2002;418:326–31. doi: 10.1038/nature00854. [DOI] [PubMed] [Google Scholar]
- Gratton G, Coles MG, Donchin E. A new method for off-line removal of ocular artifact. Electroencephalogr Clin Neurophysiol. 1983;55:468–84. doi: 10.1016/0013-4694(83)90135-9. [DOI] [PubMed] [Google Scholar]
- Gray CM, Konig P, Engel AK, Singer W. Oscillatory responses in cat visual cortex exhibit inter-columnar synchronization which reflects global stimulus properties. Nature. 1989;338:334–7. doi: 10.1038/338334a0. [DOI] [PubMed] [Google Scholar]
- Isler JR, Grose-Fifer J, Fifer WP, Housman S, Stark RI, Grieve PG. Frequency Domain Analyses of Neonatal Flash VEP. Pediatr Res. 2007;62:581–5. doi: 10.1203/PDR.0b013e31815586a1. [DOI] [PubMed] [Google Scholar]
- Jensen O, Colgin LL. Cross-frequency coupling between neuronal oscillations. Trends in Cognitive Sciences. 2007;11:267–269. doi: 10.1016/j.tics.2007.05.003. [DOI] [PubMed] [Google Scholar]
- Kahana MJ, Seelig D, Madsen JR. Theta returns. Curr Opin Neurobiol. 2001;11:739–44. doi: 10.1016/s0959-4388(01)00278-1. [DOI] [PubMed] [Google Scholar]
- Lachaux JP, Rodriguez E, Martinerie J, Adam C, Hasboun D, Varela FJ. A quantitative study of gamma-band activity in human intracranial recordings triggered by visual stimuli. Eur J Neurosci. 2000;12:2608–22. doi: 10.1046/j.1460-9568.2000.00163.x. [DOI] [PubMed] [Google Scholar]
- Lakatos P, Shah AS, Knuth KH, Ulbert I, Karmos G, Schroeder CE. An oscillatory hierarchy controlling neuronal excitability and stimulus processing in the auditory cortex. J Neurophysiol. 2005;94:1904–11. doi: 10.1152/jn.00263.2005. [DOI] [PubMed] [Google Scholar]
- Luria AR. The Working Brain. Basic Books; New York: 1973. [Google Scholar]
- Nikias CL, Petropulu AP. Higher-order spectra analysis : a nonlinear signal processing framework. PTR Prentice Hall; Englewood Cliffs, N.J.: 1993. [Google Scholar]
- Nunez PL. Electric Fields and the Brain. Oxford University Press; New York: 1981. [Google Scholar]
- O’Keefe J, Recce ML. Phase relationship between hippocampal place units and the EEG theta rhythm. Hippocampus. 1993;3:317–30. doi: 10.1002/hipo.450030307. [DOI] [PubMed] [Google Scholar]
- Palva JM, Palva S, Kaila K. Phase synchrony among neuronal oscillations in the human cortex. J Neurosci. 2005;25:3962–72. doi: 10.1523/JNEUROSCI.4250-04.2005. [DOI] [PMC free article] [PubMed] [Google Scholar]
- Palva S, Palva JM. New vistas for alpha-frequency band oscillations. Trends Neurosci. 2007;30:150–8. doi: 10.1016/j.tins.2007.02.001. [DOI] [PubMed] [Google Scholar]
- Perrin F, Pernier J, Bertrand O, Giard MH, Echallier JF. Mapping of scalp potentials by surface spline interpolation. Electroencephalogr Clin Neurophysiol. 1987;66:75–81. doi: 10.1016/0013-4694(87)90141-6. [DOI] [PubMed] [Google Scholar]
- Pfurtscheller G, Flotzinger D, Neuper C. Differentiation between finger, toe and tongue movement in man based on 40 Hz EEG. Electroencephalogr Clin Neurophysiol. 1994;90:456–60. doi: 10.1016/0013-4694(94)90137-6. [DOI] [PubMed] [Google Scholar]
- Pfurtscheller G, Andrew C. Event-Related changes of band power and coherence: methodology and interpretation. J Clin Neurophysiol. 1999;16:512–9. doi: 10.1097/00004691-199911000-00003. [DOI] [PubMed] [Google Scholar]
- Ranganath C, Rainer G. Neural mechanisms for detecting and remembering novel events. Nat Rev Neurosci. 2003;4:193–202. doi: 10.1038/nrn1052. [DOI] [PubMed] [Google Scholar]
- Rodriguez E, George N, Lachaux JP, Martinerie J, Renault B, Varela FJ. Perception’s shadow: long-distance synchronization of human brain activity. Nature. 1999;397:430–3. doi: 10.1038/17120. [DOI] [PubMed] [Google Scholar]
- Schack B, Vath N, Petsche H, Geissler HG, Moller E. Phase-coupling of theta-gamma EEG rhythms during short-term memory processing. Int J Psychophysiol. 2002;44:143–63. doi: 10.1016/s0167-8760(01)00199-4. [DOI] [PubMed] [Google Scholar]
- Sokolov EN. The orienting response, and future directions of its development. Pavlov ianJournal of Biological Science. 1990;25:142–50. doi: 10.1007/BF02974268. [DOI] [PubMed] [Google Scholar]
- Srinivasan R, Nunez PL, Silberstein RB. Spatial filtering and neocortical dynamics: estimates of EEG coherence. IEEE Trans Biomed Eng. 1998;45:814–26. doi: 10.1109/10.686789. [DOI] [PubMed] [Google Scholar]
- Tallon-Baudry C, Bertrand O, Delpuech C, Pernier J. Stimulus specificity of phase-locked and non-phase-locked 40 Hz visual responses in human. J Neurosci. 1996;16:4240–9. doi: 10.1523/JNEUROSCI.16-13-04240.1996. [DOI] [PMC free article] [PubMed] [Google Scholar]
- Varela F, Lachaux JP, Rodriguez E, Martinerie J. The brainweb: phase synchronization and large-scale integration. Nat Rev Neurosci. 2001;2:229–39. doi: 10.1038/35067550. [DOI] [PubMed] [Google Scholar]
- von Stein A, Chiang C, Konig P. Top-down processing mediated by interareal synchronization. Proc Natl Acad Sci U S A. 2000;97:14748–53. doi: 10.1073/pnas.97.26.14748. [DOI] [PMC free article] [PubMed] [Google Scholar]