

Abstract
There is a fast growing interest in noncoding RNA transcripts. These transcripts are not translated into proteins, but play essential roles in many cellular and pathological processes. Recent efforts toward comprehension of their function has led to a substantial increase in both the number and the size of solved RNA structures. With the aim of addressing questions relating to RNA structural diversity, we examined RNA conservation at three structural levels: primary, secondary, and tertiary structure. Additionally, we developed an automated method for classifying RNA structures based on spatial (three-dimensional [3D]) similarity. Applying the method to all solved RNA structures resulted in a classified database of RNA tertiary structures (DARTS). DARTS embodies 1333 solved RNA structures classified into 94 clusters. The classification is hierarchical, reflecting the structural relationship between and within clusters. We also developed an application for searching DARTS with a new structure. The search is fast and its performance was successfully tested on all solved RNA structures since the creation of DARTS. A user-friendly interface for both the database and the search application is available online. We show intracluster and intercluster similarities in DARTS and demonstrate the usefulness of the search application. The analysis reveals the current structural repertoire of RNA and exposes common global folds and local tertiary motifs. Further study of these conserved substructures may suggest possible RNA domains and building blocks. This should be beneficial for structure prediction and for gaining insights into structure–function relationships.
Keywords: noncoding RNA, structural classification of RNA, alignment of RNA tertiary (3D) structures, 3D database search, edit distance of RNA secondary (2D) structures, RNA sequence comparison
INTRODUCTION
The function of most noncoding RNA molecules has yet to be discovered. Nevertheless, much like proteins, a good starting point for elucidating the function of a noncoding RNA is by searching databases for similar RNA molecules of known function. For this purpose, many databases of noncoding RNA sequences have been proposed. The databases are either general, such as NONCODE (Liu et al. 2005) and fRNAdb (Kin et al. 2007), or specialized, such as RNAdb (Pang et al. 2005), miRBase (Griffiths-Jones et al. 2006), and ASRP (Gustafson et al. 2005). For some databases the search is carried out solely by keywords or accession codes. Other databases apply sequence alignment methods. However, since the RNA alphabet is smaller and less informative compared with the protein alphabet, using standard primary sequence alignment methods for RNA are not as powerful as they are for proteins.
Many methods have been proposed for improving the quality of RNA sequence alignment. These methods implicitly predict or incorporate base-pairing information into their sequence alignments. The rationale is that the secondary (two-dimensional [2D]) structure of RNA is usually much more conserved during evolution than the primary structure per se. Therefore, sequence alignment may be of high quality when the primary structure is conserved, but might be less accurate as the evolutionary distance increases. One approach for improvement is to create an initial sequence alignment that is subsequently corrected based on known 2D structure constraints. The correction is either carried out manually or by using RNA alignment editors, such as ConStruct (Lück et al. 1999) and RALEE (Griffiths-Jones 2005). A second approach aims to align RNA sequences when the secondary structure of one of them is known. RAGA is an example of such a method (Notredame et al. 1997). Another approach, which is adopted by most methods, is based on the Sankoff algorithm (Sankoff 1985). In this approach, 2D folding and alignment of RNA sequences are carried out simultaneously. The basic Sankoff algorithm is computationally expensive in terms of both time and space. Therefore, for practical applications, various pragmatic restrictions are employed. For example, FOLDALIGN is a restriction of the Sankoff algorithm that finds for a pair of RNA sequences the alignment of the maximal number of common nested base pairs (Havgaard et al. 2005). Other examples include Dynalign (Mathews and Turner 2002), PMcomp/PMmulti (Hofacker et al. 2004), and Stemloc (Holmes 2005). Benchmarks between different methods for RNA sequence alignment can be found in Gardner et al. (2005) and Wilm et al. (2006).
Many of the RNA sequence alignment tools have been designed to work with multiple sequences instead of only a pair. The aim is to provide insights into the consensus secondary structure of an RNA family. Rfam is an example of a database of noncoding RNA families represented by multiple sequence alignments and statistical models called profile stochastic context-free grammars (Griffiths-Jones et al. 2005).
A different strategy for comparing RNA molecules given their sequences is to predict the consensus 2D structure without knowing or finding the alignment of the sequences. For example, RNAcast is a method that predicts an abstract shape common to the input sequences. It also provides for each sequence the thermodynamically best 2D structure that has the common shape (Reeder and Giegerich 2005). Another example is the genetic algorithm described by Chen et al. (2000).
Apart from sequence comparison methods, there are also methods for comparing secondary structures of RNA. These methods assume that the 2D structures of the RNA molecules to be examined are known in advance and look for the optimal alignment of the 2D structures. Most methods, like RNAdistance (Hofacker 2003), coarsely represent an RNA secondary structure by a tree-based model and compare the input structures by the tree edit distance. RNAforester is another method that applies tree-editing, but on a more general forest model, which results in an improvement in both time and space (Höchsmann et al. 2003). However, an inherent limitation of all methods that model an RNA as a tree or a forest is the inability to consider tertiary interactions, like pseudoknots. Such interactions are formed between secondary structure elements and are often essential for correct folding (Batey et al. 1999; Moore 1999). Currently, the general problem of aligning RNA secondary structures while considering tertiary interactions is only partially addressed by methods like rna_align (Lin et al. 2001), which allows only one of the input structures to contain pseudoknots.
In recent years, both the number and the size of solved RNA tertiary (three-dimensional [3D]) structures have dramatically increased. To date, there are over a thousand RNA structures in either the NDB (Berman et al. 2002) or the PDB (Berman et al. 2000), with over a third of these of size greater than 50 nucleotides (nt). This continuous growth has led to the emergence of computational methods for 3D structural analysis of RNA (Duarte and Pyle 1998; Lu and Olson 1999; Lu et al. 1999; Gendron et al. 2001; Yang et al. 2003; Lu and Olson 2003). Other methods have been developed for measuring the similarity between equally sized RNA structures with a predefined correspondence, like in the case of different conformations of the same RNA molecule (Reijmers et al. 2001; Duarte et al. 2003; Huang et al. 2005). Additional methods locate small predefined motifs in larger structures and, as such, are useful for finding new occurrences of known motifs (Duarte et al. 2003; Harrison et al. 2003; Sarver et al. 2007). The more complicated problem of finding a priori unknown common substructures is partially addressed by COMPADRES (Wadley and Pyle 2004), DIAL (Ferrè et al. 2007), and the method described by Hershkovitz et al. (2003). The three methods can detect spatially conserved fragments of successive nucleotides. However, many tertiary motifs, like kissing hairpin and packing interactions between helices, though not contiguous, are crucial for RNA folding. Such noncontiguous 3D motifs (as well as global folds) can be detected by ARTS (Dror et al. 2005). This method is currently the only published method that performs a truly spatial search irrespective of the order of the nucleotide chain.
The rapid increase in 3D structural data of RNA has further emphasized the need for 3D structural classification of RNA. To date, there are two databases that try to meet this need: SCOR (Tamura et al. 2004) and RNAbase (Murthy and Rose 2003). Roughly, both databases provide two separate classifications. In the first classification RNA structures are grouped into functional categories, like ribosomal RNA and transfer RNA. The other classification is of small motifs or tertiary interactions, such as tetraloops and tetraloop receptors, sliced out from a larger molecule. An additional database that contains small 3D structural elements of RNA is RNAJunction (Bindewald et al. 2007).
Here, we examine the conservation of RNA at the primary (one-dimensional [1D]), secondary (2D), and tertiary (3D) structural levels. In addition, we present a new database named DARTS, which classifies solved RNA structures. Compared to the other two existing 3D classification databases, SCOR and RNAbase, the classification of DARTS was carried out by a fully automated scheme and the structures are organized in clusters mainly based on their global spatial resemblance, as obtained by ARTS (Dror et al. 2005). The classification is also hierarchical, reflecting the structural relationship within and between clusters. The different clusters as well as intercluster similarities reveal the current fold repertoire of RNA and suggest possible tertiary motifs. In addition, a search tool for comparing a newly determined RNA structure with the ones in DARTS is available to allow users to gain further insights into their structures.
RESULTS
Data enrichment and structural analysis at three levels
The March 2007 release of the PDB (Berman et al. 2000) contained about 1333 high-resolution tertiary structures of RNA (solved by either NMR or X-ray crystallography). The size of the structures ranges from a few to 2889 nt, where most structures (65.8%) are of a size less than 50 nt. This finding, together with a manual exploration of the annotation of the structures, reveals that a large portion of the entries are not complete structures of an RNA molecule or of a functionally annotated domain, but rather small fractions of larger structures. The annotated structures constitute only 31.1% of the data, with the different annotations listed in Table 1.
TABLE 1.
Distribution and clustering of annotated structures

We have performed an all-against-all comparison at three structural levels. The results are 1D, 2D, and 3D identity scores for each pair of RNA structures. The distributions of the scores on pairs of annotated structures have shown that the 3D identity score clearly distinguishes between pairs of the same annotation and pairs of different annotations, while this in not the case for the 1D and 2D identity scores.4 Another observation is that there are pairs of structures of different annotations with 1D, 2D, and 3D identity scores of up to 69%, 97%, and 64% respectively. The high 3D identity scores for structures of different annotations have been obtained for pairs with a very high size ratio,5 where almost all of them are between tRNA and rRNA with a size ratio larger than 10. The high 3D identity scores for such pairs reveal only local similarity between the two structures, but no global similarity. Indeed, the distribution of the scores on pairs of annotated structures with a size ratio of up to 1.5 shows that pairs of different annotations get a 3D identity score of <48% (a zero false-positive threshold). Limiting the size ratio only slightly influences the zero false-positive thresholds for the 1D and 2D identity scores, which are 65% and 95%, respectively. A similar threshold (60%) for the 1D identity score is also reported by Gardner et al. (2005). However, surprisingly, the threshold for the 2D identity score is very high, >90%. Indeed, there are pairs of tertiary structures with different annotations, different folds, and very low sequence identity, but with very similar 2D structures (Fig. 1).
FIGURE 1.

Different 3D structures with similar 2D structures. (A) The secondary structure and the tertiary structure of a 5S rRNA molecule (PDB:1yjw, chain 9). (B) The secondary structure and the tertiary structure of a signal recognition particle (SRP) molecule (PDB:1lng, chain B). The two RNA molecules share very little spatial similarity and have no known function in common. Additionally, their sequence identity score is relatively low (44%). Nevertheless, the two molecules have very similar 2D structures with over 90% identity score. This figure and all subsequent figures containing RNA 3D and 2D structures were prepared using PyMOL (DeLano 2002) and PseudoViewer (Byun and Han 2006), respectively.
The all-against-all comparison has also shown that the data are redundant. Table 2 indicates that only 244 RNA structures (18.3% of the data) remain after removing data members with at least 90% sequence or 3D identity.6 This filtering is used in the first coarse stage of the hierarchical clustering of DARTS for grouping highly identical data members. In the following, we will refer to the resulting set of 244 structures as the representative set of the data. Note that this set is not the smallest set of nonredundant structures, but a coarse representation of the data without highly identical structures. The full extent of the redundancy will be reflected by the different clusters in DARTS and in their inner hierarchy.
TABLE 2.
Sequence versus 3D structure redundancy

We distinguish between two types of highly identical data members: highly identical structures and highly identical fragments. A highly identical structure is a structure that is globally almost identical (with at least 90% sequence or 3D structure identity) to some other structure of similar size (size ratio is between 1 and 3/2). A highly identical fragment is defined as a structure that is almost identical to only a small substructure of a larger structure (size ratio greater than 3/2). The data are redundant with respect to both types. For example, 6.2% and 1.7% of the data are highly identical structures and highly identical fragments of the 23S ribosomal subunit, respectively.
We further assessed the quality of the three structural identity scores for function prediction. This is partially reflected in the zero false-positive thresholds determined as 65%, 95%, and 48% for the 1D, 2D, and 3D identity scores between pairs of structures with a size ratio of 1.5, respectively. Other insights can be obtained from the score histograms on the annotated structures in the representation data set (Fig. 2A–C). The better the identity score differentiates between pairs of the same annotation and pairs of different annotations, the more reliably it can be used as a function predictor. The histograms clearly show that the 3D identity score separates the two groups better than the 2D identity score, and the 2D identity score is better than the sequence identity score. These attributes are also reflected in the receiver operating characteristic (ROC) curves in Figure 2D. A ROC curve is a standard way to assess the performance of a predictor. It plots the true positive (TP) rate of the prediction (sensitivity) as a function of the true negative (TN) rate (1−specificity), while varying the prediction threshold. In our case, the sensitivity and specificity are defined as TP/(TP+FN) and TN/(TN+FP), respectively, where TP and false positive (FP) are the number of correctly and incorrectly predicted pairs of the same annotation, and TN and false negative (FN) are the number of correctly and incorrectly predicted pairs of different annotations. The area under a ROC curve is used to evaluate the performance gains over a random predictor, for which the area is 0.5. The areas under the ROC curves for the 1D, 2D, and 3D structural identity score are 0.64, 0.87, and 0.96, respectively. These results can be attributed to two factors, information and randomness. Specifically, the more information a predictor takes into account, the better its performance. Tertiary structures possess more information than 2D structures, and 2D structures possess more information than sequences. Thus, the performance of the predictors increases from 1D to 3D. Additionally, the reliability of the predictors is influenced by the randomness of the scores. The higher the score achieved by random matching, the lower its reliability. Indeed, this is correlated with the prediction results. The alphabet of RNA sequence is of size four, and thus the identity score that can be achieved by a random sequence alignment is relatively high. A lower identity score is normally achieved by a random 2D structural alignment (the size of the alphabet is three, but the alignment is order dependent), and a very low score is achieved by random 3D structural alignment.
FIGURE 2.

The predictive power of 1D, 2D, and 3D structural alignments. (A–C) The distribution of the identity scores obtained by an all-against-all comparison on a representative set of annotated RNA structures (listed in Table 1) using 1D, 2D, and 3D structural alignment tools. Gray bars indicate the frequency of identity scores obtained for pairs of structures with the same annotation. Black bars indicate the frequency of identity scores obtained for pairs of structures with different annotations. Since only global similarity was examined, the identity scores were calculated only for pairs of structures of a size ratio of 1.5 or less. Structures with multiple chains were also excluded from the analysis, since for these the 1D and 2D identity scores might be influenced by the order of the chains. (D) ROC curves for similar-annotation predictors based on 1D, 2D, and 3D structural identity scores. The curves are represented as circles, triangles and rectangles, respectively. The area under the curves is 0.64, 0.87, and 0.96, respectively.
Database architecture
RNA tertiary structures are organized in disjoint clusters. For each cluster, a dendrogram outlines the hierarchical relationship between the representative structures, where the lengths of the branches stand for the average distance between them. In addition, each representative is assigned with two sets of highly identical structures and highly identical fragments (Fig. 3). Over all, the data set consists of 244 representatives, 606 highly identical structures, and 483 highly identical fragments that are classified into 94 clusters. All the clusters are organized in a dendrogram representing the structural relationship between them, where the lengths of its branches are according to the average distance between the clusters.
FIGURE 3.

(Top) A scheme of a cluster architecture. Each cluster is associated with a set of representative structures. A dendrogram outlines the hierarchical relationship between the representatives. In addition, each representative is assigned with two sets of highly identical structures and highly identical fragments. (Bottom) The architecture of the 5S rRNA cluster. This cluster contains 68 structures of the 5S rRNA and 26 highly identical fragments. In total, the cluster contains 94 structures and is represented by four members. The representative members are organized in a dendrogram, where the lengths of its branches stand for the average distance between them. In addition, each representative is associated with two sets of highly identical structures and highly identical fragments. The size of each set appears in brackets. An RNA structure is denoted by a four-letter PDB ID followed by a chain ID. In cases where the structure consists of all the RNA chains described in the PDB file, the chain IDs are not specified.
Cluster quality.
To evaluate the quality of the clusters, we have examined the classification of the annotated structures listed in Table 1. Ideally, we will have a single cluster for each annotated group of structures, containing its structures and these only. For each cluster we have looked at the annotations of its structures. If some annotation occurred more frequently than in half of the members in the cluster, then the cluster receives this annotation. The structures in the cluster that are not fragments and have an annotation different than the annotation of the cluster are considered as false positives. Structures of some annotation that have not been classified into a cluster of that annotation are considered as false negatives. For 13 out of 18 annotations, all the annotated structures have been clustered into a single cluster with no false positives. For two additional annotations (tRNA and Guanine riboswitch), the annotated structures have been clustered into a single cluster with either two false negatives or one false positive, respectively. No unique cluster has been determined for the three remaining annotations, where each of them has only a single representative or two highly identical structures. The success rate of the clustering is calculated as the fraction of the annotated structures that are neither false positives nor false negatives out of the total number of annotated structures. The evaluation results are summarized in Table 1. Below, we present some examples for clusters of interest followed by intercluster similarities.
Self-splicing group I introns
Phylogenetic studies of many self-splicing group I introns have revealed a conserved secondary structure core consisting of nine paired regions (P1–P9) (Golden et al. 1998). These helical regions fold to three domains: P1–P2, P4–P6, and P3–P9. The P1–P2 domain contains the 5′ splice site, while the catalytic site of the enzyme lies between the other two domains. The guanosine binding site is located in the P3–P9 domain.
Twelve nonfragment tertiary structures of self-splicing group I introns are available. Three structures are of complete introns with their exons, six structures are of complete introns without the exons, and three structures are of the P4–P6 domain only. The size of the structures ranges from 156 to 246 nt. All the 12 structures have been classified into one cluster, which consists of these structures only. The cluster is represented by four members, one of which contains only the P4–P6 domain. Aligning all four representative structures resulted in a conserved substructure that is naturally restricted to the P4–P6 domain. This common substructure consists of 15 nt that center near the contact area with the P3–P9 domain (nucleotides 110–112, 213–218, 221–223, and 251–253 in PDB:1x8w chain B). In this contact area the catalytic site is located.
The three complete representative structures belong to different organisms and to different catalytic states, depending on the number of chemical reactions they went through. Nevertheless, they share a 3D substructure of 65 nt (Fig. 4). This common substructure contains half of the contact area of the P4–P6 and P3–P9 domains in which the catalytic site is located. Furthermore, it includes a triple helix of four base triplets, which constitutes the guanosine binding site.
FIGURE 4.

Self-splicing group I introns. (A) Conserved substructure among the three complete representative structures of self-splicing group I introns. The alignment was generated by setting one structure (PDB:1x8w chain B) as a pivot and aligning the other two structures (PDB:1y0q and PDB:1zzn) to it. The pivot is colored gray and is fully displayed. For the other two structures, only the structurally conserved nucleotides are shown and are depicted in green and red, respectively. The conserved substructure contains half of the contact area of the P4–P6 and P3–P9 domains in which the catalytic site is located. Furthermore, it contains a triple helix of four base triplets, which constitutes the guanosine binding site (zoom in). (B) The P4–P6 (blue) and the P3–P9 (cyan) domains of the pivot structure in A.
Transfer RNA (tRNA)
The secondary structure of a tRNA has a cloverleaf representation with four arms known as the acceptor stem, the T stem–loop, the anticodon stem–loop, and the D stem–loop. The typical tertiary structure of a tRNA has an L-shape consisting of two domains, the aminoacylation domain and the anticodon domain. The two domains are nearly spatially perpendicular and have no crossing interactions (Fig. 5A,B).
FIGURE 5.

Transfer RNA (tRNA). (A) The cloverleaf secondary structure of a tRNA consists of four arms (clockwise): the acceptor stem (upper), the T stem–loop, the anticodon stem–loop, and the D stem–loop. These arms fold into an L-shape tertiary structure with two domains: the aminoacylation domain (containing the acceptor stem and the T stem–loop) and the anticodon domain (containing the anticodon stem–loop and the D stem–loop). The two domains are colored in green and red, respectively. (B) An L-shaped tertiary structure of a tRNA (PDB: 2dr2 chain B) is presented. Its two domains are colored as in A. (C) In the upper portion of the figure a canonical shaped tRNA (PDB:2dr2, chain B, colored gray) is displayed. The 14 spatially conserved nucleotides, which are common to all 27 representative structures of the tRNA cluster, are highlighted in cyan. In the lower portion of the figure three representative tRNA structures with slight deviations from the typical L-shape tRNA structure are presented (PDB:2j02 chain V, PDB:1wz2 chain D, and PDB:2du6 chain D, colored red, blue, and green, respectively).
All 141 nonfragment tRNA structures except for two have been classified into one cluster with no additional structures. The cluster is represented by 27 tRNA structures with two false negatives. The false negative structures (PDB:1j2b, chains C and D) have a λ-shape, which drastically differs from the typical L-shape. The difference is also captured in the secondary structure (Schimmel and Tamura 2003). The similarity between the two tRNA shapes is restricted to the aminoacylation domain in both the 2D and 3D structures.
The L-shaped tRNA structures vary in many parameters: size (65–88 nt), sequence (average pairwise sequence identity of 50%), and environment (binding to different proteins). These parameters all have a great effect on the tertiary structure. Nevertheless, a pivot-based multiple alignment between the 27 representative structures shows that they have a common 3D substructure consisting of 14 nt (Fig. 5C). The conserved nucleotides concentrate in the aminoacylation domain and constitute 40% of it, while the anticodon domain is more variable.
The conservation of the aminoacylation domain among the L-shaped tRNA structures is correlated with the conservation among tRNA synthetase proteins. Specifically, it was previously argued that in tRNA synthetase, the domain that binds to the aminoacylation domain of the tRNA is remarkably more conserved than the domain that binds the tRNA anticodon domain (Schimmel and de Pouplana 1995). This along with the high structural conservation of the aminoacylation domain between the two tRNA shapes supports the hypothesis of Schimmel and de Pouplana (1995), which suggests that the different tRNA domains have developed separately and that the anticodon domain was added later to the aminoacylation domain.
Ribosomal RNA (rRNA)
To date, complete structures of the ribosome are available only for prokaryotes. The ribosome in prokaryotes is denoted as 70S and is composed of two subunits, the large (50S) subunit and the small (30S) subunit. The large subunit contains two RNA chains, which are denoted 5S rRNA and 23S rRNA. The small subunit contains only one RNA chain, denoted 16S rRNA.
5S rRNA.
All of the 68 nonfragment structures of 5S rRNA have been clustered into a single cluster with no other annotated structure. The cluster has four representatives, 64 highly identical structures, and a set of 30 highly identical fragments. The dendrogram of the cluster (Fig. 3) reflects the evolutionary relationship of the organisms of the structures. Specifically, the three closest representatives in the dendrogram belong to two different bacteria. The structure in the dendrogram that is the least similar is of archeal 5S rRNA. The dendrogram also reflects structural differences imposed by a stress protein on the remote structure of the three bacterial structures. The four 5S rRNA representatives, both archeal and bacterial, have a significant global similarity. A pivot-based multiple alignment of the four structures reveals that 87 nt (72%) are spatially conserved, compared to only 46 nt (38%) by multiple sequence alignment (Fig. 6). Additionally, the average pairwise structural identity between the four representatives is 75%, while the average sequence identity is only 63%.
FIGURE 6.

5S rRNA. (A) A pivot-based multiple alignment between the four representative members of the 5S rRNA cluster. The pivot structure (PDB:2hguB) is colored gray and is fully displayed. For the three other structures (PDB:1vp0 chain A, PDB:1yjw chain 9, and PDB:2awb chain A) only the 87 spatially conserved nucleotides are displayed (in red, green, and blue, respectively). One of the 5S rRNA structures is in complex with the CTC stress protein (PDB:1vp0 chain W, cyan), which alters the 5S rRNA in its binding site. As expected, some of the spatially nonconserved nucleotides are centralized in the protein binding site. The 3D similarity between the four structures is represented by the dendrogram of the cluster in Figure 3. (B) A multiple sequence alignment generated by Clustal W for the four representative structures of the 5S ribosomal RNA cluster. Only 46 nt (38%) are preserved in sequence compared to the 87 spatially conserved nucleotides (72%).
23S rRNA.
The 84 nonfragment structures of 23S rRNA have been clustered into one cluster with no other annotated structure. The cluster contains four representatives, 80 highly identical structures, and 53 highly identical fragments. A pivot-based multiple alignment between the four representatives shows that 2042 nt (72%) are spatially conserved compared to only 1220 (43%) by multiple sequence alignment. The average pairwise structural identity is 75%, while the average pairwise sequence identity is only 65%. The representative set of the 23S cluster, like the one of the 5S cluster, contains one archeal structure and three bacterial structures, where one of these is under stress. The dendrograms of the two clusters are thus similar, in agreement with the organisms.
16 rRNA.
The 47 nonfragment structures of 16S rRNA have been classified into a single cluster with no false positives. This cluster has two representatives, 45 highly identical structures, and 54 highly identical fragments. The two representatives have 1148 nt (75%) conserved by sequence and 1337 nt (87.4%) conserved by structure.
Unannotated clusters
The data include structures with no annotation. Most of these structures possess only a small portion or a module cut out from the natural complete molecule due to difficulties in the structure determination process. In many cases, the structurally determined portions of the molecules under inspection are not random substructures, but relatively interesting ones. Consequently, similarity between such structures may suggest recurring local motifs. Below, we present two examples for clusters of unannotated structures.
A possible reverse transcriptase binding site.
This cluster consists of 30 structures with four representatives. The representatives consist of three quasi-helical structures and one kissing hairpin complex. Despite the kissing hairpin complex structure, a pivot-based multiple alignment has revealed that all the four structures are spatially similar, sharing two stem regions with a single-nucleotide bulge and an asymmetric internal loop (Fig. 7A). All the four representatives are substructures of some molecule that binds a reverse transcriptase protein. Specifically, the substructures are linear and kissing hairpin forms of the HIV genomic RNA dimerization initiation site (SL1), a conserved site on the eel's long interspersed retrotransposable element (LINE), and a substructure of the human telomerase RNA activation domain. Both the telomerase and the LINE substructures are known to serve as the sites for binding a reverse transcriptase protein, and their conserved asymmetric internal loop is necessary for this binding (Kajikawa and Okada 2002; Leeper and Varani 2005; Nomura et al. 2006). A similar property is currently unknown for the two forms of the HIV substructures.
FIGURE 7.

(A) A possible reverse transcriptase binding site. A pivot-based multiple alignment between three quasi-helix structures and one kissing hairpin complex structure classified into the same cluster: an HIV genomic RNA dimerization initiation site (SL1) in a kissing hairpins form (PDB:1k9w, yellow) and in a linear form (PDB:462d, green), a conserved site on the eel's LINE (PDB:2fdt, red), and a substructure of the human telomerase RNA activation domain (PDB:1z31, blue). The four structures spatially share two stem regions (underlined) with a single-nucleotide bulge (marked by an arrow) and an asymmetric internal loop (marked by a double headed arrow). (B) Helix with a twist? A pivot-based multiple alignment between five hairpin-like structures of the same cluster: PDB:1i6u, chain D (red), PDB:1hq1, chain B (green), 1kog, chain P (blue), 1s03, chain B (yellow), and 1xjr, chain A (cyan). The spatially conserved substructure consists of two asymmetric disruptions (marked by arrows) within a stem region.
Helix with a twist?
This cluster consists of 27 structures with five representatives. The five representatives are hairpin-like structures of different functions and origins. The conserved portion among them is in the middle of the structures, where there are two asymmetric disruptions in a stem region. These conserved disruptions cause a slight bend in the stem region, making one of its parts denser than the complementary one (Fig. 7B). Four out of the five members in the cluster are solved RNA structures bound to a protein. Their binding site is contained in the substructure that is shared by all the five structures of the cluster. One of the protein-bound RNA structures (PDB:1i6u, chain D) is part of 16S rRNA and it binds the S8 ribosomal protein. Besides playing a key role in the assembly of the small ribosomal subunit, the S8 ribosomal protein negatively regulates its own expression by binding to its spc operon mRNA. The S8 binding site of the spc operon mRNA (PDB:1s03) is spatially similar to the one of 16S rRNA. Therefore, the two RNA structures are in the same cluster. The third structure in the cluster is an mRNA substructure bound to a threonyl-tRNA synthetase, which is an enzyme that, similarly to the S8 ribosomal protein, inhibits its own translation (PDB:1kog, chain P). The fourth structure is a portion of the 4.5S RNA bound to SRP protein (PDB:1hq1B). The fifth structure (PDB:1xjr, chain A) is an unbound RNA that contains the highly conserved stem–loop II of the SARS virus. It was previously postulated that this molecule mimics a part of the ribosomal RNA and by so doing recruits ribosomal proteins needed for SARS translation (Robertson et al. 2005).
Intercluster motifs
The structures in the database are classified into clusters based on their global similarity. Nevertheless, local similarity may exist between structures of different clusters. Below, we present two examples for spatially conserved motifs found in globally dissimilar structures.
A packaging interaction conserved over three clusters.
A spatial similarity is found between the representative structures of three neighboring clusters in the database dendrogram: one internal ribosomal entry site (IRES) structure, one ribonuclease P (RNase P) RNA structure, and two structures of Tetrahymena thermophila self-splicing group I introns. These structures have different overall fold and function. Nevertheless, they share an interregion motif of a looped-helix interacting with the minor groove of another helix (Fig. 8). Based on the literature, we believe that this motif is important for the correct packaging of the molecules. Specifically, in the IRES structure, the conserved motif is composed of the L1.2A loop interacting with the minor groove of P2.2, and in this way contributes to the correct fold of the molecule (Pfingsten et al. 2006). In the RNaseP RNA structure, the motif consists of the P9 hairpin tetraloop of the specificity domain interacting with the minor groove of the P1 helix of the catalytic domain7 (Torres-Larios et al. 2005). In the intron structures, the motif contains the P5b looped helix interacting with the minor groove of the J6a/6b, which is near the catalytic site (Cate et al. 1996; Guo et al. 2004).
FIGURE 8.

A conserved interregion packaging interaction. A pivot-based multiple alignment between three structures from different neighboring clusters: an IRES structure (PDB:2il9, green), an RNase P RNA structure (PDB:2a2e, red), and a structure of Tetrahymena thermophila self-splicing group I intron (PDB:1x8w, chain B, gray), which serves as a pivot. For simplicity of the visualization, the pivot is fully displayed, while only the conserved regions are shown for the other two structures. Despite having a different fold and function, the three structures share an interregion motif of a looped-helix interacting with the minor groove of another helix. This interaction surface is displayed in the left rectangle.
A possible conformational switching motif.
Another example for an intercluster motif is shared between the Hepatitis Delta Virus (HDV) ribozyme cluster (with one representative) and its neighboring Thiamine pyrophosphate (thi-box) riboswitch cluster (with two representatives). The motif is composed of two coaxial stacking helices and a spatially adjacent strand (Fig. 9A). This motif is truly three-dimensional, consisting of several noncontiguous parts along both the nucleotide chain and the secondary structure (Fig. 9B). In the HDV ribozyme, the motif corresponds to the coaxial helices P2 and P3 and to the strands of helices P1.1 and P1 that are near the active site. In the thi-box riboswitch, the motif corresponds to the coaxial helices P1 and P2 and one strand of helix P4. For both molecules, it is assumed that the nucleotides included in the motif are essential for the conformational switching needed for the activity of the molecules (Pereira et al. 2002; Edwards and Ferré-D'Amaré 2006).
FIGURE 9.

A possible conformational switching motif. (A) A 3D structure alignment between a thi-box riboswitch representative (PDB:2hoo chain A, 82 nt, blue) and an HDV ribozyme representative (PDB:1vc7, 74 nt, red). The eight conserved base pairs are colored green, while the other nine conserved nucleotides are colored yellow. (B) A projection of the 3D common substructure on the 2D structures. The 2D structures of the thi-box riboswitch and the HDV ribozyme appear right and left respectively. The numbering of the nucleotides is relative to the first nucleotide in the PDB files. Nucleotides that belong to the conserved tertiary motif are shaded.
Database search application
A set of 216 high-resolution 3D structures of RNA (solved by either NMR or X-ray crystallography) have been deposited in the PDB since March 2007. The database search utility provided by ARTS has allowed a fast and automatic comparison of all these newly determined structures with structures in DARTS. The search has shown that most of the new structures are similar in fold to a known one. Additionally, it has revealed interesting spatial substructures common to different RNA molecules.
One example is the search for spatial similarity between the recently solved crystal structure of the SAM-II riboswitch (Gilbert et al. 2008) and known structures in DARTS. This query structure is the first solved structure of SAM-II. Therefore, its overall structure was assessed to be different than all previously solved RNA structures and only partial similarities were detected. The partial similarities reveal that SAM-II share tertiary substructures with other RNA molecules despite having different secondary structures. The top-ranking alignment is with a tRNA structure. The 2D structure of SAM-II conforms to a classic pseudoknot (Fig. 10A), different than the cloverleaf 2D structure of tRNA (Fig. 5A). Nevertheless, the two molecules share a common 3D substructure consisting of 28 nt with an RMSD of 1.67 Å (Fig. 10B). In tRNA the conserved substructure is mainly located in the anticodon domain and consists of most of it. In SAM-II the conserved substructure contains the P1 Watson–Crick-paired helix and partially the P2a, P2b, and L1 regions. Additionally, it includes the SAM binding pocket located in the major groove of the P2b-L1 triplex. The conserved substructure has a nearly straight 3D shape, since its helical segments stack upon each other. The second top-ranking alignment for SAM-II is with 23S rRNA (Fig. 10C). This alignment reveals a conserved substructure of 29 nt with an RMSD of 1.57 Å. Compared to the common substructure with the tRNA structure, in SAM-II this substructure also partially includes the L3 loop, but excludes P2a. Variants of these two common substructures are also found between SAM-II and other RNA molecules, like the hairpin ribozyme, the GlmS ribozyme, and the SAM-I riboswitch. Figure 10D presents the alignment between the SAM-II and SAM-I structures. Despite that the two SAM riboswitches have different global structures, they share a 3D substructure with 22 nt and an RMSD of 1.33 Å. Interestingly, in both riboswitches this substructure interacts with the SAM metabolite, but the interacting nucleotides are not superimposed.
FIGURE 10.

Database Search with SAM-II. (A) The 2D structure of SAM-II. (B) A 3D structure alignment between SAM-II (PDB:2qwy, chain C, 52 nt, red) and tRNA (PDB:1fir, chain A, 78 nt, blue). The 7 conserved base pairs are colored green, while the other 14 conserved nucleotides are colored yellow. (C) A 3D structure alignment between SAM-II and 23S rRNA (PDB:2i2v, chain B, 2841 nt, blue). The 6 conserved base pairs are in green, while the other 17 conserved nucleotides are in yellow. For simplicity of the visualization, the 23S rRNA structure is only partially displayed. (D) A 3D structure alignment between SAM-II and SAM-I (PDB:2gis, chain A, 94 nt, blue). The 6 conserved base pairs are in green, while the other 10 conserved nucleotides are in yellow.
DISCUSSION
Despite the growing appreciation of the importance of noncoding RNA molecules, little is known about the way they adopt specific structures conferring their biochemical functions. In this work, we have taken further steps toward a better understanding of RNA structures. We carried out an all-against-all comparison between the 1333 solved RNA structures that were available in the March 2007 release of the PDB (Berman et al. 2000). The comparison was conducted at three structural levels: sequence (1D), secondary structure (2D), and tertiary structure (3D). The results have exposed thresholds for guaranteeing zero false-positives when determining functional similarity based on global structural similarity at the 1D, 2D, and 3D levels. The thresholds are 65%, 95%, and 48%, respectively. As expected, the threshold for the 3D identity score is lower than the ones for both the 1D and 2D identity scores. However, surprisingly, the threshold for the 2D identity score is very high, higher than the one for the 1D identity score. The function predictive power of the 1D, 2D, and 3D identity scores, computed as the area under a ROC curve, are 0.64, 0.87, and 0.96, respectively. This indicates that although the threshold for guaranteeing zero false positives is very high for the 2D identity score, its overall predictive power is good and higher than the 1D identity score. Having the lowest guaranteeing threshold and the biggest area under the ROC curve, the best function predictor is the 3D identity score.
A new classification database of RNA tertiary structures, named DARTS, is also presented. The database was constructed using a fully automated scheme that clusters RNA structures mainly on the basis of their global spatial resemblance. The classification is a hierarchical one reflecting the similarity relationship between the structures. The 94 different clusters reveal the current fold repertoire of RNA, where structural similarities within and between clusters may suggest possible local tertiary motifs. In addition, DARTS is provided with a search tool for comparing a newly determined RNA structure with the ones in the database. This may allow users to gain more insights into their structures. We believe that further research of conserved 3D substructures found in DARTS may aid in defining possible domains and building blocks. This should be useful for structure prediction as well as for facilitating the assignment of structure–function to newly determined tertiary structures of RNA. A user-friendly web interface is available at http://bioinfo3d.cs.tau.ac.il/DARTS/.
MATERIALS AND METHODS
The construction of the database followed six steps: (1) data acquisition—extracting all RNA structures from the PDB; (2) similarity evaluation—evaluating the similarity between all pairs of RNA structures by 1D, 2D, and 3D resemblance; (3) creation of a representative data set; (4) determination of highly identical data members; (5) hierarchical clustering; and (6) database organization (Fig. 11).
FIGURE 11.

Data generation scheme.
Data acquisition
The March 2007 release of the PDB (Berman et al. 2000) contained 721 X-ray crystal structures and 374 NMR structures with RNA components. The RNA components appearing in these 1095 compounds varied from small single-stranded RNA ligands to multichain RNA molecules. Due to this variability and since currently there is no accepted definition of an RNA domain as there is for proteins, we define a stand-alone structure of an RNA component as the overall structure of RNA chains in a compound with at least three base pairs between them. Note that this definition resolves the problem of multichain RNA fragments that were cut artificially from a single chain RNA in the experimental structure determination process (for example, the RNA duplex appearing in PDB:157D). In total, there were 1664 stand-alone RNA structures. About 20% of them were with a few nucleotides or single stranded and thus were filtered out. Overall, 1333 stand-alone structures of RNA were used for the analysis.
Similarity evaluation
We evaluated the similarity between pairs of stand-alone RNA structures by applying separately sequence alignment, 2D structural alignment, and 3D structural alignment.
Sequence comparison
Using Clustal W (Thompson et al. 1994) with default parameters, an all-against-all pairwise comparison was performed between the stand-alone RNA structures. The result for each pair of structures is a sequence (1D) identity score (seqident), which is defined as the number of identical nucleotides normalized by the minimal structure size.
2D structural comparison
The currently available tools for 2D structural alignment of RNA are incapable of handling nonnested tertiary interactions, like pseudoknots. Therefore, the secondary structure of each stand-alone RNA structure was simplified to a treelike structure with the maximal number of possible nested interactions. This was carried out by applying the Nussinov algorithm for finding the maximal set of nested loops in an interval graph (Nussinov and Jacobson 1980), where the allowed interactions are only the ones in the given tertiary structure. Using RNAforester (Höchsmann et al. 2003) of the Vienna package (Hofacker 2003) with default parameters, an all-against-all comparison was performed on the simplified treelike 2D structures of all stand-alone RNA structures. For each pair of structures, a 2D identity score (2Dident) was calculated as the number of common nucleotides divided by the size of the smaller structure.
3D structural comparison
Using ARTS (Dror et al. 2005), an all-against-all comparison was applied to the stand-alone RNA structures. Given a pair of structures, ARTS searches for a priori unknown common substructures with at least two consecutive base pairs. The search is irrespective of the order of the stems and is truly three-dimensional, where a nucleic acid structure is represented by the 3D positions of its phosphate atoms. The runtime of a single pairwise comparison varied from a few milliseconds to less than 30 min on a standard PC. The most time-consuming comparison was between a pair of structures of the large ribosomal subunit with almost 3000 nt in each structure. For a pair of average-size structures of noncoding RNA molecules with hundreds of nucleotides the runtime was a few seconds.
The score of ARTS for a pair of RNA structures is defined as a weighted sum of the number of spatially close nucleotides and the number of spatially close base pairs (within a distance error of 3 Å). That is, the score of ARTS for structures A and B is ARTS(A,B)=w 1×NC(core)+w 2×BP(core), where NC(core) and BP(core) are the number of close nucleotides and the number of close base pairs, respectively, and w 1 and w 2 are predefined weights (set to 1 and 2 by default). For an all-against-all comparison, the pairwise scores of ARTS were normalized with respect to the size of the compared structures, yielding a 3D identity score (3Dindent). Specifically, let ARTS M(A,B) be the maximal possible score that structures A and B can achieve by ARTS, that is ARTSM(A,B)=w 1×min{NC(A),NC(B)}+w 2×min{BP(A),BP(B)}, where NC(X) and BP(X) are the number of nucleotides and the number of base pairs of structure X, respectively. Using this notation, the 3D identity score of A and B is defined as 3Dindent(A,B)=ARTS(A,B)/ARTSM(A,B).
Only sequence and 3D structure resemblances were considered in the construction of the database. Resemblance in the secondary structure was ignored since our analysis has shown that for it the zero false-positive threshold is very high, higher than 90%.
Creation of a representative data set
The problem of finding the maximal representative data set is equivalent to finding the maximum independent set in a graph, where a vertex corresponds to a stand-alone RNA structure and an edge connects a pair of vertices if the identity scores (both 1D and 3D) of the associated structures exceed some predefined thresholds. The maximum independent set problem is known to be NP-hard (Garey and Johnson 1979). Below, we present a heuristic suited for the RNA data set.
Let us assume that all the stand-alone RNA structures are arranged in some random order. We declare that structure A is approximately represented by structure B if the following two conditions hold: (1) either the sequence identity score or the 3D identity score, seqident(A,B) or 3Dident(A,B), is above some predefined threshold; and (2) A is either smaller than B or equal to B in size and lower in index. Using this definition, the representative data set RepSet can be constructed from the initial data set in an iterative manner as follows. First, we choose all the structures that are not represented by any of the other structures in the initial data set and add them to RepSet. Then, we remove from the initial data set all the structures that have been added to RepSet and all the structures that they represent. We proceed with these two steps until the initial data set is empty. The result for an identity score threshold of 0.9 is a representative data set of 244 stand-alone RNA structures. Note that different random orderings of the structures yielded only minor changes in the results.
Determination of highly identical data members
The aim of this stage is to assign to each structure that has been excluded from the representative data set the most appropriate representative structure. This is carried out as follows. For each structure A ∉ RepSet, we define the set of possible representative structures as the set of structures in the representative data set for which the sequence identity score or the 3D identity score with A is above 0.9, that is {B ∈ RepSet:max[3Dident (A,B), seq (A,B)]> 0.9}. The structure B that is the closest in size to A in its set of representatives is considered as the most appropriate representative of A, and the two structures, A and B, are defined as highly identical structures. In case the size ratio exceeds 1.5 for all the possible representatives of A, we declare that the most appropriate representative of A is the structure B that maximizes either 3Dident(A,B) or seqident (A,B). In this case, A is defined as a highly identical fragment of B.
Clustering
The goal of this stage is to classify the stand-alone RNA structures into different groups, where the structures in each group exhibit some common spatial characteristics. Clustering algorithms are divided into two basic types: partitional and hierarchical. Partitional clustering aims to directly obtain a single partition of the data set into disjoint clusters, whereas hierarchical clustering reflects the relationship of the obtained clusters. Hierarchical clustering serves better our goal of exploring the world of RNA structure, since it provides not only the clusters themselves, but also the inner hierarchy of each cluster and the relationship between the different clusters.
Hierarchical clustering algorithms are further categorized into two different types: divisive (top down) and agglomerative (bottom up). Divisive clustering begins with the entire data set as a single cluster and then iteratively breaks this cluster into smaller clusters. In contrast, agglomerative clustering treats each element in the data set as a single cluster to start off with and then unites these clusters into successively bigger clusters. Due to efficiency considerations the agglomerative approach was chosen.
The clustering algorithm is applied only to the representative data set. It starts with each RNA structure in a stand-alone cluster. Then, clusters are iteratively merged into bigger clusters, until all structures are encapsulated into one final cluster. The result is a dendrogram, which is a hierarchical binary tree of distances between the structures. The leaves represent the initial single-structure clusters, while the root represents the final cluster of all structures. Specifically, in each iteration, the algorithm selects a pair of clusters that minimizes their average distance and unifies them into one cluster. The average distance (average linkage) between a pair of clusters Ci and Cj is defined as
 |
where
and NC(X) is the number of nucleotides in structure X. Note that this distance function matches our interest in a dendrogram that represents the relative global similarity between the structures, since the distance between pairs of structures with a size ratio greater than 1.5 was defined to be 1. Note also that only the 3D identity score is considered in the average distance function. This decision is based on our prior analysis of the reliability of the resemblance measures under the three structural levels (see the Results section).
Each level in the dendrogram represents a partition of the data set into clusters. Our aim is to select a cut level for which each cluster is maximal in size and the similarity of all its members is above some threshold. The choice of this threshold is nontrivial. Smaller RNA structures are naturally biased toward higher 3D identity scores (Fig. 12). It is clear, though, that a match of a third of the nucleotides in big structures (a few hundreds of nucleotides or more) is more significant than a match of nearly all nucleotides in small structures (one or two dozens of nucleotides). Therefore, an absolute threshold for a cut level is inappropriate for our task. Instead, we have chosen a threshold that incorporates a logarithmic dependency on the size of the structures. Specifically, starting with the root of the dendrogram, we split a node into two different clusters Ci and Cj if
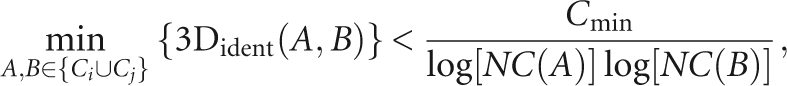 |
where C min is a constant of value 5. Note that using C min = 5 ± 0.3 resulted in only a minor affect on the resulting clusters.
FIGURE 12.

The 3D structure similarity score for pairs of structures with an average size of 1–350 nt. For simplicity of the visualization, pairs of structures with a larger average size or with a size ratio greater than 1.5 are not presented. If the similarity score for a pair of structures A and B exceeds the 5/{log[NC(A)]×log[NC(B)]} cutoff, the similarity score appears as a blue circle. Otherwise, it appears as a red cross.
The time complexity for creating the tree is O(n 3), where n is the number of classified structures. The determination of the clusters based on the tree is carried out in O(n 2) time. Therefore, the total time complexity of the procedure is O(n 3).
Database organization
The clustering procedure was applied only to the representative data set and obtained a set of clusters. The remaining structures were assigned to these clusters based on their representative structures. Specifically, each of the remaining structures was marked as either a highly identical structure or a highly identical fragment of a representative structure and was assigned to a cluster accordingly. The result is a set of disjoint clusters. For each cluster, a dendrogram outlines the hierarchical relationship between the representative structures and each representative structure is assigned with a set of highly identical structures and a set of highly identical fragments (Fig. 3).
SUPPLEMENTAL DATA
A user-friendly web interface is available at http://bioinfo3d.cs.tau.ac.il/DARTS/.
ACKNOWLEDGMENTS
The research of O.D. has been supported by the Eshkol Fellowship funded by the Israeli Ministry of Science. The research of H.J.W. has been supported in part by the Israel Science Foundation (grant no. 281/05) and by the Hermann Minkowski-Minerva Center for Geometry at TAU. The research of H.J.W. and R.N. has been supported by the NIAID, NIH (Grant 1UC1AI067231), and by the Binational U.S.-Israel Science Foundation (BSF). This project has been funded in whole or in part with Federal funds from the National Cancer Institute, National Institutes of Health, under contract number N01-CO-12400. The content of this publication does not necessarily reflect the view of the policies of the Department of Health and Human Services, nor does mention of trade names, commercial products, or organization imply endorsement by the U.S. Government. This research was supported (in part) by the Intramural Research Program of the NIH, National Cancer Institute, Center for Cancer Research.
Footnotes
Article published online ahead of print. Article and publication date are at http://www.rnajournal.org/cgi/doi/10.1261/rna.853208.
Data not shown, since a similar observation on a smaller representative data set is expressed in Figures 2A–C.
The size ratio is calculated as the number of nucleotides of the bigger structure divided by the number of nucleotides of the smaller structure.
We have disregarded the 2D identity score since for it the zero false-positive threshold is very high.
The RNaseP RNA structure (PDB:2a2e) is annotated as RNaseP RNA catalytic domain. However, besides containing the catalytic domain in whole, the structure also contains some portions of the specificity domain. This enables the motif finding.
REFERENCES
- Batey R., Rambo R., Doudna J. Tertiary motifs in RNA structure and folding. Angew. Chem. Int. Ed. Engl. 1999;38:2326–2343. doi: 10.1002/(sici)1521-3773(19990816)38:16<2326::aid-anie2326>3.0.co;2-3. [DOI] [PubMed] [Google Scholar]
- Berman H., Westbrook J., Feng Z., Gilliland G., Bhat T., Weissig H., Shindyalov I., Bourne P. The Protein Data Bank. Nucleic Acids Res. 2000;28:235–242. doi: 10.1093/nar/28.1.235. [DOI] [PMC free article] [PubMed] [Google Scholar]
- Berman H., Westbrook J., Feng Z., Iype L., Schneider B., Zardecki C. The nucleic acid database. Acta Crystallogr. D Biol. Crystallogr. 2002;58:889–898. doi: 10.1107/s0907444902003487. [DOI] [PubMed] [Google Scholar]
- Bindewald E., Hayes R., Yingling Y.G., Kasprzak W., Shapiro B.A. RNAJunction: A database of RNA junctions and kissing loops for three-dimensional structural analysis and nanodesign. Nucleic Acids Res. 2007;36:D392–D397. doi: 10.1093/nar/gkm842. [DOI] [PMC free article] [PubMed] [Google Scholar]
- Byun Y., Han K. PseudoViewer: Web application and web service for visualizing RNA pseudoknots and secondary structures. Nucleic Acids Res. 2006;34:W416–W422. doi: 10.1093/nar/gkl210. [DOI] [PMC free article] [PubMed] [Google Scholar]
- Cate J.H., Gooding A.R., Podell E., Zhou K., Golden B.L., Kundrot C.E., Cech T.R., Doudna J.A. Crystal structure of a group i ribozyme domain: Principles of RNA packing. Science. 1996;273:1678–1685. doi: 10.1126/science.273.5282.1678. [DOI] [PubMed] [Google Scholar]
- Chen J.-H., Le S.-Y., Maizel J.V. Prediction of common secondary structures of RNAs: A genetic algorithm approach. Nucleic Acids Res. 2000;28:991–999. doi: 10.1093/nar/28.4.991. [DOI] [PMC free article] [PubMed] [Google Scholar]
- DeLano W. DeLano Scientific. San Carlos, CA: 2002. The PyMOL molecular graphics system. http://www.pymol.org. [Google Scholar]
- Dror O., Nussinov R., Wolfson H.J. ARTS: Alignment of RNA tertiary structures. Bioinformatics. 2005;21 Suppl. 2:ii1–ii7. doi: 10.1093/bioinformatics/bti1108. http://bioinfo3d.cs.tau.ac.il/ARTS. [DOI] [PubMed]
- Duarte C.M., Pyle A.M. Stepping through an RNA structure: A novel approach to conformational analysis. J. Mol. Biol. 1998;284:1465–1478. doi: 10.1006/jmbi.1998.2233. [DOI] [PubMed] [Google Scholar]
- Duarte C.M., Wadley L.M., Pyle A.M. RNA structure comparison, motif search and discovery using a reduced representation of RNA conformational space. Nucleic Acids Res. 2003;31:4755–4761. doi: 10.1093/nar/gkg682. [DOI] [PMC free article] [PubMed] [Google Scholar]
- Edwards T.E., Ferré-D'Amaré A.R. Crystal structures of the thi-box riboswitch bound to thiamine pyrophosphate analogs reveal adaptive RNA-small molecule recognition. Structure. 2006;14:1459–1468. doi: 10.1016/j.str.2006.07.008. [DOI] [PubMed] [Google Scholar]
- Ferrè F., Ponty Y., Lorenz W.A., Clote P. DIAL: A web server for the pairwise alignment of two RNA three-dimensional structures using nucleotide, dihedral angle and base-pairing similarities. Nucleic Acids Res. 2007;35:W659–W668. doi: 10.1093/nar/gkm334. [DOI] [PMC free article] [PubMed] [Google Scholar]
- Gardner P.P., Wilm A., Washietl S. A benchmark of multiple sequence alignment programs upon structural RNAs. Nucleic Acids Res. 2005;33:2433–2439. doi: 10.1093/nar/gki541. [DOI] [PMC free article] [PubMed] [Google Scholar]
- Garey M.R, Johnson D.S. Computers and intractability: A guide to the theory of NP-completeness. Freeman and Company; New York: 1979. [Google Scholar]
- Gendron P., Lemieuxs S., Major F. Quantitative analysis of nucleic acid three-dimensional structures. J. Mol. Biol. 2001;308:919–936. doi: 10.1006/jmbi.2001.4626. [DOI] [PubMed] [Google Scholar]
- Gilbert S.D., Rambo R.P., Tyne D.V., Batey R.T. Structure of the SAM-II riboswitch bound to S-adenosylmethionine. Nat. Struct. Mol. Biol. 2008;15:177–182. doi: 10.1038/nsmb.1371. [DOI] [PubMed] [Google Scholar]
- Golden B.L., Gooding A.R., Podell E.R., Cech T.R. A preorganized active site in the crystal structure of the Tetrahymena ribozyme. Science. 1998;282:259–264. doi: 10.1126/science.282.5387.259. [DOI] [PubMed] [Google Scholar]
- Griffiths-Jones S. RALEE-RNA ALignment Editor in Emacs. Bioinformatics. 2005;21:257–259. doi: 10.1093/bioinformatics/bth489. [DOI] [PubMed] [Google Scholar]
- Griffiths-Jones S., Moxon S., Marshall M., Khanna A., Eddy S.R., Bateman A. Rfam: Annotating noncoding RNAs in complete genomes. Nucleic Acids Res. 2005;33:D121–D124. doi: 10.1093/nar/gki081. [DOI] [PMC free article] [PubMed] [Google Scholar]
- Griffiths-Jones S., Grocock R.J., van Dongen S., Bateman A., Enright A.J. miRBase: MicroRNA sequences, targets and gene nomenclature. Nucleic Acids Res. 2006;34:D140–D144. doi: 10.1093/nar/gkj112. [DOI] [PMC free article] [PubMed] [Google Scholar]
- Guo F., Gooding A.R., Cech T.R. Structure of the tetrahymena ribozyme: Base triple sandwich and metal ion at the active site. Mol. Cell. 2004;16:351–362. doi: 10.1016/j.molcel.2004.10.003. [DOI] [PubMed] [Google Scholar]
- Gustafson A.M., Allen E., Givan S., Smith D., Carrington J.C., Kasschau K.D. ASRP: The Arabidopsis small RNA project database. Nucleic Acids Res. 2005;33:D637–D640. doi: 10.1093/nar/gki127. [DOI] [PMC free article] [PubMed] [Google Scholar]
- Harrison A.-M., South D.R., Willett P., Artymiuk P.J. Representation, searching and discovery of patterns of bases in complex RNA structures. J. Comput. Aided Mol. Des. 2003;17:537–549. doi: 10.1023/b:jcam.0000004603.15856.32. [DOI] [PubMed] [Google Scholar]
- Havgaard J.H., Lyngsø R.B., Gorodkin J. The FOLDALIGN web server for pairwise structural RNA alignment and mutual motif search. Nucleic Acids Res. 2005;33:650–653. doi: 10.1093/nar/gki473. [DOI] [PMC free article] [PubMed] [Google Scholar]
- Hershkovitz E., Tannenbaum E., Howerton S.B., Sheth A., Tannenbaum A., Williams L.D. Automated identification of RNA conformational motifs: Theory and application to the HM LSU 23S rRNA. Nucleic Acids Res. 2003;31:6249–6257. doi: 10.1093/nar/gkg835. [DOI] [PMC free article] [PubMed] [Google Scholar]
- Höchsmann M., Töller T., Giegerich R., Kurtz S. Local similarity in RNA secondary structures. In: Stanford C., editor. Proceedings of Computational Systems Bioinformatics (CSB 2003) IEEE Computer Society; Washington, DC: 2003. pp. 159–168. [PubMed] [Google Scholar]
- Hofacker I.L. Vienna RNA secondary structure server. Nucleic Acids Res. 2003;31:3429–3431. doi: 10.1093/nar/gkg599. [DOI] [PMC free article] [PubMed] [Google Scholar]
- Hofacker I.L., Bernhart S.H.F., Stadler P.F. Alignment of RNA base pairing probability matrices. Bioinformatics. 2004;20:2222–2227. doi: 10.1093/bioinformatics/bth229. [DOI] [PubMed] [Google Scholar]
- Holmes I. Accelerated probabilistic inference of RNA structure evolution. BMC Bioinformatics. 2005;6:73. doi: 10.1186/1471-2105-6-73. [DOI] [PMC free article] [PubMed] [Google Scholar]
- Huang H., Nagaswamy U., Fox G.E. The application of cluster analysis in the intercomparison of loop structures in RNA. RNA. 2005;11:412–423. doi: 10.1261/rna.7104605. [DOI] [PMC free article] [PubMed] [Google Scholar]
- Kajikawa M., Okada N. Lines mobilize sines in the eel through a shared 3′ sequence. Cell. 2002;111:433–444. doi: 10.1016/s0092-8674(02)01041-3. [DOI] [PubMed] [Google Scholar]
- Kin T., Yamada K., Terai G., Okida H., Yoshinari Y., Ono Y., Kojima A., Kimura Y., Komori T., Asai K. fRNAdb: A platform for mining/annotating functional RNA candidates from noncoding RNA sequences. Nucleic Acids Res. 2007;35:D145–D148. doi: 10.1093/nar/gkl837. [DOI] [PMC free article] [PubMed] [Google Scholar]
- Leeper T.C., Varani G. The structure of an enzyme-activating fragment of human telomerase RNA. RNA. 2005;11:394–403. doi: 10.1261/rna.7222505. [DOI] [PMC free article] [PubMed] [Google Scholar]
- Lin G.H., Ma B., Zhang K. Proceedings of the Fifth Annual International Conference on Computational Biology. ACM Press; New York: 2001. Edit distance between two RNA structures; pp. 211–220. [Google Scholar]
- Liu C., Bai B., Skogerbǿ G., Cai L., Deng W., Zhang Y., Bu D., Zhao Y., Chen R. NONCODE: An integrated knowledge database of noncoding RNAs. Nucleic Acids Res. 2005;33:D112–D115. doi: 10.1093/nar/gki041. [DOI] [PMC free article] [PubMed] [Google Scholar]
- Lu X.-J., Olson W.K. Resolving the discrepancies among nucleic acid conformational analyses. J. Mol. Biol. 1999;285:1563–1575. doi: 10.1006/jmbi.1998.2390. [DOI] [PubMed] [Google Scholar]
- Lu X.-J., Olson W.K. 3DNA: A software package for the analysis, rebuilding and visualization of three-dimensional nucleic acid structures. Nucleic Acids Res. 2003;31:5108–5121. doi: 10.1093/nar/gkg680. [DOI] [PMC free article] [PubMed] [Google Scholar]
- Lu X.-J., Babcock M., Olson W. Overview of nucleic acid analysis programs. J. Biomol. Struct. Dyn. 1999;16:833–843. doi: 10.1080/07391102.1999.10508296. [DOI] [PubMed] [Google Scholar]
- Lück R., Graf S., Steger G. ConStruct: A tool for thermodynamic controlled prediction of conserved secondary structure. Nucleic Acids Res. 1999;27:4208–4217. doi: 10.1093/nar/27.21.4208. [DOI] [PMC free article] [PubMed] [Google Scholar]
- Mathews D.H., Turner D.H. Dynalign: An algorithm for finding the secondary structure common to two RNA sequences. J. Mol. Biol. 2002;317:191–203. doi: 10.1006/jmbi.2001.5351. [DOI] [PubMed] [Google Scholar]
- Moore P.B. Structural motifs in RNA. Annu. Rev. Biochem. 1999;68:287–300. doi: 10.1146/annurev.biochem.68.1.287. [DOI] [PubMed] [Google Scholar]
- Murthy V.L., Rose G.D. RNABase: An annotated database of RNA structures. Nucleic Acids Res. 2003;31:502–504. doi: 10.1093/nar/gkg012. [DOI] [PMC free article] [PubMed] [Google Scholar]
- Nomura Y., Kajikawa M., Baba S., Nakazato S., Imai T., Sakamoto T., Okada N., Kawai G. Solution structure and functional importance of a conserved RNA hairpin of eel LINE UnaL2. Nucleic Acids Res. 2006;34:5184–5193. doi: 10.1093/nar/gkl664. [DOI] [PMC free article] [PubMed] [Google Scholar]
- Notredame C., O'Brien E.A., Higgins D.G. RAGA: RNA sequence alignment by genetic algorithm. Nucleic Acids Res. 1997;25:4570–4581. doi: 10.1093/nar/25.22.4570. [DOI] [PMC free article] [PubMed] [Google Scholar]
- Nussinov R., Jacobson A.B. Fast algorithm for predicting the secondary structure of single-stranded RNA. Proc. Natl. Acad. Sci. 1980;77:6309–6313. doi: 10.1073/pnas.77.11.6309. [DOI] [PMC free article] [PubMed] [Google Scholar]
- Pang K.C., Stephen S., Engström P.G., Tajul-Arifin K., Chen W., Wahlestedt C., Lenhard B., Hayashizaki Y., Mattick J.S. RNAdb—A comprehensive mammalian noncoding RNA database. Nucleic Acids Res. 2005;33:D125–D130. doi: 10.1093/nar/gki089. [DOI] [PMC free article] [PubMed] [Google Scholar]
- Pereira M.J.B., Harris D.A., Rueda D., Walter N.G. Reaction pathway of the trans-acting hepatitis delta virus ribozyme: A conformational change accompanies catalysis. Biochemistry. 2002;41:730–740. doi: 10.1021/bi011963t. [DOI] [PubMed] [Google Scholar]
- Pfingsten J.S., Costantino D.A., Kieft J.S. Structural basis for ribosome recruitment and manipulation by a viral IRES RNA. Science. 2006;314:1450–1454. doi: 10.1126/science.1133281. [DOI] [PMC free article] [PubMed] [Google Scholar]
- Reeder J., Giegerich R. Consensus shapes: An alternative to the Sankoff algorithm for RNA consensus structure prediction. Bioinformatics. 2005;21:3516–3523. doi: 10.1093/bioinformatics/bti577. [DOI] [PubMed] [Google Scholar]
- Reijmers T.H., Wehrens R., Buydens L.M.C. The influence of different structure representations on the clustering of an RNA nucleotides data set. J. Chem. Inf. Comput. Sci. 2001;41:1388–1394. doi: 10.1021/ci0103626. [DOI] [PubMed] [Google Scholar]
- Robertson M.P., Igel H., Baertsch R., Haussler D., Ares M., Scott W.G. The structure of a rigorously conserved RNA element within the SARS virus genome. PLoS Biol. 2005;3:e5. doi: 10.1371/journal.pbio.0030005. [DOI] [PMC free article] [PubMed] [Google Scholar]
- Sankoff D. Simultaneous solution of the RNA folding, alignment and protosequence problems. SIAM J. Appl. Math. 1985;45:810–825. [Google Scholar]
- Sarver M., Zirbel C.L., Stombaugh J., Mokdad A., Leontis N.B. FR3D: Finding local and composite recurrent structural motifs in RNA 3D structures. J. Math. Biol. 2007;56:215–252. doi: 10.1007/s00285-007-0110-x. [DOI] [PMC free article] [PubMed] [Google Scholar]
- Schimmel P., de Pouplana L.R. Transfer RNA: From minihelix to genetic code. Cell. 1995;81:983–986. doi: 10.1016/s0092-8674(05)80002-9. [DOI] [PubMed] [Google Scholar]
- Schimmel P., Tamura K. tRNA structure goes from L to λ. Cell. 2003;113:276–278. doi: 10.1016/s0092-8674(03)00313-1. [DOI] [PubMed] [Google Scholar]
- Tamura M., Hendrix D.K., Klosterman P.S., Schimmelman N.R.B., Brenner S.E., Holbrook S.R. SCOR: Structural classification of RNA, version 2.0. Nucleic Acids Res. 2004;32:D182–D184. doi: 10.1093/nar/gkh080. [DOI] [PMC free article] [PubMed] [Google Scholar]
- Thompson J.D., Higgins D.G., Gibson T.J. CLUSTAL W: Improving the sensitivity of progressive multiple sequence alignment through sequence weighting, position-specific gap penalties and weight matrix choice. Nucleic Acids Res. 1994;22:4673–4680. doi: 10.1093/nar/22.22.4673. [DOI] [PMC free article] [PubMed] [Google Scholar]
- Torres-Larios A., Swinger K.K., Krasilnikov A.S., Pan T., Mondragyn A. Crystal structure of the RNA component of bacterial ribonuclease p. Nature. 2005;437:584–587. doi: 10.1038/nature04074. [DOI] [PubMed] [Google Scholar]
- Wadley L.M., Pyle A.M. The identification of novel RNA structural motifs using COMPADRES: An automated approach to structural discovery. Nucleic Acids Res. 2004;32:6650–6659. doi: 10.1093/nar/gkh1002. [DOI] [PMC free article] [PubMed] [Google Scholar]
- Wilm A., Mainz I., Steger G. An enhanced RNA alignment benchmark for sequence alignment programs. Algorithms Mol. Biol. 2006;1:19. doi: 10.1186/1748-7188-1-19. [DOI] [PMC free article] [PubMed] [Google Scholar]
- Yang H., Jossinet F., Leontis N., Chen L., Westbrook J., Berman H., Westhof E. Tools for the automatic identification and classification of RNA base pairs. Nucleic Acids Res. 2003;31:3450–3460. doi: 10.1093/nar/gkg529. [DOI] [PMC free article] [PubMed] [Google Scholar]