Abstract
The crystal and molecular structure of an RNA duplex corresponding to the high affinity Rev protein binding element (RBE) has been determined at 2.1-Å resolution. Four unique duplexes are present in the crystal, comprising two structural variants. In each duplex, the RNA double helix consists of an annealed 12-mer and 14-mer that form an asymmetric internal loop consisting of G-G and G-A noncanonical base pairs and a flipped-out uridine. The 12-mer strand has an A-form conformation, whereas the 14-mer strand is distorted to accommodate the bulges and noncanonical base pairing. In contrast to the NMR model of the unbound RBE, an asymmetric G-G pair with N2-N7 and N1-O6 hydrogen bonding, is formed in each helix. The G-A base pairing agrees with the NMR structure in one structural variant, but forms a novel water-mediated pair in the other. A backbone flip and reorientation of the G-G base pair is required to assume the RBE conformation present in the NMR model of the complex between the RBE and the Rev peptide.
The Rev response element (RRE) is a 244-nt region in the env gene of HIV-1 that mediates transport of viral mRNA from the nucleus to the cytoplasm. Initially, the Rev protein binds with high affinity and specificity to a highly structured 30-residue region of the stem-loop IIB domain often termed the Rev binding element (RBE). The RBE-Rev affinity has been determined to be approximately 10−11 M. Subsequently, the full-length RRE appears to bind four Rev monomers (1) through protein–protein and protein–RNA interactions. Expression of the late viral mRNAs and their protein products depends on Rev-RRE mediated transport; therefore this interaction is critical to the life cycle of HIV-1. Several ligands have been identified (2, 3) that bind tightly to the RBE and compete with the Rev protein. It is expected that interference in the Rev-RBE interaction may disrupt HIV-1 replication. Thus, the RBE is an attractive target for structure-based drug design.
Several NMR studies have examined the solution structure of the RBE, both in the “free” form (4, 5) and in complex with the Rev peptide (5–7). These structural studies have been supplemented by a molecular dynamics simulation of the RBE (8) and combined NMR-molecular dynamics studies of a complex of the Rev peptide with an RNA aptamer selected for high-affinity binding (9). The studies agree that the RBE internal loop forms G-A and G-G noncanonical base pairs separated by a uridine that loops out from the continuous helix into solution. These noncanonical pairs open up the RNA major groove to present a unique binding site for the Rev peptide or protein, which in turn induces a conformational change in the RBE backbone on binding.
Materials and Methods
Design, Synthesis, Purification, and Crystallization.
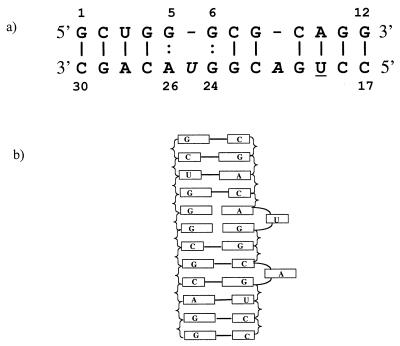
Although the high-affinity RBE originally was identified as a stem-loop structure, the binding later was observed to arise from interaction of the Rev protein with the asymmetric internal loop region of the stem. Because earlier crystallographic studies had indicated that stem-loop structures form dimer duplexes in the crystal, we decided to construct a double helix by annealing 12-mer and 14-mer RNA strands to form the high-affinity RBE containing the asymmetric internal loop and bulged adenosine. The designed RBE duplex is illustrated in Fig. 1a. We verified Rev binding to this duplex through gel retardation experiments using the purified Rev protein (not shown).
Figure 1.
(a) Schematic diagram of strand one 12-mer and strand two 14-mer RNAs that anneal to form the Watson–Crick base pairs indicated by solid vertical lines and the noncanonical base pairs indicated by vertical dots. The underlined U was brominated for crystallographic phasing and the italicized A and U are not base-paired. The four duplexes are numbered 101–130, 201–230, 301–330, and 401–430 with strand one from (1)01-(1)12 and strand two from (1)17-(1)30 for example. This numbering scheme corresponds to that used by Peterson and Feigon (5) for the NMR structure determination of the free RBE. The original numbering system used for the RRE denotes the G-G pair (6–24) as G48-G71 and the G-A (5–26) noncanonical pair as G47-A73. (b) Slab diagram of the RBE double helix indicating the continuous stacking of the core base pairs and the bulged nucleotides A21 and U25.
The RBE RNA was chemically synthesized by Oligos, Etc. (Guilford, CT) as two strands, a 12-mer and a 14-mer. For the brominated derivative, the 14-mer was synthesized with 5-bromouridine (5-BrU) at the third position (residue 19). Oligos were dissolved in 0.1 mM EDTA, mixed in equimolar amounts, and annealed by heating to 65°C for 5 min followed by slow cooling. Purification was by anion exchange (TosoHaas TSK DEAE, Montgomeryville, PA) FPLC column chromatography with a linear salt gradient from 0.4 M to 2.0 M sodium acetate and pH gradient from 100 mM Tris⋅HCl, pH 6.8 to pH 7.3 (10). The RNA peak was collected and concentrated by ethanol precipitation. RNA was resuspended in 0.1 mM EDTA to a concentration of 2 mM, reannealed as described above, and crystallized from 0.1 M sodium cacodylate, pH 6.5, 0.2 M NaCl, 35% 2-methyl-2,4-pentanediol (MPD) (reservoir) using the hanging drop vapor diffusion method combining 1–2 μl RNA with 1 μl reservoir. Clusters of rectangular needles of approximately 100 × 40 × 40 microns appeared after 1–2 days at room temperature.
Data Collection.
The native and 5-BrU RBE crystals were mounted on pins with 100-μm loops and rapidly cooled in liquid nitrogen. The pin then was transferred with a cryotong to a cryostream (Oxford) set at 100°K for data collection. The native crystals diffracted to beyond 2.1 Å on an Area Detector Systems Quantum-4 charge-coupled device with a 1.1-Å x-ray source at beamline 5.0.2 at the Macromolecular Crystallography Facility of the Advanced Light Source (ALS) at Lawrence Berkeley National Laboratory. For the 5-BrU RBE, a fluorescence scan was conducted to identify the energy of absorption peak and inflection point of the Br atom in the crystal. A four-wavelength multiwavelength anomalous diffraction (MAD) data set with initial diffraction limit dmin < 2.1 Å also was collected at beamline 5.0.2 of the ALS. Both native and the 5-BrU RBE data were reduced with the denzo and scalepack programs (11). The cell dimensions, data, and refinement statistics are shown in Table 1.
Table 1.
Crystallographic data and refinement parameters
| RRE crystal→ | Space group P1 | Space group C2 |
|---|---|---|
| No. of duplexes in asymmetric unit | 4 duplexes | 2 duplexes |
| 104 nts | 52 nts | |
| Cell lengths, Å | a = 23.99, b = 53.93, c = 64.73 | a = 105.10, b = 23.99, c = 64.71 |
| Cell angles, ° | α = 114.52, β = 89.88, γ = 102.85 | β = 115.15 |
| Multiplicity | 1.9 | 3.9 |
| Rmerge (last shell) | 0.038 (0.234) | 0.055 (0.321) |
| Completeness (last shell) | 0.95 (0.83) | 0.98 (0.90) |
| Refinement resolution | 20.0–2.1 Å (Fo > 2σFo) | 20.0–2.1 Å (Fo > 2σFo) |
| R factor | 21.81% | 24.44% |
| Rfree | 26.92% | 29.35% |
| Restraint RMSD bonds | 0.0091 Å | 0.0051 Å |
| Restraint RMSD angles | 1.504° | 1.10° |
| Number of RNA atoms | 2,220 (4 duplexes) | 1,110 (2 duplexes) |
| Number of waters, Na+1 | 83 waters/10 sodium ions | 35 waters |
Structure Determination and Refinement.
The structure of the 5-BrU RBE was determined by the MAD method with the solve program (12) (http://www.solve.lanl.gov) with data from only the peak and inflection energies in the four-wavelength MAD data set (details shown in Table 2). The crystal decayed to less than 2.6-Å resolution when the two remote energies were being collected and the data from these two energies were proven to be reducing the quality of the experimental map. The crystal initially was assigned to space group C2. Two Br positions were identified in the initial Patterson search, suggesting two RBE molecules in the asymmetric unit. The MAD phases were improved with solvent flattening and histogram matching with density modification (13) and yielded a map with clear secondary structure and base stacking pattern. The initial model was built with the program o (14) and refined with the program cns (15) against the native RBE data. Torsion angle dynamics-simulated annealing (16) and restrained atomic temperature factor refinement using maximum-likelihood targets were alternated during the course of refinement. The refinement in C2 converged at a relatively high Rfree (Table 1) with some unexplained peaks in the Fo−Fc electron density map. We therefore looked into the possibility that the true symmetry is lower. Attempts to re-reduce the raw images in P1 lowered the Rmerge by 40%, and the low-resolution Rmerge dropped from 0.05 in C2 to 0.03 in P1 (data not shown), supporting the notion that the true space group may be P1. We further constructed the P1 cell with the final C2 model excluding solvent and carried out a test refinement in P1. This test refinement immediately dropped the Rfree from 0.30 to 0.28 and thus confirmed our hypothesis that the true space group should be P1. During the course of refinement in P1, noncrystallographic symmetry restraints were applied between each of two pairs of duplexes of similar structure and gradually were reduced as the refinement proceeded. Waters and sodium ions were added based on magnitude of the electron density peaks and their distance and orientation to the RBE atoms. The Rmerge values, R factors, cell dimensions, and other crystallographic information for space groups C2 and P1 are summarized in Table 1. All results and conclusions described in this manuscript are based on the final refinement in space group P1.
Table 2.
MAD data used for structure determination
| Peak | Inflection point | |
|---|---|---|
| Wavelength, Å | 0.9206 | 0.9208 |
| Resolution | 20–2.3 | 20–2.4 |
| Multiplicity | 7.2 | 7.2 |
| Rmerge (last shell) | 0.068 (0.298) | 0.069 (0.378) |
| Completeness (last shell) | 0.997 (0.969) | 0.997 (0.986) |
Results
The 12-mer and 14-mer RNA oligomers, r-GCUGGGCGCAGG and r-CCUGACGGUACAGC, form antiparallel double helices in the crystal as shown schematically in Fig. 1. These duplexes incorporate a bulged adenosine (A21) and an asymmetric internal loop consisting of two bases (G5, G6) on one strand and three bases on the opposing strand (G24, U25, A26) as depicted in Fig. 1b. Within the internal loop, two noncanonical base pairs, G-G and G-A, are formed, while the intervening U25 residue bulges away from the duplex. The Watson–Crick and noncanonical base pairs stack continuously into an extended double helix.
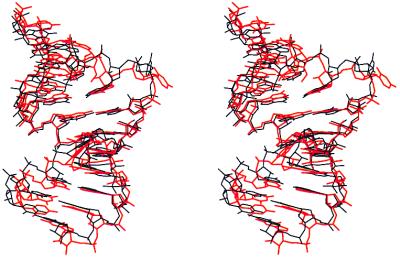
The four unique RBE duplexes in the crystallographic asymmetric unit may be compared by least-squares superposition of their atomic coordinates as summarized in Table 3. Clearly, two conformational variants are present as judged by their rms deviations (RMSDs) in atomic position. Helices 1 and 3 can be classified as type I conformers, whereas helices 2 and 4 are type II conformers. The RMSD between type I and type II helices is approximately 1.6 Å. The greatest differences between these conformers are at the helical ends, the bulged nucleotide U25, and A26 of the noncanonical G-A pair. The presence of four crystallographically independent examples of the high-affinity RBE allows us to verify the observed structural elements and obtain an estimate of the conformational flexibility of the structure. Views of type I and type II duplexes are shown in Fig. 2.
Table 3.
Least-squares superposition of RBE duplexes
| RBE1 | RBE2 | RBE3 | RBE4 | |
|---|---|---|---|---|
| RBE1 | — | 1.438/1.619 | 0.045/0.052 | 1.468/1.652 |
| 4.484 G1(O2′) | 0.192 C2(O2) | 4.603 G1(O2′) | ||
| RBE2 | — | — | 1.447/1.627 | 0.143/0.167 |
| 4.464 G1(O2′) | 0.603 G29(O2′) | |||
| RBE3 | — | — | — | 1.477/1.659 |
| 4.582 G1(O2′) |
Entries correspond to average/rms and maximum deviations between the two duplexes in angstroms. The atoms showing the maximum deviation also are shown. The small deviations between RBE1 and RBE3 and between RBE2 and RBE4 illustrates these conformations are closely related (type I and type II duplexes).
Figure 2.
Stereo view of the least-squares superposition of type I (black) and type II (red) helices viewed perpendicular to the helix axis and into the major groove of the internal loop. The bulged nucleotides A21 and U25 protrude from the helix. The helical axes are bent by ≈17° for type I and ≈8° for type II duplexes.
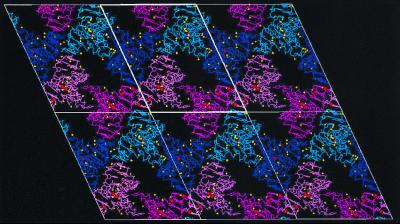
The crystal packing of these four unique duplexes is shown in Fig. 3. Pseudoinfinite helices are formed by the head-to-tail stacking of double helices 1 and 2 and the parallel double helices 3 and 4. These helical stacks are stabilized by side-by-side interactions between duplexes 1 and 3 and between duplexes 2 and 4. The bulged U25 residues from helices 2 and 4 (225, 425) bridge between these side-by-side duplexes by formation of a hydrogen bond to the amino group of G8, whereas U25 from helices 1 and 3 (125, 325) does not make a specific hydrogen bond interaction.
Figure 3.
Crystal packing of the RBE in the P1 space group. The view is down the a* axis into the bc plane with angle α = 114.52°. Duplexes 1 and 3 are dark blue and purple, whereas duplexes 2 and 4 are magenta and pink. Waters and sodium are yellow and red, respectively. Cell axes are white.
The critical feature of the RBE for interaction with the Rev protein is the expanded major groove created by the internal loop. Thus, the bases involved in the noncanonical pairs of the internal loop are highly conserved (17). As previously proposed from biochemical (18) and NMR studies (5), noncanonical G-G and G-A base pairs are observed in each of the RBE duplexes of the crystal structure. Surprisingly, in the crystal structure of the unbound RBE, the major groove is not expanded, relative to an A-form double helix (P-P distance across groove ≈ 10 Å). The distance across the major groove at the internal loop is 8.8–9.8 Å in type I duplexes, whereas in type II duplexes the width of the major groove is 10.1–10.6 Å at the internal loop.
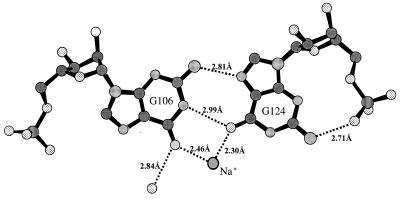
The noncanonical base pairing formed in the internal loop between residues G6 and G24 is shown in Fig. 4. These base pairs are characterized by two base-base hydrogen bonds, G6(N2)-G24(N7) and G6(N1)-G24(O6), and the intraresidue base-backbone hydrogen bond G24(N2)-G24(O1P). To achieve these H bonds, G24 is flipped around its glycosyl bond into a syn conformation, in agreement with NMR evidence (5). Guanosine nucleotides and nucleosides are known to have a preference for the syn conformation relative to the other bases (19). This has been attributed to van der Waals and electrostatic interactions between the two-amino group and the 5′ phosphate as observed in our structure. This type of G-G base pairing is present in all four duplexes as clearly indicated in the experimental (MAD) and final 2Fo−Fc electron density maps as well as simulated annealing omit maps (not shown). The mode of G-G base pairing observed in the crystal contrasts with the symmetric G-G pairing proposed for the NMR model of the free RBE (5) that uses hydrogen bonding between N1G and O6G of each guanosine to the other.
Figure 4.
Noncanonical base pairing between G6 and G24 observed in both type I and type II duplexes in the crystal (G106-G124 shown). All four examples of RBE show essentially identical base pairing between these guanines. Different atom types are shaded for identification: carbon (solid gray), nitrogen (densely dotted), oxygen (sparsely dotted), phosphorus (vertical lines); a sodium ion is outlined by a bold circle and labeled. Hydrogen bonds are indicated with dashed lines and distances are in Å.
Two structural parameters useful in understanding how noncanonical base pairs can be incorporated into an RNA duplex are the C1′-C1′ distance and the (lambda) angle of the glycosyl bonds relative to the C1′-C1′ vector (20). The C1′-C1′ distance for the G-G base pairs is very constant among the four duplexes, 11.23–11.28 Å, compared with 10.5 Å for Watson–Crick pairs. The difference in orientation of the glycosyl bonds relative to the C1′-C1′ vector is a measure of the base pair symmetry. For Watson–Crick base pairs this difference is near 0°, whereas for the G-G pairs the difference in angle is ≈27° for type I duplexes and ≈33° for type II duplexes.
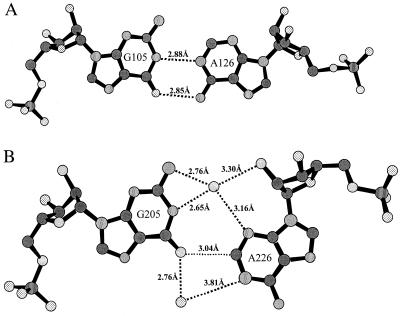
The other noncanonical base pair formed in the RBE internal loop is between G5 and A26. As shown in Fig. 5, the conformation of this base pair differs significantly between type I and type II duplexes. In the type I helices (nos. 1 and 3), the G-A base pairs form hydrogen bonds between G5(N1)-A26(N1) and G5(O6)-A26(N6). This imino base pairing was observed in the NMR structures of the free RBE (5) and the complex of RBE and the Rev peptide (7). The C1′-C1′ distances for the type I helices are 12.70 Å, and the small difference in glycosyl orientation of 2–3° indicates a symmetric orientation.
Figure 5.
Noncanonical base pairing between G5 and A26. (A) Type I duplexes (105–126 shown) contain these standard imino G-A pairs and agree with NMR observations of both the free and peptide bound forms. (B) Type II duplexes (205–226 shown) contain novel water-mediated G-A base pairs and a potential C-H⋅⋅O hydrogen bond. Atom types and hydrogen bonds are as in Fig. 4, except the C-H⋅⋅O hydrogen bond is indicated by a dotted line.
In the G-A base pairs of the type II conformers (duplexes 2 and 4), A26 is shifted toward the major groove and the hydrogen bonding to G5 is mediated by bridging water molecules. A potential C-H⋅⋅O hydrogen bond is formed between C2(A26) and O6(G205). The distance between these atoms for A226 and G205 is 3.04 Å whereas the distance between A426 and G405 is only 2.90 Å. The C1′-C1′ distance is 11.3 Å, more than an angstrom shorter than the type I conformers and the glycosyl bond orientations differ by over 50°, with the adenosine angle being over 90° relative to the C1′-C1′ vector.
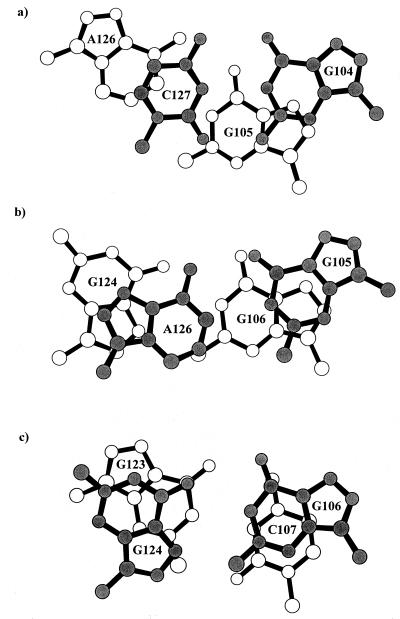
Stacking interactions between the G-A and G-G pairs and their Watson–Crick C-G neighbors in duplex 1 are shown in Fig. 6. Fig. 6a shows that A126 of the G-A pair is largely unstacked on the 3′ side, with C127 and its partner G104 stacking above G105. The stacking between the G-A and G-G pairs is shown in Fig. 6b. The six-member ring of G105 stacks over the five-member ring of G106 whereas the two five-member rings of G124 and A126 overlap. The most extensive stacking is between G106-G124 and C107-G123 as shown in Fig. 6c. The lack of stacking of A126 of the G-A pair with its Watson–Crick neighbor and the resulting freedom may be reflected in the relatively large mobility of the adenine (see below) of the G-A pair and relevant to the conformational variation observed for this base pair between type I and type II duplexes.
Figure 6.
Stacking interactions between base pairs in and around the duplex 1 RBE internal loop viewed perpendicular to the base pair plane. (a) G104-C127 and G105-A126. (b) G105-A126 and G106-G124. (c) G106-G124 and C107-G123.
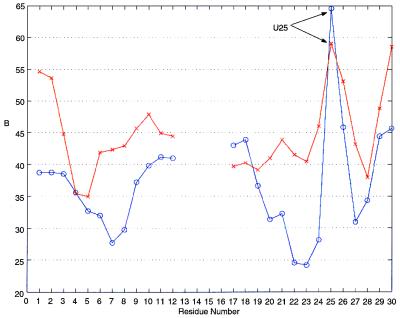
The flexibility of the RBE duplexes in the crystal is illustrated in the plot of average residue mobility (crystallographic B factor) versus residue for type I and type II duplexes shown in Fig. 7. The internal loop guanosines in strand 1 are less mobile than the Watson–Crick helical ends, whereas the bulged U25 of strand 2 is the most mobile residue and appears to increase the mobility of A26 immediately after it. Interestingly, the bulged A21 is not significantly more flexible than the Watson–Crick residues around it. The combination of the flexible bulged U25 and the unstacked A26 may be the basis for the conformational variation in G-A base pairing between type I and type II helices and may be necessary for the conformational change occurring on binding of the Rev protein or peptide. Despite the overall greater flexibility of type II duplexes (as judged by B factor and weaker MAD electron density), U25 specifically is less mobile in type II than in type I helices as shown in Fig. 7, because of different intermolecular contacts in the crystal. The base of U25 in type I helices is fully exposed to bulk solvent without any constraints from nearby atoms, whereas in type II duplexes it is hydrogen-bonded via its O4 atom with N2 of G8 from another type II duplex in the unit cell.
Figure 7.
Plot of the residue-averaged crystallographic B factor (thermal or mobility parameter) versus residue. The blue lines (circles) correspond to duplex 1 (type I) and the red lines (crosses) correspond to duplex 2 (type II).
In both type I and type II duplexes, the torsion angles of strand 1 (i.e., residues 1–12) are near regular A-form values. In contrast, strand 2 shows large variation in the torsion angles outside of the Watson–Crick regions. This may reflect the energetic stability of an A-form conformation for a single strand, thus requiring the longer strand of the asymmetric internal loop to mold to this conformation as base pairs are formed. All sugar puckers are variants of the standard A-form C3′-endo conformation except G24 in type I helices (C1′-exo) and G24 and U25 in type II helices (C4′-exo). The first of these may be coupled to the syn conformation of G24 around the glycosyl bond.
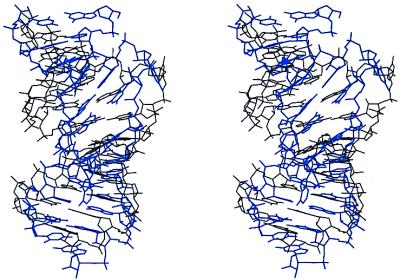
The NMR structure (5) (Protein Data Bank code 1EBR) of the unbound RBE was determined under solution conditions [10 mM sodium phosphate (pH 6.0), 100 mM NaCl] similar to those used in growing our crystals. Comparison of the free RBE NMR (Protein Data Bank code 1EBR, model 1) structure with duplex 1 of the crystal structure illustrates a large difference between the two models (average deviation 4.61 Å, RMSD 5.27 Å) as shown in Fig. 8. The crystal structure is shorter (31.0 Å vs. 33.9 Å) and wider than the NMR model. This difference is seen in the lower average inclination of the base pairs to the helix axis in the crystal structure (7.7°) vs. the NMR structure (16.4°) and may be attributed to the difference in G-G pairing and to the modeling algorithms used in the NMR structure analysis. Because of broadening and loss of intensity of nuclear Overhauser effect spectroscopy cross-peaks for the internal loop, it was proposed (5) that this region is fluctuating between alternate conformations in the free form of the RBE. It is clear, however, from the NMR data that U25 is looped out of the helix, G24 and A26 are stacked, and G24 is in a syn conformation in the unbound RBE, all in agreement with our crystal structure.
Figure 8.
Stereo view of the superposition of a type I RBE duplex (101–130 shown) from the crystal structure and the NMR model of the unbound RBE (5). The RBE model from the crystal structure is in black and the NMR model is in blue. The view is perpendicular to the helix axis.
The minimized average NMR model of the RBE bound to the Rev peptide (Protein Data Bank code 1ETF) (7) differs from the crystal structure of the unbound form (type I) by an average and rms displacement of 3.7 Å and 4.4 Å, respectively. Comparing the peptide-bound RBE model to the crystal structure of the unbound RBE, it appears clear that on binding G24 assumes an anti conformation after a backbone flip at G24; the major groove is widened as the G6-G24 base pair reorients to form a symmetric base pair; and the G5-A26 base pair becomes more ordered.
Discussion
The crystal structure of the high-affinity RBE gives us insight into the unbound form of this critical regulatory element in the HIV-1 life cycle. Previous structural studies of the unbound RBE RNA by NMR methods (5) qualitatively agree with our structure, but because of the flexibility within the internal loop, detailed data were not available and the resulting model differs significantly from the crystal structure. The four unique duplexes identified in the crystal also reflect the mobility of the molecule, but define both the local and global structure at 2.1-Å resolution. The major differences between the crystal and NMR structures of the free RBE are the type of base pairing found in the noncanonical G-G pair that is critical in widening the groove for protein binding and in the overall shape and dimensions of the double helix.
A G-G base-pairing motif similar to that observed in the crystal structure has been proposed for the RBE based on molecular modeling and dynamics simulations (8). This study emphasized the importance of sodium ions in formation of the noncanonical pairs in analogy to arginine of the Rev-RRE complex. Ten sodium ions were identified in the crystal structure, two bound to type I duplexes (one to each) and eight bound to type II duplexes (four to each). Of these 10 localized sodium ions, six were bound to nucleotide bases and four to the backbones of the double helices.
The G-G N1-carbonyl, N7-amino base pairing motif observed in the RBE crystal structure has been previously observed in RNA and DNA oligonucleotides. NMR methods have been used to identify this G-G base pair in an RNA aptamer-AMP complex (21, 22) and aptamer-arginine and citrulline complexes (23) generated by the selex method. This asymmetric G-G base-pairing scheme also is found in the guanine tetrads of tetraplex telomeric DNA. In fold-back antiparallel tetraplexes, the guanines alternate syn and anti glycosyl structure (24, 25), whereas in parallel-stranded tetraplexes all guanines are in the anti conformation (26). Sodium ions also bind and stabilize these guanosine tetrads.
The G-A imino base pair formed by two hydrogen bonds (type I RBE duplex) is one of the most commonly observed noncanonical pairs (27). The type II G-A pair, with only water-mediated and C-H⋅⋅O hydrogen bonding, has not been previously observed. An unusual G-A pair with only one direct carbonyl-amino hydrogen bond and a single water-mediated hydrogen bond was seen in the crystal structure of 5S rRNA loop E (28), immediately adjacent to a G-G base pair.
The crystal structure presented here suggests a more extensive conformational change occurs on Rev protein (peptide) binding than implied by the NMR model of the unbound RBE. The NMR model of the unbound RBE included the same symmetric G-G base-pairing found in the RBE complex with the Rev peptide. In both type I and II duplexes of the crystal structure, a very different asymmetric G-G base-pairing, which must be opened and reformed to arrive at the peptide bound model, is observed. The conformational change that occurs between the free and peptide-bound forms of the RBE may be facilitated by the highly mobile (as judged by temperature factor) bulged U25 residue and the flexibility of A26 in forming the G-A pair (as observed in the type I and II duplexes). The longer C1′-C1′ distance (12.7 Å) for the symmetric G-G pair in the peptide-bound RBE compared with the asymmetric pair in the unbound form (11.2 Å) can contribute to widening of the groove on peptide binding. Also, a significant change in helical twist between the G-G and G-A base pairs is observed with peptide binding. The base-base twist angles between G24 and G26 are 89.3° for duplex 1 of the crystal structure and −31.6° for the peptide bound RBE (Protein Data Bank code 1ETF).
The high-resolution crystal structure of the high-affinity Rev binding site of the HIV-1 RRE provides an excellent target for both identifying novel ligands as potential drugs and also for designing improved ligands based on compounds known to bind RBE. These include the aminoglycoside antibiotics (2, 29–31), diphenylfurans (3), and peptides (32, 33).
During review of this manuscript, the crystal structure of another RNA duplex incorporating the core RBE sequence was published (34). This structure, at 1.6-Å resolution, has only one duplex in the asymmetric unit and therefore reveals only a single conformation. The conformation observed in this structure agrees very well with our type I duplex, confirming the base-pairing scheme and even the water binding pattern we have observed.
Acknowledgments
We gratefully acknowledge the assistance of Dr. T. Earnest. This work was supported by National Institutes of Health Grant GM 4921501 to S.R.H. Facilities and equipment were provided through support of the Office of Energy Research, Office of Health and Environmental Research, Health Effects Research Division of the U.S. Department of Energy. Diffraction data were collected at the Macromolecular Crystallography Facility (MCF) using beamline 5.0.2 of the Advanced Light Source synchrotron at Lawrence Berkeley National Laboratory. This facility is principally funded by the Office of Biological and Environmental Research of the U.S. Department of Energy Offices with contributions from Lawrence Berkeley National Laboratory, Amgen, Roche Biosciences, the University of California, Berkeley, and Lawrence Livermore National Laboratory.
Abbreviations
- RRE
Rev response element
- RBE
Rev binding element
- MAD
multiwavelength anomalous diffraction
- RMSD
rms deviation
- 5-BrU
5-bromouridine
Footnotes
This paper was submitted directly (Track II) to the PNAS office.
Data deposition: The refined coordinates of the RBE duplexes have been deposited in the Nucleic Acid Database, Department of Chemistry, Rutgers, The State University of New Jersey, Piscataway, NJ 08854, http://ndbserver.rutgers.edu (NDB structure ID code AR0028) and in the Protein Data Bank, www.rcsb.org (PDB code 1DUQ).
Article published online before print: Proc. Natl. Acad. Sci. USA, 10.1073/pnas.090588197.
Article and publication date are at www.pnas.org/cgi/doi/10.1073/pnas.090588197
References
- 1.Van Ryk D I, Venkatesan S. J Biol Chem. 1999;274:17452–17463. doi: 10.1074/jbc.274.25.17452. [DOI] [PubMed] [Google Scholar]
- 2.Zapp M L, Stern S, Green M R. Cell. 1993;74:969–978. doi: 10.1016/0092-8674(93)90720-b. [DOI] [PubMed] [Google Scholar]
- 3.Ratmeyer L, Zapp M L, Green M R, Vinayak R, Kumar A, Boykin D W, Wilson W D. Biochemistry. 1996;35:13689–13696. doi: 10.1021/bi960954v. [DOI] [PubMed] [Google Scholar]
- 4.Peterson R D, Bartel D P, Szostak J W, Horvath S J, Feigon J. Biochemistry. 1994;33:5357–5366. doi: 10.1021/bi00184a001. [DOI] [PubMed] [Google Scholar]
- 5.Peterson R D, Feigon J. J Mol Biol. 1996;264:863–877. doi: 10.1006/jmbi.1996.0683. [DOI] [PubMed] [Google Scholar]
- 6.Battiste J L, Tan R, Frankel A D, Williamson J R. J Biomol NMR. 1995;6:375–389. doi: 10.1007/BF00197637. [DOI] [PubMed] [Google Scholar]
- 7.Battiste J L, Mao H, Rao N S, Tan R, Muhandiram D R, Kay L E, Frankel A D, Williamson J R. Science. 1996;273:1547–1551. doi: 10.1126/science.273.5281.1547. [DOI] [PubMed] [Google Scholar]
- 8.Le S-Y, Pattabiraman N, Maizel J V., Jr Nucleic Acids Res. 1994;22:3966–3976. doi: 10.1093/nar/22.19.3966. [DOI] [PMC free article] [PubMed] [Google Scholar]
- 9.Ye X, Gorin A, Ellington A D, Patel D J. Nat Struct Biol. 1996;3:1026–1033. doi: 10.1038/nsb1296-1026. [DOI] [PubMed] [Google Scholar]
- 10.Kim R, Holbrook E L, Jancarik J, Kim S-H. BioTechniques. 1995;18:992–994. [PubMed] [Google Scholar]
- 11.Otwinowski Z. In: Proceedings of the CCP4 Study Weekend: Data Collection and Processing. Sawyer L, Isaacs N, Bailey S, editors. Warrington, U.K.: SERC Daresbury Laboratory; 1993. pp. 56–62. [Google Scholar]
- 12.Terwilliger T C, Berendzen J. Acta Crystallogr D. 1999;55:849–861. doi: 10.1107/S0907444999000839. [DOI] [PMC free article] [PubMed] [Google Scholar]
- 13.Cowtan K D, Zhang K Y. Prog Biophys Mol Biol. 1999;72:245–270. doi: 10.1016/s0079-6107(99)00008-5. [DOI] [PubMed] [Google Scholar]
- 14.Jones T A, Zou J-Y, Cowan S W, Kjeldgaard M. Acta Crystallogr A. 1991;47:110–119. doi: 10.1107/s0108767390010224. [DOI] [PubMed] [Google Scholar]
- 15.Brunger A T, Adams P D, Clore G M, DeLano W L, Gros P, Grosse-Kunstleve R W, Jiang J S, Kuszewski J, Nilges M, Pannu N S, et al. Acta Crystallogr D. 1998;54:905–921. doi: 10.1107/s0907444998003254. [DOI] [PubMed] [Google Scholar]
- 16.Rice L, Brunger A. Proteins. 1994;19:277–290. doi: 10.1002/prot.340190403. [DOI] [PubMed] [Google Scholar]
- 17.Giver L, Bartel D, Zapp M, Pawul A, Green M, Ellington A D. Nucleic Acids Res. 1993;21:5509–5516. doi: 10.1093/nar/21.23.5509. [DOI] [PMC free article] [PubMed] [Google Scholar]
- 18.Bartel D P, Zapp M L, Green M R, Szostak J W. Cell. 1991;67:529–536. doi: 10.1016/0092-8674(91)90527-6. [DOI] [PubMed] [Google Scholar]
- 19.Sanger W. Principles of Nucleic Acid Structure. New York: Springer; 1984. [Google Scholar]
- 20.Hunter W N, Brown T, Anand N N, Kennard O. Nature (London) 1986;320:552–555. doi: 10.1038/320552a0. [DOI] [PubMed] [Google Scholar]
- 21.Jiang F, Fiala R, Live D, Kumar R A, Patel D J. Biochemistry. 1996;35:13250–13266. doi: 10.1021/bi961345q. [DOI] [PubMed] [Google Scholar]
- 22.Dieckmann T, Suzuki E, Nakamura G K, Feigon J. RNA. 1996;2:628–640. [PMC free article] [PubMed] [Google Scholar]
- 23.Yang Y, Kochoyan M, Burgstaller P, Westhof E, Famulok M. Science. 1996;272:1343–1347. doi: 10.1126/science.272.5266.1343. [DOI] [PubMed] [Google Scholar]
- 24.Kang C-H, Zhang X, Ratliff R, Moyzis R, Rich A. Nature (London) 1992;356:126–131. doi: 10.1038/356126a0. [DOI] [PubMed] [Google Scholar]
- 25.Smith F, Feigon J. Nature (London) 1992;356:164–168. doi: 10.1038/356164a0. [DOI] [PubMed] [Google Scholar]
- 26.Phillips K, Dauter Z, Murchie A I H, Lilley D M J, Luisi B. J Mol Biol. 1997;273:171–182. doi: 10.1006/jmbi.1997.1292. [DOI] [PubMed] [Google Scholar]
- 27.Nagaswamy U, Voss N, Zhang Z, Fox G E. Nucleic Acids Res. 2000;28:375–376. doi: 10.1093/nar/28.1.375. [DOI] [PMC free article] [PubMed] [Google Scholar]
- 28.Correll C C, Freeborn B, Moore P B, Steitz T A. Cell. 1997;91:705–712. doi: 10.1016/s0092-8674(00)80457-2. [DOI] [PubMed] [Google Scholar]
- 29.Cho J, Rando R R. Biochemistry. 1999;38:8348–8354. [Google Scholar]
- 30.Wang Y, Hamasaki K, Rando R R. Biochemistry. 1997;36:768–779. doi: 10.1021/bi962095g. [DOI] [PubMed] [Google Scholar]
- 31.Park W K C, Auer M, Jaksche H, Wong C-H. J Am Chem Soc. 1996;118:10150–10155. [Google Scholar]
- 32.Harada K, Martin S S, Tan R, Frankel A D. Proc Natl Acad Sci USA. 1997;94:11887–11892. doi: 10.1073/pnas.94.22.11887. [DOI] [PMC free article] [PubMed] [Google Scholar]
- 33.Tan R, Frankel A D. Biochemistry. 1994;33:14579–14585. doi: 10.1021/bi00252a025. [DOI] [PubMed] [Google Scholar]
- 34.Ippolito J A, Steitz T A. J Mol Biol. 2000;295:711–717. doi: 10.1006/jmbi.1999.3405. [DOI] [PubMed] [Google Scholar]


