Abstract
Objective
To determine the efficacy of the Mortality in Emergency Department Sepsis (MEDS) score in the stratification of patients who presented to the emergency department (ED) with severe sepsis.
Methods
Adults who presented to the ED with severe sepsis were retrospectively recruited and divided into group A (MEDS score <12) and group B (MEDS score ⩾12). Their outcomes were evaluated with 28 day hospital mortality rate, length of hospital stay, Kaplan‐Meier survival analysis, and receiver operating characteristic (ROC) analysis. Discriminatory power of the MEDS score in mortality prediction was further compared with the Acute Physiology and Chronic Health Evaluation (APACHE) II model.
Results
In total, 276 patients (44.6% men and 55.4% women) were analysed, with 143 patients placed in group A and 133 patients in group B. Patients with MEDS score ⩾12 had a significantly higher mortality rate (48.9% v 17.5%, p<0.01) and higher median APACHE II score (25 v 20 points, p<0.01). Significant difference in mortality risk was also demonstrated with Kaplan‐Meier survival analysis (log rank test, p<0.01). No difference in the length of hospital stay was found between the groups. ROC analysis indicated a better performance in mortality prediction by the MEDS score compared with the APACHE II score (ROC 0.75 v 0.62, p<0.01).
Conclusion
Our results showed that mortality risk stratification of severe sepsis patients in the ED with MEDS score is effective. The MEDS score also discriminated better than the APACHE II model in mortality prediction.
Keywords: intensive care unit, mortality, risk‐stratification, sepsis
Despite advances in diagnostic and therapeutic intervention, the mortality rate associated with sepsis remains high, especially among those who develop shock and/or organ dysfunction.1 The estimated mortality of severe sepsis has been reported as 25–56%.1,2,3,4,5 Lundberg et al6 showed that for patients with septic shock, delays in treatments with intravenous fluid boluses or inotropic agents were associated with an increased mortality. Rivers et al7 also showed that prior to admission to the intensive care unit (ICU), goal directed therapy aimed at normalising haemodynamic parameters and reversing tissue hypoxia significantly decreases morbidity and mortality in patients with severe sepsis and septic shock.
As many patients with severe sepsis initially present to the emergency department (ED), a sepsis severity model that helps in the stratification of high risk patients in the ED may improve morbidity and mortality. However, outcome studies of sepsis in the ED are limited.8 Several severity score systems have been developed for use in the ICU. These include the Acute Physiology and Chronic Health Evaluation (APACHE), APACHE II, APACHE III, Simplified Acute Physiology Score (SAPS), SAPS II, Sequential Organ Failure Assessment (SOFA), and the Mortality Probability Model (MPM).9,10,11,12,13,14 Such ICU models tend to be complicated, and their use in the ED is therefore impractical. Shapiro et al15 developed a quick and simple alternative prediction rule, the Mortality in Emergency Department Sepsis (MEDS) score, which can be used at the bedside to rapidly identify the patients with potential sepsis at risk of death. Our study aimed to determine the efficacy of this ED derived risk model (MEDS score) in identifying individuals with the highest mortality risk when applied to ED patients with severe sepsis.
METHODS
This was a retrospective non‐interventional cohort study conducted in a 900 bed urban medical centre with an adult ICU bed capacity of 60 and approximately 75 000 ED visits annually.
Term definitions used in this study
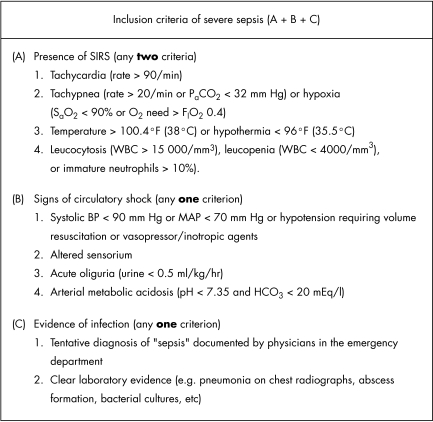
Systemic inflammatory response syndrome (SIRS) was defined as the presence of two or more of the following: (a) tachycardia (rate >90 beats/min); (b) tachypnoea (rate >20 breaths/min) or hypoxia (oxygen saturation <90% or need for oxygen supplementation of 0.4 FIO2 or higher to maintain adequate saturation; (c) hyperthermia >100.4°F (38°C) or hypothermia <96°F (35.5°C); and (d) leucocytosis (white cells >15 000/mm3), leucopenia (white cells<4000/mm3), or differential cell count with immature neutrophils >10%. Sepsis was defined as SIRS with suspected infection based on treating physician's documentation and/or laboratory results (such as pneumonia on chest radiographs, abscess formation, and bacterial cultures) Severe sepsis was defined as sepsis with organ dysfunction that required immediate ICU admission according to the following operational definitions: hypotension, altered sensorium, acute oliguria, and arterial metabolic acidosis (fig 1).
Figure 1 The inclusion criteria. A standard data collection sheet for defining “severe sepsis” using clinical data available in the emergency department. All data were collected from medical records of the emergency department before ICU admission. WBC, white blood cell count; MAP, mean arterial pressure.
Term definitions used in the MEDS score system
The MEDS score comprised of nine independent correlates of mortality: terminal illness, age older than 65 years, tachypnoea or hypoxia, septic shock, low platelet count, bandaemia, nursing home residence, lower respiratory infection, and altered mental status. Septic shock was defined as sepsis plus hypotension (systolic blood pressure <90 mmHg) that persisted after an initial bolus of 20–30 ml/kg of crystalloids. A terminal illness was defined as diffuse metastatic cancer. Respiratory difficulty was defined as the presence of any of the following: tachypnoea (respiratory rate >20 breaths/min or PaCO2 <32 mm Hg), hypoxaemia (pulse oximetry <90%), or the need for oxygen supplementation by face mask, or 100% nonrebreather equipment or intubation required to maintain adequate oxygenation. Altered mental status was defined as a recent change in sensorium (confusion, disorientation, drowsiness, obtundation, stupor, or coma) by history or physical examination. Low platelet count was defined as <150 000 platelets/mm3. Bandaemia was defined as immature neutrophil count of >5%.
Study population and study design
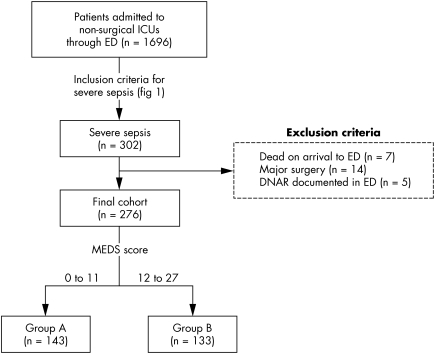
All adult patients (age >18 years) admitted to non‐surgical ICUs through the ED between 1 January 2002 and 31 December 2003 were recruited from a central computerised database. Subsequently, a standard data collection checklist (fig 1) defining “severe sepsis” was used to decide on the final study population. The following were excluded from the study: patients dead on arrival to the ED, pregnant patients, those with major or multiple trauma, those with major surgery prior to ICU admission, and those with terminal illnesses who had "do not attempt resuscitation" (DNAR) orders documented by treating physicians in the ED. The study protocol was approved by our institutional review board. The enrolment process of this study is shown in fig 2.
Figure 2 Patient enrolment and group allocation. ICU, intensive care unit; ED, emergency department; MEDS, Mortality in Emergency Department Sepsis; DNAR, do not attempt resuscitation.
Detailed information of patients in the final cohort was obtained retrospectively after patient discharge through medical record abstraction by one of two physicians with extensive experience in chart review procedures. Patient demographics, past history, and APACHE II score were taken from the ICU admission notes. Initial and extreme values of vital signs (temperature, blood pressure, heart rate, respiratory rate, and oxygen saturation) over a patient's time in the ED were recorded from both the physician and nursing notes. Laboratory data available prior to ICU admission were also recorded, which included leukocyte count, differential cell count, platelets, electrolytes, creatinine, chest radiograph, and arterial blood gases. Finally, any morbidity or mortality that occurred during the hospital stay was also recorded. The MEDS score for each patient was then retrospectively calculated using clinical and laboratory data documented in medical records from the ED. The nine variables (and assigned points) used for MEDS score calculation are as follows: terminal illness (6 points), age older than 65 years (3 points), tachypnoea or hypoxia (3 points), septic shock (3 points), low platelet count (3 points), bandaemia (3 points), nursing home residence (2 points), lower respiratory infection (2 points), and altered mental status (2 points). In its original design, a MEDS score of 0–4 points indicated very low risk; 5–7 points, low risk; 8–12 points, moderate risk; 12–15 points, high risk; and 16 or more points, very high risk. A cut off score of ⩾12 points was used in our study to identify severe sepsis patients with high and very high mortality risk, as suggested by Shapiro et al15 in their primary design.
Outcome evaluation and statistical analysis
Enrolled patients were divided into two distinct groups according to the assigned MEDS score: group A (MEDS score <12) and group B (MEDS score 12–27). The following statistical methods were used for evaluation: 28 day hospital mortality rate, total length of stay in hospital, Kaplan‐Meier survival analysis, and receiver operating characteristic (ROC) analysis. Performances in mortality prediction of the MEDS score and the APACHE II score were also compared using the area under ROC curve. Continuous variables were presented as mean (SD) or median (25th to 75th interquartile range) and compared using the independent samples t test (assuming normal distribution) or the Mann‐Whitney and Wilcoxon tests (assuming non‐normality). To obtain 80% study power (β = 0.20) at α<0.05 level (two tailed) of significance, it was precalculated that at least 90 patients per group had to be enrolled to detect a 25% difference in the mortality between the two groups. Categorical variables were compared using the χ2 test. All analyses were performed on SPSS 10.0 for Windows. Statistical significance was set at p<0.05 (two tailed). The ROC curve plots the false positive rate (1−specificity) on the x axis and the true positive rate (sensitivity) on the y axis. The larger the ROC area, the more accurate the prediction model.
RESULTS
During the study period, 1696 adult patients were admitted to non‐surgical ICUs through the ED, of whom 302 had “severe sepsis” as defined by our inclusion criteria (fig 1). There were 26 patients excluded from the study because they were dead on arrival to the ED (n = 7), had recent major surgery (n = 14), or had documented DNAR orders from the ED (n = 5). The final study cohort consisted of 276 patients; 123 men (44.6%) and 153 women (55.4%). The mean (SD) age of the study population was 72 (15.6) years. The pulmonary system was the single most common site of infection (49.2%) followed by the urinary tract (28.9%). The cohort was divided into two risk groups according to their calculated MEDS scores: 143 (51.8%) patients were placed in group A (MEDS score <12) and 133 (48.2%) patients were placed in group B (MEDS score 12–27). A flow diagram illustrating patient enrollment and group allocation is shown (fig 2).
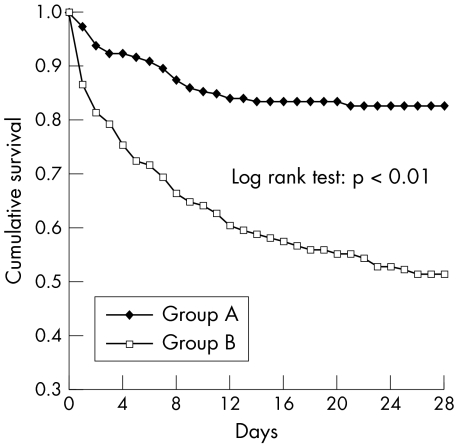
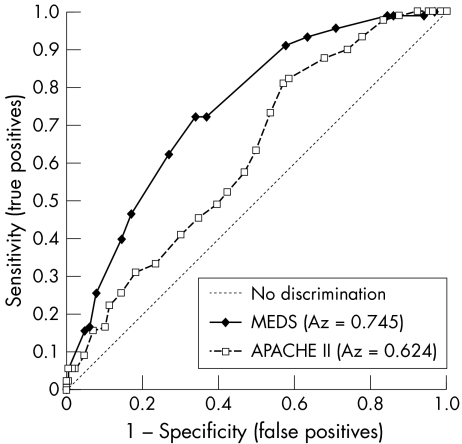
The general characteristics of both risk groups are summarised in table 1. We found that patients with a MEDS score of ⩾12 (group B) had a significantly higher 28 day mortality rate (48.9% v 17.5%, p<0.01) and higher median APACHE II score (25 v 20 points, p<0.01). No difference in the median length of hospital stay was found between the groups (14 and 13 days respectively). Detailed comparison of MEDS correlates between the groups is shown in table 2. The Kaplan‐Meier curves of survival analysis illustrate significant difference between the two groups (fig 3; log rank test 31.09, p<0.01). ROC analysis showed a better discriminatory performance by the MEDS score than by the APACHE II model (fig 4; ROC area 0.75 v 0.62, p<0.01).
Table 1 Characteristics of groups A and B.
| Group A (n = 143) | Group B (n = 133) | p | ||||
|---|---|---|---|---|---|---|
| Age, mean (SD) | 66.9 (17.6) | 77.4 (10.7) | <0.01 | |||
| Men, % | 38.5 % | 51% | <0.05 | |||
| Cerebrovascular disease, % | 23.1 % | 33.0% | 0.06 | |||
| Diabetes, % | 35.0 % | 31.6% | 0.55 | |||
| Liver cirrhosis, % | 7.0 % | 10.5% | 0.30 | |||
| COPD, % | 14.7 % | 19.5% | 0.28 | |||
| Blood temperature, mean (SD) | 37.2 (3.3) | 37.4 (1.5) | 0.47 | |||
| Heart rate, mean (SD) | 108.9 (25.6) | 113.1 (23.3) | 0.16 | |||
| Respiratory rate, mean (SD) | 21.8 (5.6) | 23.1 (5.9) | 0.07 | |||
| Systolic BP, mean (SD) | 105.7(89.8) | 108.4 (28.3) | 0.74 | |||
| pH, mean (SD) | 7.42 (0.10) | 7.39 (0.13) | 0.05 | |||
| HCO3, mean (SD) | 19.4 (7.3) | 19.1 (7.2) | 0.72 | |||
| WBC×103, mean (SD) | 15.17 (8.62) | 14.91 (9.64) | 0.82 | |||
| Bandaemia %, mean (SD) | 13.0 (25.8) | 14.3 (15.3) | 0.61 | |||
| Haematocrit, mean (SD) | 34.4 (7.2) | 33.4 (7.0) | 0.26 | |||
| Platelet×103, mean (SD) | 205.7 (100.9) | 170.4 (105.9) | <0.01 | |||
| Mortality, % | 25 (17.5%) | 65 (48.9%) | <0.01 | |||
| APACHE II score | ||||||
| Mean (SD) | 20.8 (7.1) | 25.0 (6.4) | <0.01 | |||
| Median* | 20 (15 to 27) | 25 (20.5 to 29) | <0.01 | |||
| Length of hospital stay (days) | ||||||
| Mean (SD) | 22.1 (19.8) | 21.1 (23.3) | 0.70 | |||
| Median* | 14 (8 to 32) | 13 (4 to 32) | 0.10 |
Group A, MEDS score <12; group B, MEDS score 12–27; APACHE, Acute Physiology and Chronic Health Evaluation; MEDS, Mortality in Emergency Department Sepsis; COPD, chronic obstructive pulmonary disease; BP, blood pressure, WBC, white blood count. *25th to 75th percentile.
Table 2 Comparison of MEDS correlates between groups A and B.
| Group A (n = 143) | Group B (n = 133) | p | ||||
|---|---|---|---|---|---|---|
| Terminal illness | 7.7% | 26.3% | <0.01 | |||
| Altered mental status | 48.3% | 84.2% | <0.01 | |||
| Nursing home resident | 5.1% | 18.8% | <0.01 | |||
| Septic shock | 49.0% | 70.0% | <0.01 | |||
| Respiratory difficulty | 44.1% | 93.2% | <0.01 | |||
| Age >65 years | 60.1% | 93.2% | <0.01 | |||
| Bandaemia >5% | 50.3% | 67.0% | <0.01 | |||
| Platelets <15 000/mm3 | 27.3% | 55.6% | <0.01 | |||
| Lower RTI | 48.3% | 84.2% | <0.01 |
Group A, MEDS score <12; group B,MEDS score = 12–27. RTI, respiratory tract infection
Figure 3 Kaplan‐Meier Survival curves for groups A (MEDS score <12) and B (MEDS score 12–27).
Figure 4 Comparison of the receiver operating characteristic (ROC) curves of the MEDS and APACHE II scores in mortality prediction. Az, area under the ROC curve; MEDS, Mortality in Emergency Department Sepsis; APACHE, Acute Physiology and Chronic Health Evaluation.
DISCUSSION
One of the limitations of outcome studies of sepsis in the ED is the inconsistency in the definition of sepsis, SIRS, severe sepsis, and septic shock.16 Conventionally, severe sepsis is defined as sepsis plus either organ dysfunction or evidence of hypoperfusion or hypotension. However, a technical definition of severe sepsis in a pre‐ICU department based on ICU parameters (such as cardiac index, systemic vascular resistance, pulmonary capillary wedge pressure, or right atrial pressure) or specific blood tests (such as procalcitonin, C‐reactive protein, or lactate) was impractical in our study, as most of these data were not routinely available during the patient's stay in the ED. Therefore, a constellation of symptoms and clinical data obtainable in the ED was used to define severe sepsis: hypotension, altered sensorium, acute oliguria, and arterial metabolic acidosis (fig 1). Another limitation of outcome studies of sepsis in the ED is the lack of an agreed severity scoring system for sepsis patients.8 The MEDS score is similar in concept to the previously reported scoring systems such as the APACHE, APACHE II and III, SAPS, MPM II, and SOFA, except that it is designed specifically for the ED population. Unlike complicated ICU severity models, the clinical data required for MEDS score calculation are readily obtainable in the normal course of a patient's routine investigations in the ED. With the increasing availability of computers and handheld devices in the ED, it should be possible to imbed such clinical prediction scores (regression formula) in electronic medical records.
The large discrepancy in mortality rates between the original MEDS data set (5.3%) and our data set (32.6%) was attributable to the difference in selection criteria of patient enrolment. The MEDS score was primarily derived from 2070 ED adult patients who had a potential risk of infection (as indicated by the ordering of a blood culture) regardless of their severity of illness, whereas our study cohort involved only patients who met predefined criteria of severe sepsis (SIRS with shock or signs of organ dysfunction). Despite the difference in mortality rates, the MEDS model maintained its discriminating power when applied to our patient group. We found that a cut off MEDS score of ⩾12 points effectively stratified ED patients with severe sepsis into two distinct risk groups (A and B), which were significantly different in mortality rate, APACHE score, and duration of survival. Hence, the MEDS score may serve as a quick and simple triage tool in the identification of a subset of ED patients with the highest mortality risk from sepsis. Although not validated in our study, such early stratification of patients with severe sepsis in a pre‐ICU setting may benefit emergency physicians in allocating the sickest patients: (a) to be admitted to ICU as soon as possible, (b) to receive aggressive goal directed therapy in the ED at the earlier stages of severe sepsis, and (c) to be considered as eligible candidates for expensive novel or experimental treatments, such as immunoglobulins17 or activated protein C,18 prior to ICU admission.
This study has a number of limitations. Firstly, the quality of data obtained in a retrospective study is only as accurate as that which was recorded and stored. Secondly, simple operational criteria (based on a checklist of symptoms and signs) were used to define severe sepsis in the ED, instead of using complicated ICU definitions such as the Multiple Organ Dysfunction19 score or the SOFA14 score, as suggested by the 2001 International Sepsis Definitions Conference.16 Thirdly, the endpoint was defined as death in 28 days, but the cause of death may not be the result of the infection itself. Finally, this was a single centre study and our model may not apply to another cohort. In the future, prospective studies comparing different severity scoring systems with larger study population in the ED would be needed to confirm our findings.
Although the clinical diagnosis of severe sepsis can be made on relatively simple criteria in the ED, risk score systems commonly used in outcome analyses of sepsis are conventionally developed from databases of ICU patients. They tend to be complicated and inconvenient for ED practice. Our results showed that the much simpler MEDS score, which was originally derived from ED database, effectively divided ED patients with severe sepsis into two distinct mortality risk groups. With further validation in the future, such a score may help emergency physicians in a priori stratification of severe sepsis patients for in hospital disposition or inclusion into clinical trials of new interventions.
Abbreviations
APACHE - Acute Physiology and Chronic Health Evaluation
DNAR - do not attempt resuscitation
ED - emergency department
ICU - intensive care unit
MEDS - Mortality in Emergency Department Sepsis
MPM - Mortality Probability Model
ROC - receiver operating characteristic
SAPS - Simplified Acute Physiology Score
SIRS - systemic inflammatory response syndrome
SOFA - Sequential Organ Failure Assessment
Footnotes
Competing interests: none declared
References
- 1.Brun‐Buisson C, Doyon F, Carlet J.et al Incidence, risk factors, and outcome of severe sepsis and septic shock in adults. A multicenter prospective study in intensive care units. French ICU Group for Severe Sepsis. JAMA 1995274968–974. [PubMed] [Google Scholar]
- 2.Angus D C, Linde‐Zwirble W T, Lidicker J.et al Epidemiology of severe sepsis in the United States: Analysis of incidence, outcome, and associated costs of care. Crit Care Med 2001291303–1310. [DOI] [PubMed] [Google Scholar]
- 3.Rangel‐Frausto M S, Pittet D, Costigan M.et al The natural history of the systemic inflammatory response syndrome (SIRS). A prospective study. JAMA 1995273117–123. [PubMed] [Google Scholar]
- 4.Sands K E, Bates D W, Lanken P N.et al Epidemiology of sepsis syndrome in 8 academic medical centers. Academic Medical Center Consortium Sepsis Project Working Group. JAMA 1997278234–240. [PubMed] [Google Scholar]
- 5.Wheeler A P, Bernard G R. Treating patients with severe sepsis. N Engl J Med 1999340207–214. [DOI] [PubMed] [Google Scholar]
- 6.Lundberg J S, Perl T M, Wiblin T.et al Septic shock: An analysis of outcomes for patients with onset on hospital wards versus intensive care units. Crit Care Med 1998261020–1024. [DOI] [PubMed] [Google Scholar]
- 7.Rivers E, Nguyen B, Havstad S.et al Early goal‐directed therapy in the treatment of severe sepsis and septic shock. N Engl J Med 20013451368–1377. [DOI] [PubMed] [Google Scholar]
- 8.Arabi Y, Al Shirawi N, Memish Z.et al Assessment of six mortality prediction models in patients admitted with severe sepsis and septic shock to the intensive care unit: a prospective cohort study. Crit Care 20037116–122. [DOI] [PMC free article] [PubMed] [Google Scholar]
- 9.Knaus W A, Zimmerman J E, Wagner D P.et al APACHE – acute physiology and chronic health evaluation: A physiologically based classification system. Crit Care Med 19819591–597. [DOI] [PubMed] [Google Scholar]
- 10.Knaus W A, Draper E A, Wagner D P.et al APACHE II: A severity of disease classification system. Crit Care Med 198513818–829. [PubMed] [Google Scholar]
- 11.Knaus W A, Wagner D P, Draper E A.et al The APACHE III prognostic system: risk prediction of hospital mortality for critically ill hospitalized adults. Chest 19911001619–1636. [DOI] [PubMed] [Google Scholar]
- 12.Le Gall J R, Loirat P, Alperovitch A.et al A simplified acute physiology score for ICU patients. Crit Care Med 198412975–977. [DOI] [PubMed] [Google Scholar]
- 13.Lemeshow S, Teres D, Klar J.et al Mortality Probability Models (MPM II) based on an international cohort of intensive care unit patients. JAMA 19932702478–2486. [PubMed] [Google Scholar]
- 14.Vincent J L, Moreno R, Takala J.et al The SOFA (Sepsis‐related Organ Failure Assessment) score to describe organ dysfunction/failure. On behalf of the Working Group on Sepsis‐Related Problems of the European Society of Intensive Care Medicine. Intensive Care Med 199622707–710. [DOI] [PubMed] [Google Scholar]
- 15.Shapiro N I, Wolfe R E, Moore R B.et al Mortality in Emergency Department Sepsis (MEDS) score: a prospectively derived and validated clinical prediction rule. Crit Care Med 200331670–675. [DOI] [PubMed] [Google Scholar]
- 16.Levy M M, Fink M P, Marshall J C.et al 2001 SCCM/ESICM/ACCP/ATS/SIS International Sepsis Definitions Conference. Crit Care Med 2003311250–1256. [DOI] [PubMed] [Google Scholar]
- 17.The Intravenous Immunoglobulin Collaborative Study Group Prophylactic intravenous administration of standard immune globulin as compared with core‐lipopolysaccharide immune globulin in patients at high risk of postsurgical infection. N Engl J Med 1992327234–240. [DOI] [PubMed] [Google Scholar]
- 18.Bernard G R, Vincent J L, Laterre P F.et al Efficacy and safety of recombinant human activated protein C for severe sepsis. N Engl J Med 2001244600–709. [DOI] [PubMed] [Google Scholar]
- 19.Marshall J C, Cook D J, Christou N V.et al Multiple organ dysfunction score: A reliable descriptor of a complex clinical outcome. Crit Care Med 1995231638–2152. [DOI] [PubMed] [Google Scholar]


