

Abstract
The neuromodulator serotonin has a complex set of effects on the auditory responses of neurons within the inferior colliculus (IC), a midbrain auditory nucleus that integrates a wide range of inputs from auditory and nonauditory sources. To determine whether activation of different types of serotonin receptors is a source of the variability in serotonergic effects, four selective agonists of serotonin receptors in the serotonin (5-HT) 1 and 5-HT2 families were iontophoretically applied to IC neurons, which were monitored for changes in their responses to auditory stimuli. Different agonists had different effects on neural responses. The 5-HT1A agonist had mixed facilitatory and depressive effects, whereas 5-HT1B and 5-HT2C agonists were both largely facilitatory. Different agonists changed threshold and frequency tuning in ways that reflected their effects on spike count. When pairs of agonists were applied sequentially to the same neurons, selective agonists sometimes affected neurons in ways that were similar to serotonin, but not to other selective agonists tested. Different agonists also differentially affected groups of neurons classified by the shapes of their frequency-tuning curves, with serotonin and the 5-HT1 receptors affecting proportionally more non-V-type neurons relative to the other agonists tested. In all, evidence suggests that the diversity of serotonin receptor subtypes in the IC is likely to account for at least some of the variability of the effects of serotonin and that receptor subtypes fulfill specialized roles in auditory processing.
INTRODUCTION
A unifying feature of how neuromodulators like serotonin shape sensory circuits in the brain is the diversity of receptors through which they act. Within a given sensory region, different types of receptors are expressed in different classes of neurons and are also localized to characteristic subcellular compartments (Barnes and Sharp 1999; Lanfumey and Hamon 2000; Sari 2004; Vergé and Calas 2000). Through these different receptors, neuromodulators trigger alterations in neural responses by mechanisms including changes in intrinsic conductances, modulation of receptors for other neurotransmitters, or changes in transmitter release (e.g., see Huang et al. 1993; Huidobro-Toro et al. 1996; Mooney et al. 1996; Yan 2002). Thus a single signaling molecule like serotonin can evoke complementary changes in the interacting neurons within a sensory circuit, gated by different receptor types. The net result of these neuromodulatory changes is a reconfiguration of sensory networks in ways that alter the relationship between sensory stimuli and the neural responses that they evoke (reviewed in Hurley et al. 2004).
Consistent with its actions in other sensory systems, serotonin has diverse effects within the auditory system. In the inferior colliculus (IC), a midbrain auditory nucleus, serotonergic fibers have a similar pattern in all species examined (Hurley and Thompson 2001; Kaiser and Covey 1997; Klepper and Herbert 1991) and serotonin alters multiple aspects of neural responses to sound. In addition to changing the number of spikes evoked by auditory stimuli (Hurley and Pollak 1999, 2001), serotonin can change the latency and precision of initial spikes and the timing of spike trains, all response properties that may contribute to the encoding of sensory stimuli (Hurley and Pollak 2005b). Serotonin-evoked changes in the magnitude and timing of auditory responses vary in size and direction from neuron to neuron and, for some neurons, are dependent on the properties of the auditory stimulus.
One likely source for the variation in the effects of serotonin on IC neurons is the diversity of serotonin receptors. Anatomical evidence for receptor diversity in the IC is abundant. Most of the seven main families of serotonin receptor have been detected in the IC using techniques including radioligand binding, immunohistochemistry, or in situ hybridization (e.g., 5-HT1: Peruzzi and Dut 2004; Thompson et al. 1994; 5-HT2: Cornea-Hébert et al. 1999; Harlan et al. 2000; 5-HT3: Morales et al. 1998; 5-HT4: Vilaró et al. 2005; 5-HT7: Heidmann et al. 1998; To et al. 1995). Several reports have suggested that members of the 5-HT1 receptor family are especially strongly represented, with a radioligand binding study indicating enrichment of the 5-HT1A receptor in the IC (Thompson et al. 1994) and an immunohistochemical study suggesting that 5-HT1A and 1B receptors are present on many IC neurons (Peruzzi and Dut 2004).
Compared with the wealth of studies documenting the expression of serotonin receptors in the IC, there are relatively few studies examining the physiological roles of different serotonin receptor types in this nucleus (but see Miko and Sanes 2004). To determine whether the effects of activating different receptor types reflect their diversity, the actions of four agonists of receptors in the 5-HT1 and 5-HT2 families on the auditory responses of IC neurons of the Mexican free-tailed bat (Tadarida brasiliensis) were compared in this study. These two receptor families have been extensively studied throughout the brain and often mediate complementary effects on neural networks (e.g., Brandão et al. 1991; Carli et al. 2006; Craven et al. 2001; Hassanain et al. 2003). The specific receptor subtypes targeted by the agonists used in this study, the 5-HT1A, 5-HT1B, 5-HT2A/C, and 5-HT2C receptors, have all been reported within the IC [Thompson et al. 1994 (1A); Cornea-Hébert 1999 (2A); Harlan et al. 2000 (2C); Peruzzi and Dut 2004 (1A, 1B)]. The IC itself has long been an intensive focus for auditory research. It integrates ascending and descending inputs from numerous auditory nuclei and creates novel response properties to auditory stimuli from the convergence of such inputs (Pollak et al. 2002, 2003). The IC is also strongly interconnected with nonauditory systems of the brain and is involved in a number of acoustically related behaviors, including startle and aversive responses (Brandão et al. 1993; Li and Yue 2002).
Within this network, the four serotonin receptor agonists tested have distinct effects on the magnitudes and latencies of the auditory responses of single neurons. Overall, these experiments support the hypothesis that serotonin acts through multiple receptor types in the IC and that receptor diversity is one way that serotonin enacts selective changes in auditory responses in this nucleus.
METHODS
Surgical procedures
Before surgery, bats were anesthetized by brief exposure to isoflurane fumes followed by intraperitoneal injection of 120 mg/kg ketamine and 5 mg/kg xylazine. When deep anesthesia was achieved as judged by the lack of response to tail and foot pinch, the skin and muscle overlying the skull were incised and deflected to the side. A small hole was drilled above the IC, plainly visible in the contours of the skull. Lidocaine gel (2%) was applied topically, and the bat was placed in a soft foam holder shaped to its body contours and transported to a sound-attenuated chamber. The head of the bat was immobilized in a custom-made stereotaxic device (Schuller et al. 1986) with a post affixed to the skull with dental cement, rostral to the IC. In some cases, a second post was attached caudal to the IC with cyanoacrylate gel for additional mechanical stability. The bat was then allowed to waken. Bats usually lie quietly within the recording apparatus. Periodically, topical lidocaine anesthesia was refreshed and the bat was offered water from a dropper. If a bat showed discomfort, as judged by movement that was observed directly or through the recording electrode, a subanesthetic dose of 24 mg/kg ketamine and 1 mg/kg xylazine (1/5 of the surgical dose) was administered. If movement persisted, the experiment was terminated and the bat was returned to its home cage. Neurons were recorded during two sessions, with a resting period in the home cage of no <10 h between sessions. Before this resting period, bats were reanesthetized with isoflurane, their incisions were sutured, and they were treated with a topical mixture of antibiotic and Lidocaine gels as well as a systemic analgesic (Torbugesic, 1–2 mg/kg). All procedures used in this study were approved by the Bloomington Institutional Animal Care and Use Committees.
Extracellular recording of single neurons
A total of 224 neurons were recorded from the inferior colliculi of 31 male Mexican free-tailed bats (Tadarida brasiliensis). Neural recordings were made through single-barreled extracellular pipettes in a “piggy-back” configuration with multibarreled pipettes (Havey and Caspary 1980). Briefly, three- or five-barreled iontophoresis pipettes were broken to a tip diameter of 10–20 μm, with the single-barreled recording pipette protruding 10–15 μm in front of the multibarreled pipette. The tips of the single-barreled pipettes were filled with 1 M NaCl and had resistances of 8–20 MΩ. Pipettes were connected by a silver–silver chloride wire to a Dagan 2400 amplifier (Minneapolis, MN). Spikes were fed through a spike signal enhancer (FHC model, Bowdoinham, ME) before being digitized through a data acquisition processor board (Microstar, Bellevue, WA).
Multibarreled electrodes were positioned above the IC under visual control through a dissecting microscope and lowered with a piezoelectric microdrive (Burleigh/EXFO inchworm, Mississauga, Ontario, Canada) until action potentials were observed. Several criteria were used to ensure that single neurons, rather than multiunit recordings or amplified background potentials, were recorded. First, action potentials had signal-to-noise ratios of ≥5 before amplification through the FHC signal enhancer. Action potentials did not vary in amplitude with stimulus intensity and had distinctive waveforms. In the very rare cases in which two neurons were recorded simultaneously, the two were clearly distinguishable by the different amplitudes of their action potentials. Finally, at the end of the experiment, most neurons could be “killed” by small injections of current (1 nA) through the recording electrode.
Auditory stimuli
Auditory stimuli were created and data were collected with the custom software package Batlab (Dr. Donald Gans, Kent State University). Auditory stimuli were played through either an earphone biased with 200-V DC (Schuller 1997), positioned in the ear contralateral to the recording electrode, or a midline freefield speaker. The frequency response of the custom-made earphone was flat ±6 dB from 10 to 120 kHz, with harmonic distortions ≥34 dB below the fundamental frequency. With the pinna folded over the housing of the loudspeaker and wrapped with Scotch tape, the binaural cross talk with this arrangement is attenuated by 35–40 dB. Calibration of the freefield speaker (Infinity Emit B, Harman International Industries, Woodbury, NY) was accomplished by placing a measuring microphone (ACO Pacific PS9200 kit, Belmont, CA) in the position occupied by the bat’s head during experiments. The response of the speaker was flat within ±6 dB from 15 to 30 kHz, a range that encompassed the responses of 89% of recorded neurons. Harmonic distortions were 30–40 dB below the fundamental frequency across this range.
Auditory stimuli consisted of tone bursts or FM sweeps ranging from 5 to 20 ms, with 0.5-ms rise times. FM sweeps were centered at the characteristic frequency (CF) for each neuron as determined audiovisually, and swept across a range of 5–20 kHz. Rate-level functions were generated by playing FM sweeps or CF tones, whichever elicited the strongest response from a given neuron, at intensities ranging from 10 dB below to 40–50 dB above threshold, in 10-dB steps. Frequency-tuning plots were generated by playing tones spanning the excitatory tuning range of the neuron in steps of 0.5 to 4 kHz, depending on the bandwidth of the neural response. Frequency tuning was measured from 10 dB below to 30–50 dB above threshold, in steps of 10–20 dB.
Spike data were exported from Batlab in ASCII format for statistical analysis to either Excel (Microsoft, Redmond, WA) or to Statistica (StatSoft, Tulsa, OK).
Drugs and iontophoresis
The multibarreled pipette of the piggy-back electrode was used for iontophoresis of serotonin receptor agonists. Two of the pipette barrels were filled with receptor agonists and one was filled with 1 M NaCl to serve as a sum channel, balancing the iontophoretic currents ejected through the other barrels. The barrels were connected by silver–silver chloride wire to iontophoresis pump modules (ION-100, Dagan).
Five agonists were tested for effects on IC neurons. These were 1) serotonin creatinine sulfate (5-HT, Sigma-Aldrich, St. Louis, MO; 20–30 mM), 2) the 5-HT1A agonist 8-OH-DPAT [(±)-8-hydroxy-2-(dipropylamino)tetralin, Sigma-Aldrich; 6–20 mM], 3) the 5-HT1B agonist CP93129 [1,4-dihydro-3-(1,2,3,6-tetrahydro-4-pyridinyl)-5H-pyrrol[3,2-b]pyridin-5-one dihydrochloride, Tocris, Ellisville, MO; 10–20 mM], 4) the 5-HT2A/C agonist DOI [(±)-1-(2,5-dimethoxy-4-iodophenyl)-2-aminopropane hydrochloride, Sigma-Aldrich; 25 mM], and 5) the 5-HT2C agonist MK212 [6-chloro-2-(1-piperazinyl) pyrazine hydrochloride, Tocris; 6–20 mM]. Agonists were dissolved in 165 mM NaCl, pH 4–4.5. In previous studies, no effects of iontophoresed vehicle alone have been observed (Hurley and Pollak 1999, 2001, 2005a,b). In this study, the carrier vehicle was tested in 19 neurons, at current levels equal to those used to eject serotonin receptor agonists. Among these, iontophoresis of the vehicle did significantly increase the spike count in two neurons. This was below the proportion for any of the agonists tested.
During a typical experiment, the responses of neurons to tone bursts and FM sweeps were initially monitored over a time period equivalent to the time needed for the agonists to affect neural responses, to ensure the stability of baseline activity. After this initial time control, agonist iontophoresis commenced and spike counts were monitored until they stabilized. All of the agonists tested act on metabotropic serotonin receptors, and the amount of time that it took for the effects of agonists to occur was typically on the order of minutes. While maintaining agonist iontophoresis, another data set was collected. Iontophoresis was then halted and, if contact with the neuron was maintained, spike counts were monitored until the neuron recovered or for 15–30 min.
Dose–response relationship
The technique of iontophoresis, although it allows for localized application of drugs with minimal disruption of surrounding tissue within an intact auditory system, does not allow for precise control of drug concentration. Thus several methodological issues were considered to ensure that the effects of the serotonin receptor agonists were as specific as possible. First, agonists with relatively high selectivity were chosen and used in concentrations that are standard for their use in iontophoretic experiments described in other studies (e.g., Bergqvist et al. 1999; el Mansari and Blier 1997). In some cases, lower concentrations of agonists than were previously reported were tested. Second, multiple doses of each of the agonists were applied to some neurons by varying the amplitude of the iontophoretic current, to measure the dose–response relationship and establish effective ranges of drug concentrations. In many cases, the effects of the agonists approached saturation with iontophoretic currents of 10–100 nA, but iontophoretic currents never exceeded 100 nA, to minimize the possibility of current artifacts. Figure 1 illustrates an example current–response relationship for a representative neuron tested with the agonist 8-OH-DPAT. As can be seen, iontophoretic currents of 25 nA had only a slight effect on spike count and the effect increased at two higher levels of iontophoretic current, but recovered after iontophoresis ceased.
Fig. 1.
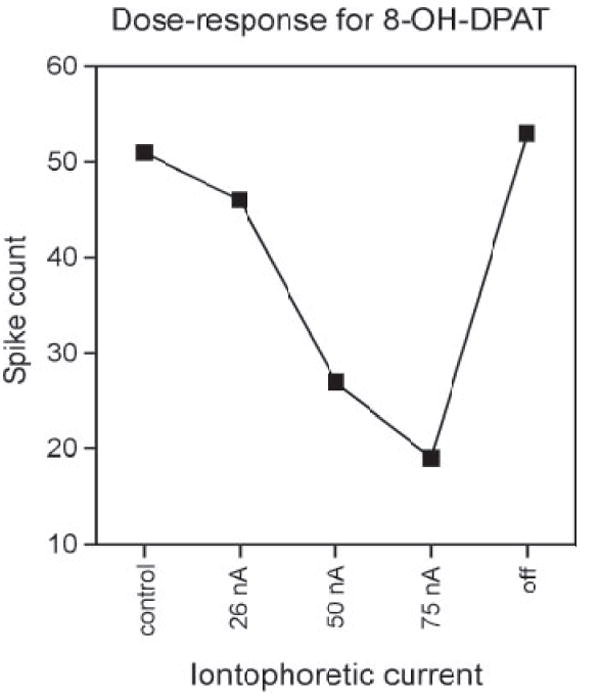
Effects of the 5-HT1A receptor agonist 8-OH-DPAT agonist applied at different levels of iontophoretic current to a single neuron. Effects of 8-OH-DPAT on spike count approached saturation at higher levels of ejection current and recovered after cessation of iontophoresis.
Analysis
The effects of agonists on both spike counts and first-spike latencies were measured and analyzed for statistical significance by using two-tailed unpaired t-test in Excel (Microsoft). To be included in the statistical analysis, the effects of an agonist on a given neuron had to meet one of two criteria. First, the two time-separated measurements before agonist iontophoresis had to be statistically indistinguishable, indicating a stable baseline. Alternatively, for a few neurons in which an initial time control was not performed, the response of the neuron had to significantly recover after the cessation of agonist iontophoresis. If neither of these conditions was met, the neuron was excluded from analysis.
A total of 112 neurons were classified based on the shapes of their tuning curves. 1) V-shaped tuning curves were defined as those showing a >20% increase in bandwidth from 10 to 30 dB above threshold. 2) Neurons with I-shaped tuning curves showed a relatively constant bandwidth between these intensities, with <20% change. 3) Nonmonotonic neurons, a group including neurons with O-shaped and slanted tuning curves, showed a ≥50% decrease in spike count with increasing intensity for at least one frequency. 4) Two-peaked neurons showed two spike count maxima at different frequencies separated by a minimum at which spike counts decreased by ≥50%.
Agonist effect versus anesthesia
Anesthetic state was a potential concern in these experiments for two reasons. First, one of the anesthetics used, ketamine, can alter the release of endogenous serotonin (Lindefors et al. 1997). Ketamine can also alter auditory-evoked potentials (Maxwell et al. 2006), potentially through its effects on the N-methyl-d-aspartate (NMDA) receptor (Villars et al. 2004). Second, the level of endogenous serotonin is expected to vary with the level of behavioral arousal (see Hurley et al. 2004), so if receptor physiology were dependent on serotonergic tone, or if endogenous serotonin already occupied receptors in awake animals, then the effects of serotonergic agonists could vary with anesthetic state. To explore whether either of these factors influenced the effects of the serotonin receptor agonists, neurons were separated into two groups. The first group consisted of neurons recorded within 2 h of a dose of anesthetic (n = 58). The second group consisted of neurons recorded >2 h after a dose of anesthetic or <2 h after an anesthetic dose if the animal was positively observed to be awake, through either a previous response to touch or acceptance of water or through the observation of small amounts of muscle activity through the recording electrode (n = 100). There was no significant difference between these two groups for any agonist (two-tailed unpaired t-test P values: serotonin: 0.22; 8-OH-DPAT: 0.35; CP93129: 0.94; DOI: 0.49; MK212: 0.75). There was also no difference in the effects of agonists between the two groups when all agonists were lumped together (P = 0.55). Thus there was no strong evidence for anesthetic-dependent changes in the effects of serotonin receptor agonists in this study.
RESULTS
A total of 224 neurons were recorded from the IC of Mexican free-tailed bats. Groups of these neurons were tested for responsiveness to five serotonin (5-HT) receptor agonists with selectivity for different subtypes of 5-HT1 or 5-HT2 receptors: 1) serotonin itself (n = 51); 2) the 5-HT1A receptor agonist 8-OH-DPAT (n = 73); 3) the 5-HT1B receptor agonist CP93129 (n = 40); 4) the 5-HT2A/C receptor agonist DOI (n = 42); and 5) the 5-HT2C agonist MK212 (n = 66). The sum of sample sizes for all agonists exceeds the total number of neurons recorded because some neurons were tested for responsiveness to multiple agonists. Spike counts and average first spike latencies were measured for responses to 32 presentations of brief (5- to 10-ms) tones or for 5- to 10-ms FM sweeps centered at CF and spanning 5–10 kHz. These measurements were made at 10–20 dB above threshold in the periods before, during, and after drug iontophoresis.
All five agonists tested altered the responses of some IC neurons, but different agonists acted in different ways. Examples of effects of all five agonists tested are shown in Fig. 2, which plots peristimulus time histograms (PSTHs) of five different neurons in the control, during the iontophoresis of agonist, and after recovery of the response. Dashed lines mark the onset of spike firing. For the neurons in this figure, serotonin, 8-OH-DPAT (5-HT1A), and DOI (5-HT2A/C) decreased spike count and increased the latency to first spikes, but CP93129 (5-HT1B) and MK212 (5-HT2C) had the opposite effect, increasing spike count and decreasing latency. Many of the agonists also altered the pattern of spikes. For example, 8-OH-DPAT (5-HT1A) decreased the duration of the neural response by suppressing later spikes within the spike train and MK212 (5-HT2C) unmasked a secondary peak of spikes that was not evident in the control. Agonists also sometimes altered spike counts and latencies to a different degree. For example, 8-OH-DPAT (5-HT1A) decreased spikes by over one third but increased the first-spike latency only slightly (by 0.4 ms on average), whereas DOI (5-HT2A/C) increased latency much more (by 4.2 ms on average), but decreased spike count less.
Fig. 2.
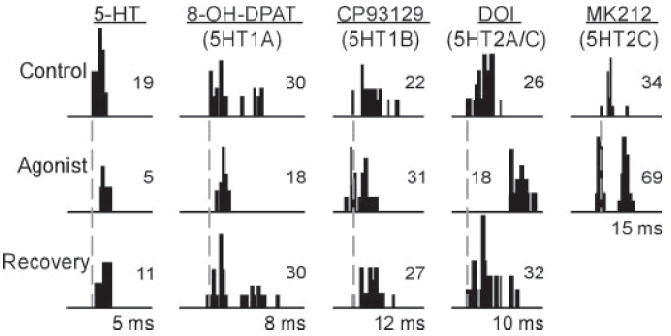
Peristimulus time histograms (PSTHs) of the effects of different drugs on spike count and latency in 5 single inferior colliculus (IC) neurons. Examples do not represent the most extreme changes in spike count or latency because neurons were chosen to illustrate both. Control PSTHs were recorded before iontophoretic ejection of drugs, agonist PSTHs were recorded during iontophoresis, and recovery values were recorded after iontophoresis was stopped. Numbers on each plot represent total spike count. Stimulus envelopes are well in advance of the spike trains at the timescales shown; latencies to the start of the control spike train are 15 ms for serotonin, 14 ms for 8-OH-DPAT, 23 ms for CP93129, 12 ms for DOI, and 13 ms for MK212. Stimuli were: for serotonin, a 10-kHz FM sweep centered at 25 kHz at 20 dB SPL; for 8-OH-DPAT, a 10-kHz FM sweep centered at 25 kHz at 40 dB SPL; for CP93129, a 20-kHz tone at 20 dB SPL; for DOI, a 7-kHz FM sweep centered at 21 kHz at 50 dB SPL; for MK212, a 5-kHz FM sweep centered at 19 kHz at 50 dB SPL. All stimuli were 10 ms in duration. 5-HT = serotonin.
Figure 3A summarizes the percentages of neurons that showed significant changes (two-tailed unpaired t-test, P < 0.05) in spike count (filled bars) or latency (unfilled bars). Agonists differed in the proportion of increases versus decreases that they evoked in spike count. For example, serotonin caused spike counts to decrease in 27.5% of neurons but to increase in 7.8% of neurons. Like serotonin, 8-OH-DPAT (5-HT1A) caused both increases and decreases in spike count, but other agonists showed more skewed effects of serotonin on spike count. CP93129 (5-HT1B) and MK212 (5-HT2C) increased spike counts in most of the neurons they affected, but DOI was biased toward decreasing spike count. In general, differences in agonist effects on latency were less pronounced than their effects on spike count. An exception was DOI, which predominantly induced increases in latency, complementing the decreases in spike count that it also evoked. In an earlier study, the effects of serotonin on latency were likewise not always the inverse of its effects on spike count, but could occur to a different degree or even independently from spike count changes (Hurley and Pollak 2005b).
Fig. 3.
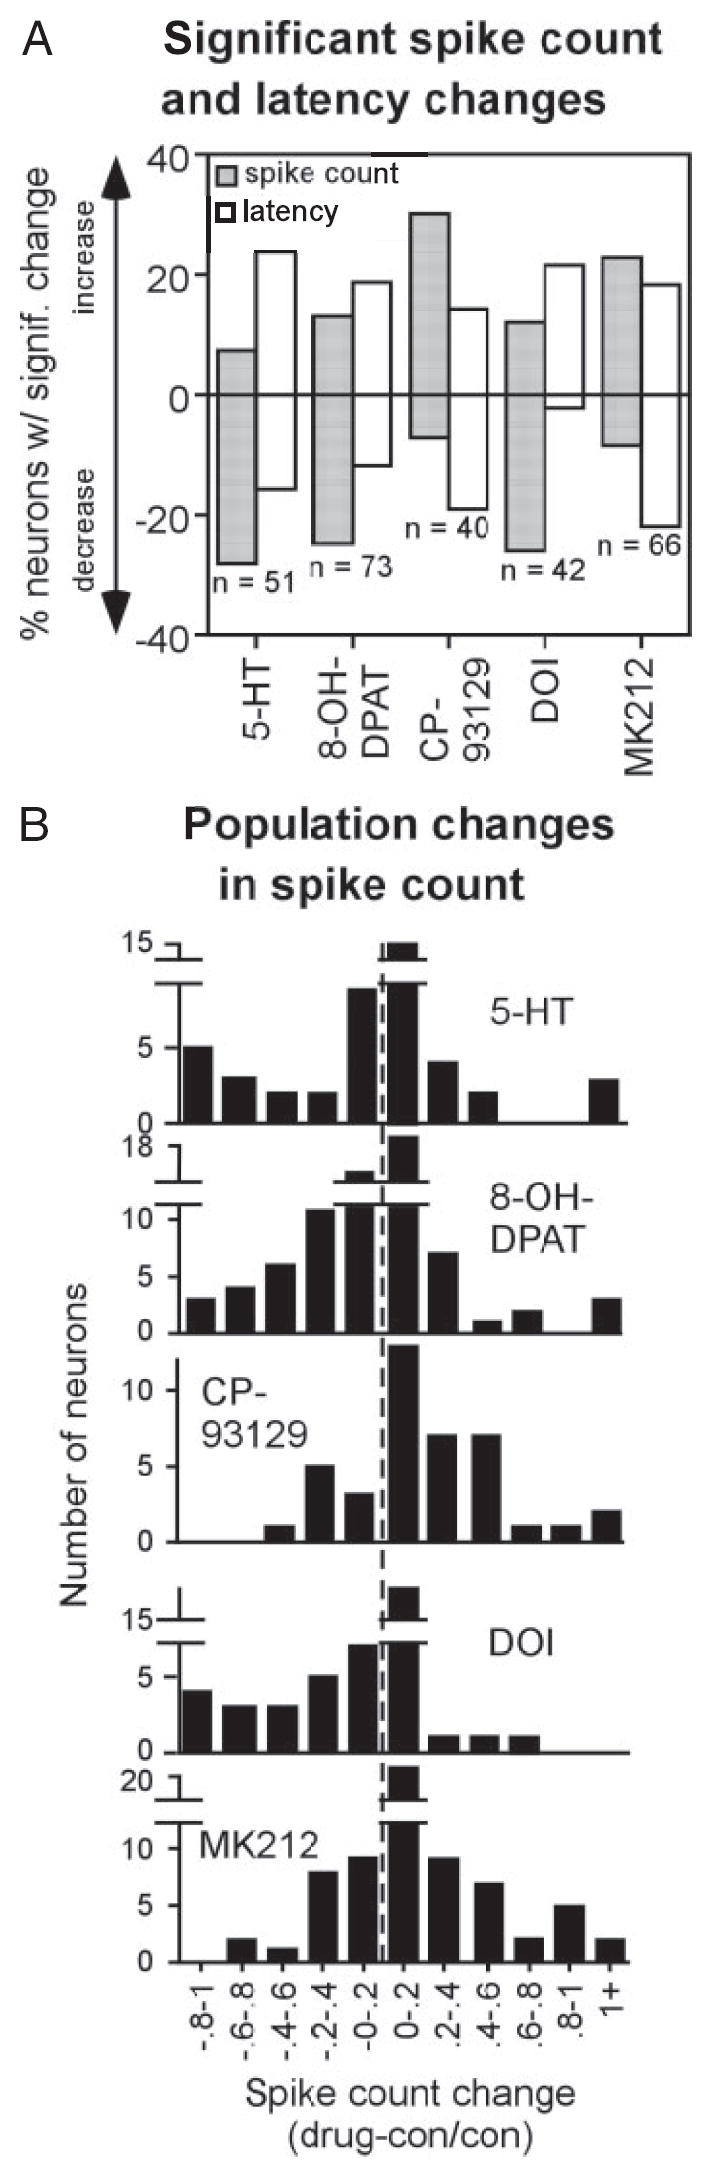
Effects of agonists in the neuron population. A: percentage of neurons showing significant increases or decreases in spike count (filled bars) and latency (open bars). Sample sizes represent all neurons exposed to a given agonist. B: histograms of the numbers of neurons showing agonist-evoked changes of different sizes for the 5 agonists, expressed as (drug-control)/ control spike counts. Dashed line represents no change in spike count.
As can be seen in Fig. 3A, none of the agonists tested altered the spike counts or latencies of all neurons. This finding is in agreement with previous studies (e.g., Hurley and Pollak 1999, 2001) and is likely to be attributable to a range of factors including the absence of serotonin receptors on some neurons or the presence of endogenous serotonin already occupying receptors. However, although all agonists significantly changed spike counts and latencies in only a subpopulation of neurons, the effects of these drugs were not simply present or absent, but instead occurred along a continuum. This can be observed in population histograms of the numbers of neurons with spike count changes of different sizes for each agonist (Fig. 3B). All of these plots have peaks around zero change, indicating the neurons with little or no agonist-evoked alterations in these values. The histograms for serotonin, 8-OH-DPAT, and DOI are shifted to the left of the dashed line marking zero change, indicating larger numbers of neurons with decreases in spike count for these agonists. In contrast, the histograms for CP93129 and MK212 are shifted to the right, indicating larger numbers of neurons with spike count increases.
Thus although the extreme ranges of the effects of many agonists on spike count overlap, there are clear differences among some selective agonists in their profiles of effects across the population of neurons.
Agonists change threshold and frequency tuning
In previous studies, serotonin changed the threshold and frequency selectivity of neural responses to sound (Hurley and Pollak 1999, 2001). Serotonin receptor agonists were similarly capable of inducing changes in response threshold or frequency tuning. To quantify threshold changes, the threshold criterion was arbitrarily set as a response of 10 spikes per 32 stimulus repetitions, and the threshold was estimated from a linear interpolation between the two intensities above and below this criterion value. Agonist-evoked bandwidth changes were quantified in a similar way, by interpolating the frequencies at which spike counts reached an arbitrary criterion value of 10 at 10–20 dB above threshold at CF. This measurement has functional significance because the absolute range of frequencies to which neurons respond is an important factor in determining which multifrequency sounds are capable of evoking a neural response (Hurley and Pollak 2001; Klug et al. 2002). However, because spike counts are often low at the frequency and also the intensity borders of a neuron’s response area, such measurements are relatively sensitive to changes in spike count. Having a criterion value of 10 spikes rather than a lower number reduced the impact of this “border” effect.
In general, the effects of different agonists on both threshold and bandwidth paralleled their effects on spike count. Figure 4A, top, plots the median and interquartile ranges of threshold shifts for all neurons for which agonists showed statistically significant changes in spike count. The agonists that decreased spike count in a large proportion of neurons, serotonin, 8-OH-DPAT, and DOI, evoked larger increases in threshold than other agonists. Likewise, the agonists that induced the largest spike count increases, CP93129 and MK212, caused larger threshold decreases, although this effect was more pronounced for CP93129. These findings are reflected in the histograms of threshold changes in the entire population (bottom). Most notably, DOI caused larger increases in threshold in more neurons, and CP93129 decreased threshold in more neurons, than the other agonists.
Fig. 4.

Agonist-evoked changes in threshold and frequency tuning. A, top: changes in threshold, in decibels, for neurons with significant changes in spike count in which thresholds were also measured; sample sizes represent this group of neurons. Values are presented as medians and interquartile ranges. Bottom: population values are presented as histograms of the numbers of neurons with agonist-evoked threshold changes of different sizes. Dashed line marks zero change in threshold. B: normalized changes in bandwidth at 10–20 dB above threshold. Top: values for neurons with significant changes in spike count. Bottom: for the neuron population, presented as in A.
Changes in bandwidth also generally reflected agonist-evoked alterations in spike count and there was good agreement between bandwidth changes in the neurons with significant shifts in spike count (Fig. 4B, top) and in the population (Fig. 4B, bottom). That is, the agonists causing the strongest directional changes in tuning, such as CP93129 and MK212 causing increases in bandwidth, showed the same trends in neurons with significant spike count changes and across the population.
Thus receptor agonists not only change spike count, but alter the ranges of sounds that neurons respond to, by changing threshold and frequency tuning.
Similarities between serotonin and selective agonists
In a number of ways, the effects of one of the serotonin receptor agonists, 8-OH-DPAT (5-HT1A), paralleled those of serotonin. Both serotonin and 8-OH-DPAT could either suppress or facilitate the responses of substantial numbers of neurons. The similarity between the effects of serotonin and 8-OH-DPAT was striking at the level of some single neurons. This is illustrated in Fig. 5, which shows PSTHs for consecutive applications of serotonin and 8-OH-DPAT on two different neurons. Figure 5A illustrates a neuron for which both of the agonists increased the spike count dramatically, from zero to 74 spikes for serotonin and from four to 127 spikes for 8-OH-DPAT, although the carrier (vehicle) solution had no such effect. Increases in spike count of this magnitude were not evoked by any other agonist tested, even CP93129 and MK212. Figure 5B shows a different effect of the two agonists, in a neuron for which each of the agonists roughly halved the spike count, from 26 to 13 for 8-OH-DPAT and from 38 to 20 for serotonin. In addition, both serotonin and 8-OH-DPAT altered the firing pattern of this neuron in similar ways, significantly increasing the latency and causing it to fire in one burst rather than two.
Fig. 5.
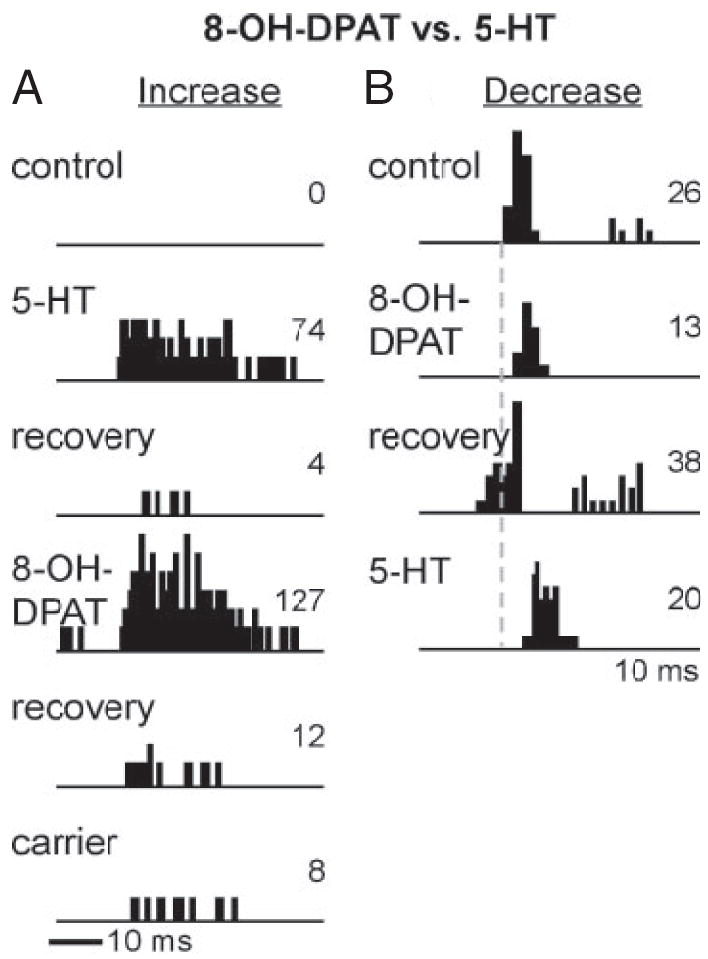
Comparison of the effects of serotonin and 8-OH-DPAT in 2 single neurons. A: for this neuron, sequential application of serotonin and 8-OH-DPAT induced similarly dramatic increases in spike count, but iontophoresis of the carrier vehicle did not. Stimulus envelope is indicated by the dark bar beneath the PSTHs. Stimulus was a 27.7-kHz tone at 20 dB SPL, with a 10-ms duration. B: for this neuron, sequential application of 8-OH-DPAT and serotonin induced similar decreases in spike count and increases in latency, resulting in a similar firing pattern. Stimulus envelope is too far in advance of the PSTHs to indicate in this plot; the latency to the start of the control spike train is 14 ms. Stimulus is a 10-kHz FM sweep centered at 25 kHz at 40 dB SPL.
To further explore how closely the effects of 8-OH-DPAT mimic those of serotonin in additional neurons, both serotonin and 8-OH-DPAT were sequentially applied to a set of 17 neurons. For comparison, serotonin was also applied sequentially with DOI, the other agonist that decreased spike counts in a substantial proportion of neurons, in a separate set of 15 neurons. Figure 6 plots the cumulative spike count changes induced by serotonin versus 8-OH-DPAT (left) and serotonin versus DOI (right) in the two sets of neurons. For this type of plot, the slope is an indication of the numbers of neurons showing spike count changes of different sizes. For example, the steep slopes for all agonists near the dashed line marking zero indicates the relatively large proportion of neurons with little or no change in spike count, and the shallower slopes near the top of the curves indicate that the agonists did not increase the spike count of many neurons within these samples. The plots of both 8-OH-DPAT and DOI follow the plot of serotonin relatively closely, but show several interesting differences. The cumulative plot of 8-OH-DPAT–evoked changes in spike count is slightly shifted to the right relative to that of serotonin, especially at the more negative end of the range, indicating that serotonin evokes more spike count decreases in this sample than 8-OH-DPAT does. The relationship between serotonin and DOI was the opposite, with DOI decreasing spike counts in more neurons than serotonin in the sample of neurons tested. Thus although 8-OH-DPAT mimics the pattern of effects of serotonin closely in some individual neurons, its effects in a larger sample of neurons are not more identical to those of serotonin than are those of DOI, another agonist that decreases spike count in many neurons.
Fig. 6.
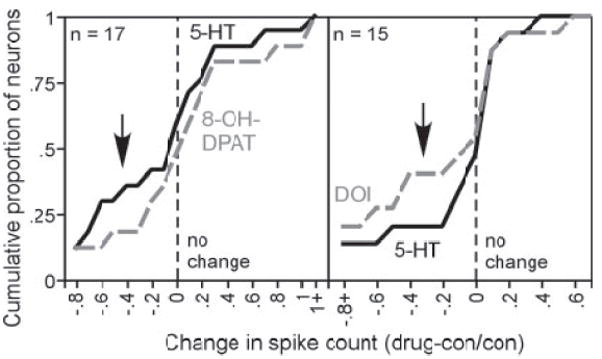
Comparison of the effects of serotonin vs. other agonists presented sequentially in the same neurons. Left: cumulative plot of changes in spike count ((drug-control)/control) evoked by serotonin vs. 8-OH-DPAT in 17 neurons. Right: a similar plot for the effects of serotonin and DOI in a different group of 15 neurons.
Additional differences among receptor agonists
Spike count captures one aspect of the effects of serotonin receptor agonists. With this measurement, several agonists overlapped in their ranges. For example, knowing that a neuron responded to an agonist with an increase in spike count would not necessarily identify the agonist but would raise the possibility that it could be any one of four agonists: serotonin, 8-OH-DPAT, CP93129, or MK212. To directly test the possibility that overlapping agonists alter the responses of individual neurons in the same way, the selective receptor agonist that was capable of the largest range of effects, 8-OH-DPAT, was tested in the same set of neurons as the two other most selective agonists, CP93129 (14 neurons) and MK212 (22 neurons). In both sets of neurons, each of the two agonists significantly changed the spike counts of some neurons, but none of the neurons responded with significantly changed spike counts to both agonists tested. Figure 7A, left, contains PSTHs of the effects of 8-OH-DPAT and MK212 in the same neurons. For the leftmost neuron, MK212 had no effect, although 8-OH-DPAT substantially decreased the spike count. For a second neuron, MK212 increased the spike count, by increasing the spontaneous rate of activity, but 8-OH-DPAT did not change the spike count. The entire sample of 22 neurons that were exposed to both agonists are shown in the cumulative plot at the right. This plot mirrors the differences seen in single neurons, with the curve for MK212 displaced in the direction of spike count increases relative to the 8-OH-DPAT curve. A similar trend was seen in neurons exposed to both 8-OH-DPAT and CP93129 (Fig. 7B). PSTHs of two neurons (left) show complementary changes evoked by the two agonists. For the leftmost neuron, CP93129 increased the spike count by extending the duration of the spike train, but 8-OH-DPAT had little effect. For a second neuron, CP93129 had little effect, but 8-OH-DPAT decreased the spike count, by shortening the duration of the spike train. Similar to the cumulative curve for MK212, the curve for CP93129-evoked spike count changes is displaced in the positive direction relative to 8-OH-DPAT for the 14 neurons tested with both agonists (right). The exclusivity of the effects of selective agonists in these two sets of neurons contrasts with the neurons responding to both serotonin, the universal agonist for these receptors, and more selective agonists (Figs. 5 and 6). The limited number of neurons tested with multiple agonists does not allow the statement that these pairs of agonists never affect the same neurons. However, these results support the hypothesis that, at least in some neurons, one factor distinguishing agonists is the identity of neurons that they target.
Fig. 7.
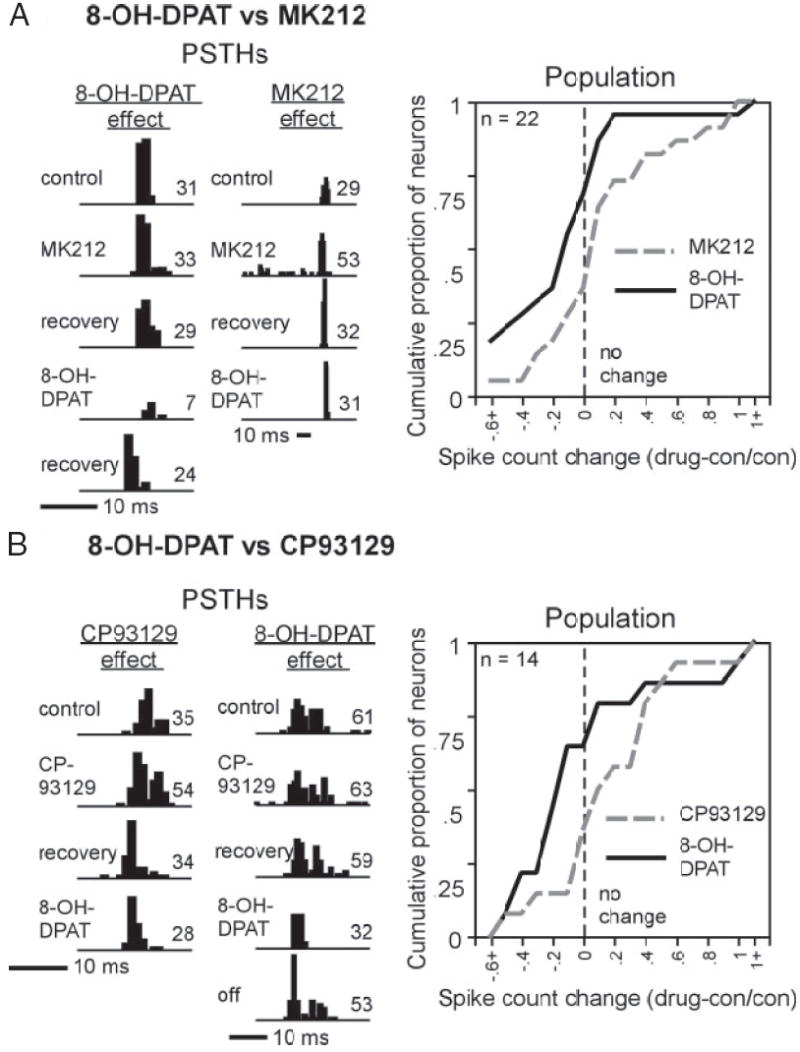
Effects of 8-OH-DPAT vs. 2 other agonists, MK212 (A) and CP93129 (B), in the same neurons. A, left: PSTHs of 2 neurons showing effects of either 8-OH-DPAT or MK212, but not both. Stimuli are: a 5-kHz FM sweep centered at 24 kHz at 70 dB SPL for the neuron on the left and a 10-kHz FM sweep centered at 28 kHz at 10 dB SPL on the right. Right: cumulative plot of the effects of both agonists, applied sequentially, on the spike counts of the same 22 neurons. B, left: PSTHs of 2 neurons showing effects of either 8-OH-DPAT or CP93129, but not both. Stimuli are: a 10-kHz FM sweep centered at 15 kHz at 20 dB SPL for the neuron on the left and a 10-kHz FM sweep centered at 25 kHz at 0 dB SPL on the right. Right: cumulative plot of the effects of both agonists, applied sequentially, on the spike counts of the same 14 neurons. For both A and B, the stimulus envelopes are indicated by the dark bar; all stimuli are 10 ms in duration.
In addition to their differing effects on the responses of individual neurons, agonists differed from each other in the types of neurons that they affected. IC neurons are often classified based on the shapes of their frequency-tuning curves, which are thought to reflect the inputs received by IC neurons as well as their functional response properties (Casseday and Covey 1992; Chase and Young 2005; Ehret et al. 2003; Hernández et al. 2005). The 112 neurons whose tuning characteristics were measured were grouped into four main categories: V-type, I-type, nonmonotonic, and two-peaked, as defined in methods. The relative proportions of these neurons were similar to those previously reported in another FM bat species (Casseday and Covey 1992), with V-type neurons the most common (67.9%), followed by nonmonotonic (19.6%) and I-type (11.6%) neurons. The two two-peaked neurons recorded made up 0.8% of the population. Because the numbers of neurons within different groups were so disparate, neurons were further grouped into V- versus non-V classes, so that the numbers in each of these groups were more comparable, and these groups were examined to determine whether agonists differentially affected the spike counts or latencies of V-type versus non-V-type neurons. The percentage of neurons that were V-type varied for the samples of neurons recorded for different agonists, from a low value of 54% for DOI to a high value of 73% for MK212. To control for differences in the numbers of V-type versus non-V-type neurons recorded, the number of neurons of one type significantly affected by an agonist was normalized to the total number of neurons of the same type tested with the same agonist. For example, if an agonist altered spike counts or latencies of 10 V-type neurons in a sample for a particular agonist containing 20 V-type neurons, the effect size would be 0.5. When their effects were calculated in this way, there was a notable difference for one agonist in particular. Serotonin and the two 5-HT1 agonists, 8-OH-DPAT and CP93129, affected approximately equal numbers of non-V-type and V-type neurons (Fig. 8). However, MK212, and to a lesser extent DOI, affected proportionally fewer non-V-type neurons than V-type neurons. Of special interest is the difference between CP93129 and MK212 because these agonists have extremely similar effects on spike count at the population level (Fig. 3), but affect different proportions of V- versus non-V-type neurons. Although the distinction between V-type and non-V-type neurons is a broad one, these results further strengthen the contention that serotonin receptors are differentially expressed by functionally distinct IC neurons.
Fig. 8.
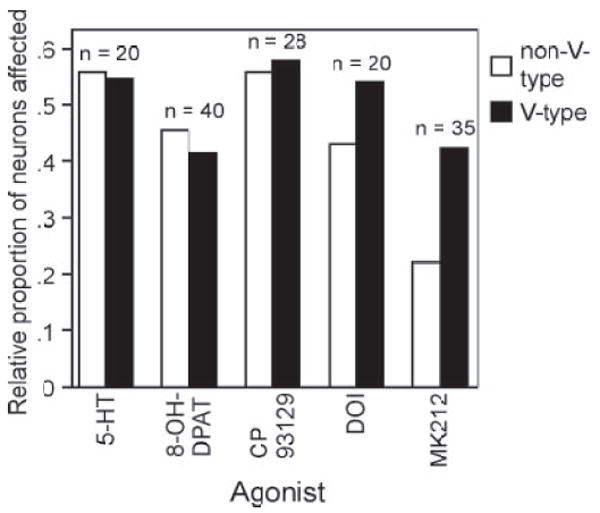
Effects of agonists on neurons with different types of tuning curves. Agonist effects are presented as the relative proportions of V-type and non-V-type neurons with significantly altered spike counts or latencies within the samples for each agonist. These are normalized for the total number of different types of neurons recorded for each agonist.
DISCUSSION
A number of studies have explored the anatomical distribution of serotonin receptors in the IC, but few have explored the physiological effects of activating these receptors on responses to auditory stimuli, in the IC or in any auditory nucleus. The current study measured the effects of agonists that are relatively selective for receptors within two of the most intensively studied families of serotonin receptors, 5-HT1 and 5-HT2. When applied locally by iontophoresis, different agonists not only had distinct effects on the spike counts and to a lesser extent on the first-spike latencies of sound-evoked responses, but also affected different single neurons and broad classes of neurons. The variable nature of the effects of these agonists is likely to be a reflection of the roles of different serotonin receptor subtypes within the complex circuitry of the IC. The IC receives projections from a wide array of auditory and nonauditory nuclei, and IC neurons may integrate different types of excitatory and inhibitory inputs from these projections that differ in timing, strength, and origin (Oliver and Huerta 1992; Pollak et al. 2003). There is also extensive intrinsic interconnectivity between IC neurons, with most IC neurons exhibiting local ramification (Oliver et al. 1991). The following discussion considers the results obtained in this study in light of the properties of serotonin receptor subtypes in other regions of the brain, to construct a simplified and testable model of different receptor subtypes within the excitatory and inhibitory circuitry of the IC (Fig. 9). The functional implications of this model for ascending auditory processing, especially the representation of frequency within the IC, are also discussed.
Fig. 9.
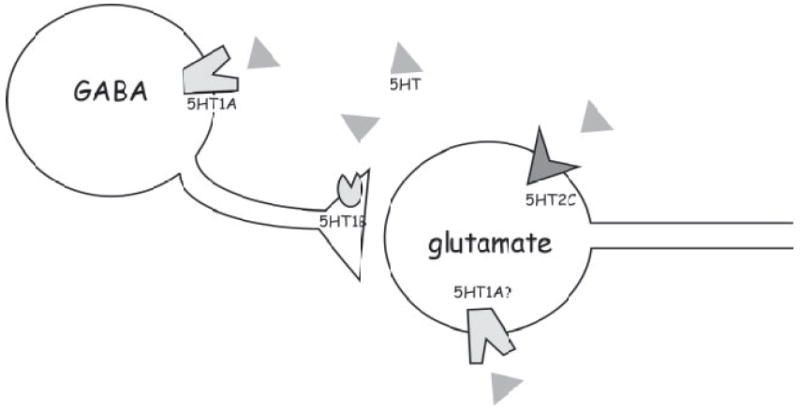
Parsimonious model of the placement of serotonin receptor types within the circuitry of the IC. Aspects of the model are described in the text.
5-HT1 receptors
Agonists of two types of 5-HT1 receptors, the 5-HT1A (8-OH-DPAT) and the 5-HT1B (CP93129) receptor, were tested in this study. Both of these types of receptors show an association, albeit a nonexclusive one, with GABAergic neurons, which make up about 20% of neurons in the IC (Oliver et al. 1994). Well over half of the neurons that are GABAergic also label with antibodies to the 5-HT1A or 5-HT1B receptors (Peruzzi and Dut 2004). Thus any model of the function of these receptors in the IC must incorporate their effects on GABAergic neurons.
5-HT1A RECEPTOR
The 5-HT1A receptor has been found in all major subdivisions and throughout the rostrocaudal extent of the IC (Peruzzi and Dut 2004). In addition, autoradiographic measurements find the 5-HT1A receptor to be enriched in the IC relative to other auditory nuclei (Thompson et al. 1994). These previous studies are in agreement with the finding that the 5-HT1A agonist, 8-OH-DPAT, closely mimicked the effects of serotonin on not only spike count but also on the temporal pattern of spikes in some single neurons (Fig. 5). 5-HT1A receptors frequently hyperpolarize target neurons and are usually found on the soma and dendrites of neurons (Barnes and Sharp 1999; Hoyer et al. 1994; Lanfumey and Hamon 2000) with a few exceptions (Katsurabayashi et al. 2003; Koyama et al. 2002). In this study, activation of the 5-HT1A receptor by the agonist 8-OH-DPAT had different effects on different neurons and could cause either an increase or a decrease in excitability, as measured by changes in spike count and latency.
These mixed effects of 8-OH-DPAT are consistent with the somatodendritic localization of some 5-HT1A receptors to GABAergic neurons in the IC (Peruzzi and Dut 2004). The decrease in excitability that was the most common effect of 8-OH-DPAT could result from the direct hyperpolarization of GABAergic neurons through the somatodendritic receptors. In nearby midbrain regions, including the superior colliculus and dorsolateral periaqueductal gray, activation of 5-HT1A receptor agonists, by iontophoretic or pressure application, similarly decreases neural activity (Brandão et al. 1991; Mooney et al. 1996). The less common increases in excitability that were observed when 8-OH-DPAT was iontophoresed in the IC could result from the suppression of sound-evoked activity in GABAergic interneurons presynaptic to the recorded neuron (Katsurabayashi et al. 2003). Thus all of the electrophysiological evidence on the effects of 8-OH-DPAT in this study could be accounted for by the inhibition of intrinsic GABAergic neurons through somatodendritic receptors.
However, additional effects of the 5-HT1A receptor on other types of neurons, potentially including glutamatergic neurons, are also consistent with these results. For example, activation of the 5-HT1A receptor could directly suppress the firing of a glutamatergic neuron and, in doing so, also decrease the excitatory input to postsynaptic neurons. Such a mechanism of action may be indicated by the presence of 5-HT1A receptors on some non-GABAergic neurons (Peruzzi and Dut 2004), as depicted in Fig. 9.
An alternate explanation for the mixed effects of 8-OH-DPAT is that it also activated a different serotonin receptor type, the 5-HT7 receptor, which has been reported to be present in the IC (Heidmann et al. 1998). This receptor can be activated by 8-OH-DPAT (Gill et al. 2002), decreasing hyperpolarizing potentials or increasing the activity of neurons in some brain regions (Bacon and Beck 2000; Beique et al. 2004; Gill et al. 2002; Tokarski et al. 2003). Thus activation of this receptor could also account for the rare increases in excitability observed with iontophoresis of 8-OH-DPAT. This possibility can be tested by using selective antagonists for the 5-HT7 receptor in conjunction with 8-OH-DPAT.
5-HT1B RECEPTOR
Through their localization at presynaptic terminals, 5-HT1B receptors decrease the release of a range of neural signaling molecules including γ-aminobutyric acid (GABA), glutamate, acetylcholine, and serotonin (Chadha et al. 2000; Golembiowska and Dziubina 2002; Matsuoka et al. 2004; Mlinar et al. 2003; Mooney et al. 1994; Sari et al. 2004; Singer et al. 1996; Stanford and Lacey 1996). In the IC, the selective serotonin 1B agonist CP93129 usually increased excitability. In conjunction with its reported association with GABAergic neurons (Peruzzi and Dut 2004), this effect is consistent with the 5-HT1B receptor decreasing the release of GABA at terminals of neurons presynaptic to the ones recorded. Because the 5-HT1B receptors are generally proposed to be localized to the presynaptic terminal, activating this receptor would not necessarily be expected to change the spike count of neurons expressing it. Although 5-HT1B receptors are found on IC neurons that are not GABAergic (Peruzzi and Dut 2004), it is unlikely that an inhibition of glutamate release was a major effect of CP93129 in this study because CP93129 rarely caused a decrease in spike count.
5-HT2 receptors
5-HT2C RECEPTOR
The most selective 5-HT2 agonist tested in this study was the 5-HT2C agonist, MK212. This receptor has a postsynaptic localization in many brain regions (Barnes and Sharp 1999), although it may be associated with presynaptic terminals in a few (López-Giménez et al. 2001). The 5-HT2C receptor is upregulated in the IC in response to cochlear ablation (Holt et al. 2005). Activation of the 5-HT2C receptor depolarizes target neurons and may, as a consequence, facilitate neural activity or increase neurotransmitter release (Nair and Gudelsky 2004; Stanford and Lacey 1996). Consistent with these characteristics, MK212 increased the excitability of most of the IC neurons that it affected. CP93129, the 5-HT1B agonist, also caused increases in excitability. However, it is unlikely that MK212 directly altered the activity of inhibitory neurons, or at least of inhibitory interneurons, in this study. This is because an MK212-induced increase in the firing of a inhibitory interneuron should result in decreases in excitability in some postsynaptic neurons, and such decreases in excitability were rarely seen when MK212 was iontophoresed. Therefore a restriction of the effects of MK212 to excitatory neurons or to inhibitory IC projection neurons is more consistent with the data (Fig. 9).
5-HT2A/2C RECEPTOR
DOI is a less selective partial agonist at multiple 5-HT2 receptors, including 5-HT2A and 5-HT2C receptors (Marek and Aghajanian 1996; Porter et al. 1999). In the lateral superior olive, a brain stem auditory nucleus, a broad agonist for 5-HT2 receptors, α-Me-5-HT, caused an increase in spontaneous inhibitory potentials during a limited developmental window, most likely arising from an increase in the excitability of presynaptic inhibitory projections, although this agonist also reduced the amplitude of evoked postsynaptic currents (PSCs) (Fitzgerald and Sanes 1999). In the current study, DOI decreased spike count and increased first-spike latency (Figs. 2 and 3). However, DOI did not usually mimic the excitatory effects of MK212, the more selective 5-HT2C agonist, in that it rarely increased firing. One hypothesis that would account for the predominantly inhibitory effect of DOI is that it acted through 5-HT2A receptors rather than 5-HT2C receptors in this study. Indeed, in some preparations DOI has been reported to be more selective for the 5-HT2A receptor than for the 5-HT2C receptor (Knight et al. 2004; Porter et al. 1999). However, this hypothesis has some weaknesses. The first of these is that the 5-HT2A receptor has been observed within IC in some studies (Cornea-Hébert 1999) but not others (Peruzzi and Dut 2004; Pompeiano et al. 1994). In addition, the effects of DOI could also be attributed to the 5-HT2B receptor, which DOI also activates with relatively high affinity (Hoyer et al. 1994; Porter et al. 1999). Because of these uncertainties, the 5-HT2A receptor has not been included in the model of Fig. 9.
Functional considerations
The hypothesis that serotonin acts as a state-dependent filter for auditory processing is supported by methodologically diverse sources of evidence. Fluctuations in the levels of serotonin in the auditory system are thought to reflect the activity patterns of the projecting serotonergic neurons of the dorsal and median raphe groups, which fire more frequently during periods of heightened behavioral arousal (Jacobs and Fornal 1999; Klepper and Herbert 1991; Shima et al. 1986; Trulson and Jacobs 1979, 1981). Complementing these findings, increased levels of serotonin are associated with increased gain control (Hegerl et al. 2001) and reduced prepulse gating (Kehne et al. 1996) of auditory evoked potentials.
Within the IC, anatomical and physiological evidence suggests the involvement of serotonin or particular serotonin receptors in a number of specific aspects of auditory function (reviewed in Hurley et al. 2002, 2004). Most specifically, serotonin 1A and 2 receptors are capable of reducing aversive responses elicited by electrical stimulation of the IC (Melo and Brandão 1995). More relevant to auditory encoding are the effects of serotonin on the representation of stimulus frequency. Serotonin changes the frequency tuning of over half of inferior colliculus neurons (Hurley and Pollak 2001), through either broad shifts in responsiveness to sound or by highly frequency specific changes limited to just the high- or low-frequency borders of the tuning curve. For either type of change, the most common effect of serotonin is to restrict the range of frequencies to which neurons respond, although in a smaller subset of neurons serotonin expands frequency tuning. In Mexican free-tailed bats, the effects of serotonin on frequency tuning probably account for the finding that serotonin changes the selectivity of IC neurons for acoustically complex communication vocalizations (Hurley and Pollak 2005a). In the presence of serotonin, most IC neurons become more selective for species-specific vocalizations. Across the IC, this greater selectivity extrapolates to less overlap in the populations of neurons responding to different calls. Thus one function of serotonin may be to act as a frequency filter on ascending auditory information, increasing the selectivities of individual neurons and neuron populations. Whether these increasingly distinct central representations of sound contribute to the ability to more sharply discriminate among sounds has not yet been tested behaviorally.
The current experiments suggest that the roles of different receptors in mediating the effects of serotonin on frequency tuning may be quite distinct. Different agonists caused changes in bandwidth that were both quantitatively and qualitatively different (Fig. 4), with some agonists like 8-OH-DPAT (5-HT1A) predominantly narrowing frequency tuning and other agonists like CP93129 (5-HT1B) and MK212 (5-HT2C) broadening tuning. This finding is interesting in comparison to the finding that serotonin itself usually narrows frequency tuning because it raises the possibility that the receptors that decrease the bandwidth of neural responses play the largest role in mediating the effects of serotonin on tuning. A second finding that suggests distinctions between the roles of different receptors is that agonists of specific receptors also targeted different classes of neurons, in ways that were consistent with differential effects on either excitatory versus inhibitory neurons or neurons with V- versus non-V-type frequency-tuning curves. Most notably, the 5-HT1 agonists affected equal numbers of non-V- and V-type neurons, whereas the 5-HT2C agonist affected a lower proportion of non-V-type neurons. The scenario that emerges from these findings is a highly dynamic regulation of frequency coding by serotonin. As the levels of serotonin change with behavioral state, its net effects on frequency tuning are likely to be governed by the characteristics of its receptors, including the differing affinities of receptor subtypes for serotonin and the expression patterns of different receptors on different neuron classes or in discrete subcellular compartments.
The organized expression patterns of serotonin receptors and the varying postsynaptic effects of these receptors are consistently observed characteristics of the effector mechanisms of serotonergic modulation within multiple sensory systems (Hurley et al. 2004). These effectors translate diffuse serotonergic signals into the selective reconfiguration of neural circuitry. The presence of the same types of mechanisms within the IC raises the intriguing possibility that different receptors could be used as tools to probe the function of discrete neural networks within this complex and behaviorally important auditory region.
Acknowledgments
The author thanks Drs. A. M. Thompson, G. T. Smith, and T. Cleland for helpful comments on the manuscript.
GRANTS
This work was supported in part by National Institute of Deafness and Other Communication Disorders Grants DC-006608 and DC-00391.
References
- Bacon WL, Beck SG. 5-Hydroxytryptamine(7) receptor activation decreases slow afterhyperpolarization amplitude in CA3 hippocampal pyramidal cells. J Pharmacol Exp Ther. 2000;294:672–679. [PubMed] [Google Scholar]
- Barnes N, Sharp T. A review of central 5-HT receptors and their function. Neuropharmacology. 1999;38:1083–1152. doi: 10.1016/s0028-3908(99)00010-6. [DOI] [PubMed] [Google Scholar]
- Beique JC, Chapin-Penick EM, Mladenovic L, Andrade R. Serotonergic facilitation of synaptic activity in the developing rat prefrontal cortex. J Physiol. 2004;556:739–754. doi: 10.1113/jphysiol.2003.051284. [DOI] [PMC free article] [PubMed] [Google Scholar]
- Bergqvist P, Dong J, Blier P. Effect of atypical antipsychotic drugs on 5-HT2 receptors in the rat orbito-frontal cortex: an in vivo electrophysiological study. Psychopharmacology (Berl) 1999;143:89–96. doi: 10.1007/s002130050923. [DOI] [PubMed] [Google Scholar]
- Brandão M, Melo L, Cardoso S. Mechanisms of defense in the inferior colliculus. Behav Brain Res. 1993;58:49–55. doi: 10.1016/0166-4328(93)90089-9. [DOI] [PubMed] [Google Scholar]
- Brandão ML, Lopez-Garcia JA, Graeff FG, Roberts MHT. Electrophysiological evidence for excitatory 5-HT2 and depressant 5-HT1A receptors on neurones of the rat midbrain tectum. Brain Res. 1991;556:259–266. doi: 10.1016/0006-8993(91)90313-k. [DOI] [PubMed] [Google Scholar]
- Carli M, Baviera M, Invernizzi RW, Balducci C. Dissociable contribution of 5-HT1A and 5-HT2A receptors in the medial prefrontal cortex to different aspects of executive control such as impulsivity and compulsive perseveration in rats. Neuropsychopharmacology. 2006;31:757–767. doi: 10.1038/sj.npp.1300893. [DOI] [PubMed] [Google Scholar]
- Casseday JH, Covey E. Frequency tuning properties of neurons in the inferior colliculus of an FM bat. J Comp Neurol. 1992;319:34–50. doi: 10.1002/cne.903190106. [DOI] [PubMed] [Google Scholar]
- Chadha A, Sur C, Atack J, Duty S. The 5HT(1B) receptor agonist, CP-93129, inhibits [(3)H]-GABA release from rat globus pallidus slices and reverses akinesia following intrapallidal injection in the reserpine-treated rat. Br J Pharmacol. 2000;130:1927–1932. doi: 10.1038/sj.bjp.0703526. [DOI] [PMC free article] [PubMed] [Google Scholar]
- Chase SM, Young ED. Limited segregation of different types of sound localization information among classes of units in the inferior colliculus. J Neurosci. 2005;25:7575–7585. doi: 10.1523/JNEUROSCI.0915-05.2005. [DOI] [PMC free article] [PubMed] [Google Scholar]
- Cornea-Hébert V, Riad M, Wu C, Singh S, Descarries L. Cellular and subcellular distribution of the serotonin 5-HT2A receptor in the central nervous system of adult rat. J Comp Neurol. 1999;409:187–209. doi: 10.1002/(sici)1096-9861(19990628)409:2<187::aid-cne2>3.0.co;2-p. [DOI] [PubMed] [Google Scholar]
- Craven R, Grahame-Smith D, Newberry N. 5-HT1A and 5-HT2 receptors differentially regulate the excitability of 5-HT-containing neurones of the guinea pig dorsal raphe nucleus in vitro. Brain Res. 2001;899:159–168. doi: 10.1016/s0006-8993(01)02221-1. [DOI] [PubMed] [Google Scholar]
- Ehret G, Egorova M, Hage SR, Muller BA. Spatial map of frequency tuning-curve shapes in the mouse inferior colliculus. Neuroreport. 2003;14:1365–1369. doi: 10.1097/01.wnr.0000078545.07662.85. [DOI] [PubMed] [Google Scholar]
- el Mansari M, Blier P. In vivo electrophysiological characterization of 5-HT receptors in the guinea pig head of caudate nucleus and orbitofrontal cortex. Neuropharmacology. 1997;36:577–588. doi: 10.1016/s0028-3908(97)00035-x. [DOI] [PubMed] [Google Scholar]
- Fitzgerald KK, Sanes DH. Serotonergic modulation of synapses in the developing gerbil lateral superior olive. J Neurophysiol. 1999;81:2743–2752. doi: 10.1152/jn.1999.81.6.2743. [DOI] [PubMed] [Google Scholar]
- Gill CH, Soffin EM, Hagan JJ, Davies CH. 5-HT7 receptors modulate synchronized network activity in rat hippocampus. Neuropharmacology. 2002;42:82–92. doi: 10.1016/s0028-3908(01)00149-6. [DOI] [PubMed] [Google Scholar]
- Golembiowska K, Dziubina A. Inhibition of amino acid release by 5-HT1B receptor agonist in the rat prefrontal cortex. Pol J Pharmacol. 2002;54:625–631. [PubMed] [Google Scholar]
- Harlan R, Yuan Y, Garcia M. Serotonin 5-HT2C receptors in central auditory pathways. ARO Abstr. 2000;23:113. [Google Scholar]
- Hassanain M, Bhatt S, Siegel A. Differential modulation of feline defensive rage behavior in the medial hypothalamus by 5-HT1A and 5-HT2 receptors. Brain Res. 2003;981:201–209. doi: 10.1016/s0006-8993(03)03036-1. [DOI] [PubMed] [Google Scholar]
- Havey DC, Caspary DM. A simple technique for constructing “piggy-back” multibarrel microelectrodes. Electroencephalogr Clin Neurophysiol. 1980;48:249–251. doi: 10.1016/0013-4694(80)90313-2. [DOI] [PubMed] [Google Scholar]
- Hegerl U, Gallinat J, Juckel G. Event-related potentials. Do they reflect central serotonergic neurotransmission and do they predict clinical response to serotonin agonists? J Affect Disord. 2001;62:93–100. doi: 10.1016/s0165-0327(00)00353-0. [DOI] [PubMed] [Google Scholar]
- Heidmann D, Szot P, Kohen R, Hamblin M. Function and distribution of three rat 5-hydroxytryptamine7 (5-HT7) receptor isoforms produced by alternative splicing. Neuropharmacology. 1998;37:1621–1632. doi: 10.1016/s0028-3908(98)00070-7. [DOI] [PubMed] [Google Scholar]
- Hernández O, Espinosa N, Pérez-González D, Malmierca MS. The inferior colliculus of the rat: a quantitative analysis of monaural frequency response areas. Neuroscience. 2005;132:203–217. doi: 10.1016/j.neuroscience.2005.01.001. [DOI] [PubMed] [Google Scholar]
- Holt AG, Asako M, Lomax CA, MacDonald JW, Tong L, Lomax MI, Altschuler RA. Deafness-related plasticity in the inferior colliculus: gene expression profiling following removal of peripheral activity. J Neurochem. 2005;93:1069–1086. doi: 10.1111/j.1471-4159.2005.03090.x. [DOI] [PubMed] [Google Scholar]
- Hoyer D, Clarke DE, Fozard JR, Hartig PR, Martin GR, Mylecharane EJ, Saxena PR, Humphrey PP. International Union of Pharmacology classification of receptors for 5-hydroxytryptamine (Serotonin) Pharmacol Rev. 1994;46:157–203. [PubMed] [Google Scholar]
- Huang X, Mooney RD, Rhoades RW. Effects of serotonin on retinotectal-, corticotectal-, and glutamate-induced activity in the superior colliculus of the hamster. J Neurophysiol. 1993;70:723–732. doi: 10.1152/jn.1993.70.2.723. [DOI] [PubMed] [Google Scholar]
- Huidobro-Toro J, Valenzuela C, Harris R. Modulation of GABAA receptor function by G protein-coupled 5-HT2C receptors. Neuropharmacology. 1996;35:1355–1363. doi: 10.1016/s0028-3908(96)00084-6. [DOI] [PubMed] [Google Scholar]
- Hurley LM, Devilbiss D, Waterhouse B. A matter of focus: monoaminergic modulation of stimulus coding in mammalian sensory networks. Curr Opin Neurobiol. 2004;14:488–495. doi: 10.1016/j.conb.2004.06.007. [DOI] [PubMed] [Google Scholar]
- Hurley LM, Pollak G. Serotonin differentially modulates responses to tones and frequency-modulated sweeps in the inferior colliculus. J Neurosci. 1999;19:8071–8082. doi: 10.1523/JNEUROSCI.19-18-08071.1999. [DOI] [PMC free article] [PubMed] [Google Scholar]
- Hurley LM, Pollak G. Serotonin effects on frequency tuning of inferior colliculus neurons. J Neurophysiol. 2001;85:828–842. doi: 10.1152/jn.2001.85.2.828. [DOI] [PubMed] [Google Scholar]
- Hurley LM, Pollak G. Serotonin modulates responses to species-specific vocalizations in the inferior colliculus. J Comp Physiol A Neuroethol Sens Neural Behav Physiol. 2005a;191:535–546. doi: 10.1007/s00359-005-0623-y. [DOI] [PubMed] [Google Scholar]
- Hurley LM, Pollak G. Serotonin shifts first-spike latencies of inferior colliculus neurons. J Neurosci. 2005b;25:7876–7886. doi: 10.1523/JNEUROSCI.1178-05.2005. [DOI] [PMC free article] [PubMed] [Google Scholar]
- Hurley LM, Thompson A. Serotonergic innervation of the auditory brainstem of the Mexican free-tailed bat, Tadarida brasiliensis. J Comp Neurol. 2001;435:77–88. doi: 10.1002/cne.1194. [DOI] [PubMed] [Google Scholar]
- Hurley LM, Thompson AM, Pollak GD. Serotonin in the inferior colliculus. Hear Res. 2002;168:1–11. doi: 10.1016/s0378-5955(02)00365-9. [DOI] [PubMed] [Google Scholar]
- Jacobs B, Fornal C. Activity of serotonergic neurons in behaving animals. Neuropsychopharmacology. 1999;21:9s–15s. doi: 10.1016/S0893-133X(99)00012-3. [DOI] [PubMed] [Google Scholar]
- Kaiser A, Covey E. 5-HT innervation of the auditory pathway in birds and bats. In: Syka JL, editor. Acoustical Signal Processing in the Central Auditory System. Vol. 71. New York: Plenum; 1997. 78 pp. [Google Scholar]
- Katsurabayashi S, Kubota H, Tokutomi N, Akaike N. A distinct distribution of functional presynaptic 5-HT receptor subtypes on GABAergic nerve terminals projecting to single hippocampal CA1 pyramidal neurons. Neuropharmacology. 2003;44:1022–1030. doi: 10.1016/s0028-3908(03)00103-5. [DOI] [PubMed] [Google Scholar]
- Kehne JH, Padich RA, McCloskey TC, Taylor VL, Schmidt CJ. 5-HT modulation of auditory and visual sensorimotor gating: I. Effects of 5-HT releasers on sound and light prepulse inhibition in Wistar rats. Psychopharmacology (Berl) 1996;124:95–106. doi: 10.1007/BF02245609. [DOI] [PubMed] [Google Scholar]
- Klepper A, Herbert H. Distribution and origin of noradrenergic and serotonergic fibers in the cochlear nucleus and inferior colliculus of the rat. Brain Res. 1991;557:190–201. doi: 10.1016/0006-8993(91)90134-h. [DOI] [PubMed] [Google Scholar]
- Klug A, Bauer EE, Hanson JT, Hurley L, Meitzen J, Pollak GD. Response selectivity for species-specific calls in the inferior colliculus of Mexican free-tailed bats is generated by inhibition. J Neurophysiol. 2002;88:1941–1954. doi: 10.1152/jn.2002.88.4.1941. [DOI] [PubMed] [Google Scholar]
- Knight AR, Misra A, Quirk K, Benwell K, Revell D, Kennett G, Bickerdike M. Pharmacological characterisation of the agonist radioligand binding site of 5-HT(2A), 5-HT(2B) and 5-HT(2C) receptors. Naunyn Schmiedebergs Arch Pharmacol. 2004;370:114–123. doi: 10.1007/s00210-004-0951-4. [DOI] [PubMed] [Google Scholar]
- Koyama S, Matsumoto N, Murakami N, Kubo C, Nabekura J, Akaike N. Role of presynaptic 5-HT1A and 5-HT3 receptors in modulation of synaptic GABA transmission in dissociated rat basolateral amygdala neurons. Life Sci. 2002;72:375–387. doi: 10.1016/s0024-3205(02)02280-4. [DOI] [PubMed] [Google Scholar]
- Lanfumey L, Hamon M. Central 5-HT(1A) receptors: regional distribution and functional characteristics. Nucl Med Biol. 2000;27:429–435. doi: 10.1016/s0969-8051(00)00107-4. [DOI] [PubMed] [Google Scholar]
- Li L, Yue Q. Auditory gating processes and binaural inhibition in the inferior colliculus. Hear Res. 2002;168:98–109. doi: 10.1016/s0378-5955(02)00356-8. [DOI] [PubMed] [Google Scholar]
- Lindefors N, Barati S, O’Connor WT. Differential effects of single and repeated ketamine administration on dopamine, serotonin and GABA transmission in rat medial prefrontal cortex. Brain Res. 1997;759:205–212. doi: 10.1016/s0006-8993(97)00255-2. [DOI] [PubMed] [Google Scholar]
- López-Giménez JF, Mengod G, Palacios JM, Vilaró MT. Regional distribution and cellular localization of 5-HT2C receptor mRNA in monkey brain: comparison with [3H]mesulergine binding sites and choline acetyl-transferase mRNA. Synapse. 2001;42:12–26. doi: 10.1002/syn.1095. [DOI] [PubMed] [Google Scholar]
- Marek GJ, Aghajanian GK. LSD and the phenethylamine hallucinogen DOI are potent partial agonists at 5-HT2A receptors on interneurons in rat piriform cortex. J Pharmacol Exp Ther. 1996;278:1373–1382. [PubMed] [Google Scholar]
- Matsuoka T, Hasuo H, Akasu T. 5-Hydroxytryptamine 1B receptors mediate presynaptic inhibition of monosynaptic IPSC in the rat dorsolateral septal nucleus. Neurosci Res. 2004;48:229–238. doi: 10.1016/j.neures.2003.11.004. [DOI] [PubMed] [Google Scholar]
- Maxwell CR, Ehrlichman RS, Liang Y, Trief D, Kanes SJ, Karp J, Siegel SJ. Ketamine produces lasting disruptions in encoding of sensory stimuli. J Pharmacol Exp Ther. 2006;316:315–324. doi: 10.1124/jpet.105.091199. [DOI] [PubMed] [Google Scholar]
- Melo LL, Brandão ML. Role of 5-HT1A and 5-HT2 receptors in the aversion induced by electrical stimulation of inferior colliculus. Pharmacol Biochem Behav. 1995;51:317–321. doi: 10.1016/0091-3057(94)00387-x. [DOI] [PubMed] [Google Scholar]
- Miko I, Sanes D. Short-term changes in gain in the inferior colliculus are calcium- and serotonin-dependent. ARO Abstr. 2004;2004:1167. [Google Scholar]
- Mlinar B, Falsini C, Corradetti R. Pharmacological characterization of 5-HT(1B) receptor-mediated inhibition of local excitatory synaptic transmission in the CA1 region of rat hippocampus. Br J Pharmacol. 2003;138:71–80. doi: 10.1038/sj.bjp.0705026. [DOI] [PMC free article] [PubMed] [Google Scholar]
- Mooney R, Huang X, Shi M, Bennett-Clarke C, Rhoades R. Serotonin modulates retinotectal and corticotectal convergence in the superior colliculus. Prog Brain Res. 1996;112:57–69. doi: 10.1016/s0079-6123(08)63320-8. [DOI] [PubMed] [Google Scholar]
- Mooney R, Shi M, Rhoades R. Modulation of retinotectal transmission by presynaptic 5-HT1B receptors in the superior colliculus of the adult hamster. J Neurophysiol. 1994;72:3–13. doi: 10.1152/jn.1994.72.1.3. [DOI] [PubMed] [Google Scholar]
- Morales M, Battenberg E, Bloom FE. Distribution of neurons expressing immunoreactivity for the 5HT3 receptor subtype in the rat brain and spinal cord. J Comp Neurol. 1998;402:385–401. [PubMed] [Google Scholar]
- Nair SG, Gudelsky GA. Activation of 5-HT2 receptors enhances the release of acetylcholine in the prefrontal cortex and hippocampus of the rat. Synapse. 2004;53:202–207. doi: 10.1002/syn.20054. [DOI] [PubMed] [Google Scholar]
- Oliver DL, Huerta MF. Inferior and superior colliculi. In: Webster DB, Popper AN, Fay RR, editors. The Mammalian Auditory Pathway: Neuroanatomy. New York: Springer-Verlag; 1992. pp. 168–221. [Google Scholar]
- Oliver DL, Kuwada S, Yin TC, Haberly LB, Henkel CK. Dendritic and axonal morphology of HRP-injected neurons in the inferior colliculus of the cat. J Comp Neurol. 1991;303:75–100. doi: 10.1002/cne.903030108. [DOI] [PubMed] [Google Scholar]
- Oliver DL, Winer JA, Beckius GE, Saint Marie RL. Morphology of GABAergic neurons in the inferior colliculus of the cat. J Comp Neurol. 1994;340:27–42. doi: 10.1002/cne.903400104. [DOI] [PubMed] [Google Scholar]
- Peruzzi D, Dut A. GABA, serotonin and serotonin receptors in the rat inferior colliculus. Brain Res. 2004;998:247–250. doi: 10.1016/j.brainres.2003.10.059. [DOI] [PubMed] [Google Scholar]
- Pollak GD, Burger RM, Klug A. Dissecting the circuitry of the auditory system. Trends Neurosci. 2003;26:33–39. doi: 10.1016/s0166-2236(02)00009-7. [DOI] [PubMed] [Google Scholar]
- Pollak GD, Burger RM, Park TJ, Klug A, Bauer EE. Roles of inhibition for transforming binaural properties in the brainstem auditory system. Hear Res. 2002;168:60–78. doi: 10.1016/s0378-5955(02)00362-3. [DOI] [PubMed] [Google Scholar]
- Pompeiano M, Palacios JM, Mengod G. Distribution of the serotonin 5-HT2 receptor family mRNAs: comparison between 5-HT2A and 5-HT2C receptors. Brain Res Mol Brain Res. 1994;23:163–178. doi: 10.1016/0169-328x(94)90223-2. [DOI] [PubMed] [Google Scholar]
- Porter RH, Benwell KR, Lamb H, Malcolm CS, Allen NH, Revell DF, Adams DR, Sheardown MJ. Functional characterization of agonists at recombinant human 5-HT2A, 5-HT2B and 5-HT2C receptors in CHO-K1 cells. Br J Pharmacol. 1999;128:13–20. doi: 10.1038/sj.bjp.0702751. [DOI] [PMC free article] [PubMed] [Google Scholar]
- Sari Y. Serotonin1B receptors: from protein to physiological function and behavior. Neurosci Biobehav Rev. 2004;28:565–582. doi: 10.1016/j.neubiorev.2004.08.008. [DOI] [PubMed] [Google Scholar]
- Schuller G. A cheap earphone for small animals with good frequency response in the ultrasonic frequency range. J Neurosci Methods. 1997;71:187–190. doi: 10.1016/s0165-0270(96)00142-2. [DOI] [PubMed] [Google Scholar]
- Schuller G, Radtke-Schuller S, Betz M. A stereotaxic method for small animals using experimentally determined reference profiles. J Neurosci Methods. 1986;18:339–350. doi: 10.1016/0165-0270(86)90022-1. [DOI] [PubMed] [Google Scholar]
- Shima K, Nakahama H, Yamamoto M. Firing properties of two types of nucleus raphe dorsalis neurons during the sleep-waking cycle and their responses to sensory stimuli. Brain Res. 1986;399:317–326. doi: 10.1016/0006-8993(86)91522-2. [DOI] [PubMed] [Google Scholar]
- Singer JH, Bellingham MC, Berger AJ. Presynaptic inhibition of glutamatergic synaptic transmission to rat motoneurons by serotonin. J Neurophysiol. 1996;76:799–807. doi: 10.1152/jn.1996.76.2.799. [DOI] [PubMed] [Google Scholar]
- Stanford IM, Lacey MG. Differential actions of serotonin, mediated by 5-HT1B and 5-HT2C receptors, on GABA-mediated synaptic input to rat substantia nigra pars reticulata neurons in vitro. J Neurosci. 1996;16:7566–7573. doi: 10.1523/JNEUROSCI.16-23-07566.1996. [DOI] [PMC free article] [PubMed] [Google Scholar]
- Thompson GC, Thompson AM, Garrett KM, Britton BH. Serotonin and serotonin receptors in the central auditory system. Otolaryngol Head Neck Surg. 1994;110:93–102. doi: 10.1177/019459989411000111. [DOI] [PubMed] [Google Scholar]
- To Z, Bonhaus D, Eglen R, Jakeman L. Characterization and distribution of putative 5-HT7 receptors in guinea-pig brain. Br J Pharmacol. 1995;115:107–116. doi: 10.1111/j.1476-5381.1995.tb16327.x. [DOI] [PMC free article] [PubMed] [Google Scholar]
- Tokarski K, Zahorodna A, Bobula B, Hess G. 5-HT7 receptors increase the excitability of rat hippocampal CA1 pyramidal neurons. Brain Res. 2003;993:230–234. doi: 10.1016/j.brainres.2003.09.015. [DOI] [PubMed] [Google Scholar]
- Trulson ME, Jacobs BL. Raphe unit activity in freely moving cats: correlation with level of behavioral arousal. Brain Res. 1979;163:135–150. doi: 10.1016/0006-8993(79)90157-4. [DOI] [PubMed] [Google Scholar]
- Trulson ME, Jacobs BL. Activity of serotonin-containing neurons in freely moving cats. In: Jacobs BL, Gelperin A, editors. Serotonin Neurotransmission and Behavior. Cambridge, MA: MIT Press; 1981. pp. 339–365. [Google Scholar]
- Vergé D, Calas A. Serotoninergic neurons and serotonin receptors: gains from cytochemical approaches. J Chem Neuroanat. 2000;18:41–56. doi: 10.1016/s0891-0618(99)00050-2. [DOI] [PubMed] [Google Scholar]
- Vilaró M, Cortés R, Mengod G. Serotonin 5-HT4 receptors and their mRNAs in rat and guinea pig brain: distribution and effects of neurotoxic lesions. J Comp Neurol. 2005;484:418–439. doi: 10.1002/cne.20447. [DOI] [PubMed] [Google Scholar]
- Villars PS, Kanusky JT, Dougherty TB. Stunning the neural nexus: mechanisms of general anesthesia. AANA J. 2004;72:197–205. [PubMed] [Google Scholar]
- Yan Z. Regulation of GABAergic inhibition by serotonin signaling in prefrontal cortex: molecular mechanisms and functional implications. Mol Neurobiol. 2002;26:203–216. doi: 10.1385/MN:26:2-3:203. [DOI] [PubMed] [Google Scholar]