Abstract
Background
Although the role of vascular pathology in multiple sclerosis (MS) lesions was suggested long ago, the derivation of these lesions from the vasculature has been difficult to assess in vivo. Ultra-high-field (e.g. 7T) MRI has provided an imaging tool for assessing vascular involvement in MS lesions due to markedly increased image resolution and susceptibility contrast of venous blood.
Objective
To describe the perivenous relationship of MS lesions on high resolution and contrast 7T MR susceptibility sensitive imaging.
Result
We demonstrate markedly enhanced detection of unique microvascular involvement that is associated with most of the visualized MS lesions with abnormal signals on and around venous wall on 7T as compared to 3T MRI.
Conclusions
These findings, which have never been shown on conventional field of MRI, not only allow for direct evidence of vascular pathogenesis in MS in vivo, but have important implications for monitoring lesion activity and therapeutic response.
Shortly after its first depiction in the early 19th century, multiple sclerosis (MS) garnered recognition as a progressive and disabling neurodegenerative disease. While a vascular pathogenesis linked to autoimmune myelin destruction by autoreactive T lymphocytes, was suggested long ago [1], the extent of microvascular abnormalities and their precise relationship to lesion development has been difficult to assess and appreciate in vivo until the recent remarkable advancements in MR imaging (MRI).
Ultra-high-field (>3T) MRI techniques, by virtue of increased signal-to-noise (SNR) ratio and enhanced susceptibility effects, lending to markedly improved image resolution and contrast [2], have the great potential to assess the venous vasculature in the early stages of lesion development. We describe 7T MRI in two patients with relapsing-remitting MS (RRMS), and relate our observations to early microvascular abnormalities as primary in vivo evidence of lesion development.
REPORT OF CASES
Two female patients with clinically-definite RRMS, Patient 1 aged 54 years and Patient 2 aged 39 years, who had received initial diagnoses 6 and 7 years earlier, respectively based on Poser’s criteria [3], and both with expanded disability status scale (EDSS) scores of 2.0, neither of whom had used steroids within 3 months and neither of whom had received immunomodulating medication 2 years prior to the current imaging study. Their informed consents were given for participation. Patient 1 first started with lower extremity mild muscle stiffness, and since then, has suffered repeated exacerbations of various symptoms including bilateral lower extremity weakness and paresthesias, vertigo, ataxia, diplopia, and dysphagia. At the time of the first 7T MR study, Patient 1 reported mildly disabling physical symptoms, and reported no change in symptomatology at follow-up.
Patient 2 first experienced symptoms of visual disturbance, and has suffered from visual changes, headache, fatigue, and clumsiness. During the course of the disease, her symptoms have fluctuated in intensity, although she claims to have been asymptomatic at the time when the current MRI was performed. Two aged-matched healthy female volunteers were included as normal controls.
MR IMAGING
Both patients underwent MR imaging at 7T, and Patient 1 also had follow-up studies at 7T and 3T with Gd-enhanced scan 9 months later. Before imaging, global shimming was performed to optimize the static field homogeneity. 2D high resolution T2*-weighted (gradient echo) imaging was acquired in the axial plane with the following imaging parameters: repetition time (TR)/echo time (TE)/flip angle=500ms/25ms/35°, slice thickness=2mm, acquisition matrix=1024×1024mm2, with pixel of 0.23×0.23mm2. This sequence was optimized to best visualize both venous structures and lesions. In addition, T2- and T1-weighted imaging was also performed. For comparison, in the follow studies of Patient 1, MR imaging was performed at 3T right after 7T scan. This includes T2- (TR/TE=8000/119) and T2*-weighted (TR/TE/FA=900/25/35°) as well as Gadolinium-enhanced T1-weighted imaging with 2mm-thick slices and 0.69×0.69mm2 pixel size.
RESULTS
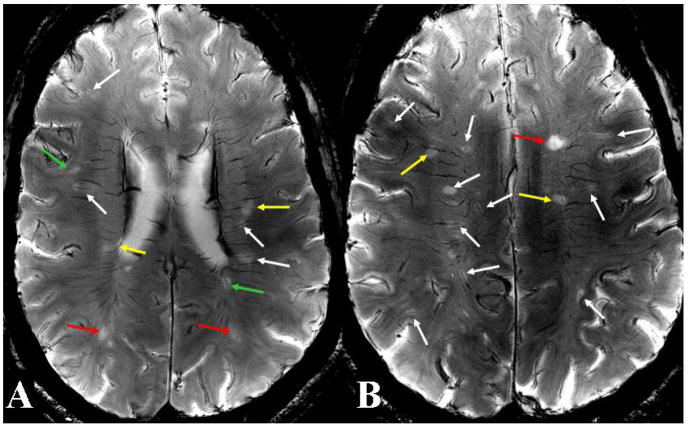
7T susceptibility sensitive T2*-weighted imaging, which allows for an unprecedented resolution (pixel size: 0.23×0.23mm2) and contrast of even rather small vascular structures, clearly delineates the intimate relation between lesions and veins in MS. In our two RRMS patients, we were able to demonstrate a total of 80 MS lesions, 58 and 22 lesions independently, and all lesions showed a strict perivascular distribution, following the form, orientation, and course of the vessels, this feature being best noted in small lesions (Figure 1). The diameter of veins associated with lesions ranged from 0.3mm–0.7mm.
Figure 1. 7T high resolution axial T2*-weighted images in Patient 1.
Two representative images at the levels of the lateral ventricles (A) and centrum semiovale (B) depict centrally-coursing veins in a context of various vascular abnormalities associated with MS lesions. These abnormalities include small lesions with clearly distinguishable central veins (white arrows), small lesions with hazy-appearing and indistinct central veins (green arrows), large lesions with well-defined central veins (yellow arrows), and large lesions with ill-defined central veins (red arrows). These different presentations may indicate different stages of lesion development and associated levels of vascular involvement.
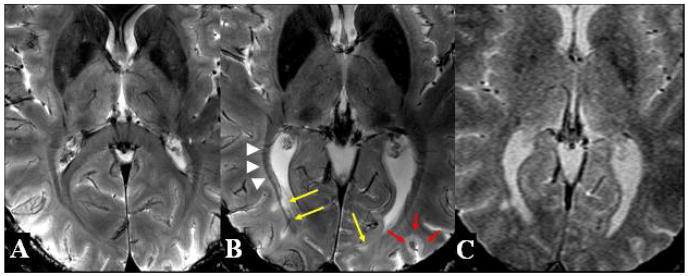
In Patient 1 on initial 7T scans, we found that 34 of 58 total lesions were small (less than 15mm2 in area), and of these, 23 and 11 were associated with well-defined and ill-defined central veins, respectively. In the 24 remaining large lesions, 11 of these had well-defined central veins and 13 obscured including 3 T1 black holes. Several small lesions showed subtle abnormal signal intensities strictly at the perivascular spaces, with well-defined central veins, as well as small lesions with relatively obscured veins, and large lesions with well-defined and ill-defined vessels (Figure 1). In Figure 2, white matter tracts, such as those of the optic radiations, being well depicted on 7T, allowed us to accurately visualize MS lesions along a venous distribution but not aligned with the course of the fiber tracts (Figure 2B). Compared to normal control (Figure 2A), there was marked increase in iron deposition in the basal ganglia and thalamic areas in this patient (Figure 2B). In addition, a lesion embedded within the cortical sulcus was found on 7T but not on 3T images (Figure 2B). On 3T T2*-weighted image (Figure 2C), the perivenous relationship of lesions is poorly detected as compared to 7T MRI with the similar sequence acquisitions.
Figure 2. T2*-weighted images at the level of the basal ganglia on 7T MRI in Normal Control (A) and Patient 1 (B) as well as on 3T MRI in Patient 1 (C).
The lesions (yellow arrows) in close proximity to the optic radiations (white arrowheads), as depicted, seem to follow a perivenous distribution and not that of the dense white matter fiber tracts. Compared to normal control, there is marked increased iron deposition in the basal ganglia and thalamic areas (white arrows). Also shown is a cortical lesion originating from the cortical sulcus (red arrows). Furthermore, the perivenous relationship of lesions and cortical lesion is poorly demonstrated on 3T compared to 7T MRI with the similar sequence acquisitions.
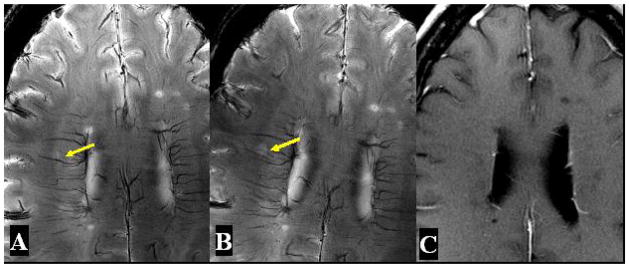
On follow-up imaging at 7T in Patient 1 nine months later, we noted the same number of total lesions, and furthermore, found that of the 34 small lesions counted, 5 had increased whereas 3 had decreased in size, with the 26 remaining lesions demonstrating no change (Figure 3). On 3T with Gd-enhanced scans, we did not note any contrast enhancement corresponding to lesions observed on 7T (Figure 3). In addition, venous vasculature associated with lesions was not visualized on either gradient-echo or T2-weighted imaging on 3T.
Figure 3. High resolution axial T2*-weighted images in Patient 1 at baseline (A) and follow up over nine months (B) on 7T as well as enhanced T1-weighted image (C) on 3T.
An example of one small lesion with abnormal perivascular signal (arrow) demonstrates an increased size of lesion and increased signal of central venous structure on the same 7T T2*-weighted images acquired 9 months later. On Gd-enhanced scans on 3T, no contrast enhancement is noted associated this lesion with increased size.
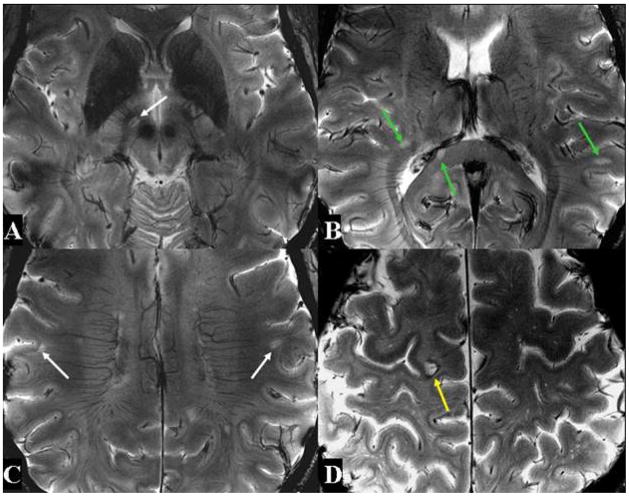
In Patient 2, we noted 16 small and 6 large lesions. Of these small lesions, 13 had well-defined veins in their centers, and 3 had indistinct veins, as noted in Figure 4. All except one of the large lesions were associated with indistinct central veins.
Figure 4. 7T high resolution axial T2*-weighted images in Patient 2.
Four representative images at different levels also demonstrate a variety of vascular abnormalities associated with MS lesions.
COMMENT
In 1916, James W. Dawson described thin and linear periventricular lesions (Dawson's fingers) at the initial stages of MS oriented around the long axis of central veins [4]. Since Dawson, further histological evidence has confirmed a close relation between inflammatory nature of MS plaques and microvasculature abnormalities [5]. Very few studies, however, have delineated the precise derivation of lesions from vascular inflammatory changes, in vivo.
Ultra-high-field (7T) systems have provided sophisticated imaging to improve the fundamental quantities underlying image resolution and contrast, and have allowed for a more detailed and accurate examination of neuropathological changes in disease processes such as MS. 7T MRI analysis in our two MS patients revealed a total of 80 MS lesions on T2*-weighted series, all associated with centrally-coursing veins. Close examination revealed subtle abnormalities in signal intensities in strict perivenous fashion in many lesions. This feature was especially true in smaller than larger lesions. We propose that these small lesions represent an early stage of MS plaque development, marked by beginnings of transendothelial migration of vascular inflammatory cells of lymphocytes and macrophages without apparent BBB breakdown. This is based on previously confirmed histopathological studies and lesion analysis that this angiocentric pattern of MS lesions were found in more smaller lesions in the absence of blood-brain barrier (BBB) breakdown or contrast enhancement on MRI, previously thought to be the first and earliest detectable inflammatory activity on imaging. In addition, the increase in some of these signal abnormalities around veins on follow up 7T scan (Figure 3), suggesting the lesion growth associated with vascular involvement.
Our findings established that approximately half of total MS lesions in our two patients are small with well-defined central veins, and that these diffuse, subtle signal abnormalities may correspond to early vascular changes. This represents the first time in vivo and only in vivo that such subtle vascular involvements have been diffused in nature. As shown with corticosteroids recommended for acute exacerbations to shorten duration and reduce inflammation, and immunomodulatory drugs to prevent progression and new lesion formation, markedly improved detection of these lesions on 7T MRI will have substantial ramifications on monitoring lesion development and therapeutic response. Therefore, utilizing ultra-high-field MRI for precise characterization of microvascular abnormalities may allow for immediate pharmacologic intervention directed at these perivascular changes.
On follow up studies in Patient 1, we were able to demonstrate a change in size in 23.5% (8 out of 34) small lesions over a period of nine months, with 14.7% increased and 8.8% decreased in size. Such changes in size in these small lesions may represent dynamic vascular inflammatory activity. In addition, we did not find any enhancement in association with all lesions visualized on 7T in this patient, suggesting relatively minor vascular damage due to the lower amounts of inflammatory activity.
In summary, our study, on the basis of increased detection of small and subtle perivenous or venous wall signal changes at 7T, attributable to high field strength, may represent, in fact, the earliest detectable vascular changes possible before BBB breakdown. The appreciation and assessment, in vivo, of early microvascular involvement in lesions is important in diagnosis, monitoring lesion progression, and determining therapeutic efficacy.
Acknowledgments
This work was supported by grant R01NS029029-16-1 from National Institute of Health (NIH). We would like to thank Hina Jaggi for her help in recruiting MS subjects.
References
- 1.Rindficisch E. Histologisches detail zu der grauen degeneration von gehirn und ruckenmark. Archives of Pathological Anatomy and Physiology. 1863;26:474–483. [Google Scholar]
- 2.Christoforidis GA, Bourekas EC, Baujan M, et al. High resolution MRI of the deep brain vascular anatomy at 8 Tesla: susceptibility-based enhancement of the venous structures. J Comput Assist Tomogr. 1999;23:857–66. doi: 10.1097/00004728-199911000-00008. [DOI] [PubMed] [Google Scholar]
- 3.Poser CM, Paty DW, Scheinberg L, et al. New diagnostic criteria for multiple sclerosis: guidelines for research protocols. Ann Neurol. 1983;13:227–31. doi: 10.1002/ana.410130302. [DOI] [PubMed] [Google Scholar]
- 4.Dawson J. The histology of disseminated sclerosis. Trans Roy Soc Edinb. 1916;50:517. [Google Scholar]
- 5.Adams CW, Poston RN, Buk SJ. Pathology, histochemistry and immunocytochemistry of lesions in acute multiple sclerosis. J Neurol Sci. 1989;92:291–306. doi: 10.1016/0022-510x(89)90144-5. [DOI] [PubMed] [Google Scholar]


