Abstract
Objective: To develop a new bioinformatic tool based on a data-mining approach for extraction of the most informative proteins that could be used to find the potential biomarkers for the detection of cancer. Methods: Two independent datasets from serum samples of 253 ovarian cancer and 167 breast cancer patients were used. The samples were examined by surface-enhanced laser desorption/ionization time-of-flight mass spectrometry (SELDI-TOF MS). The datasets were used to extract the informative proteins using a data-mining method in the discrete stationary wavelet transform domain. As a dimensionality reduction procedure, the hard thresholding method was applied to reduce the number of wavelet coefficients. Also, a distance measure was used to select the most discriminative coefficients. To find the potential biomarkers using the selected wavelet coefficients, we applied the inverse discrete stationary wavelet transform combined with a two-sided t-test. Results: From the ovarian cancer dataset, a set of five proteins were detected as potential biomarkers that could be used to identify the cancer patients from the healthy cases with accuracy, sensitivity, and specificity of 100%. Also, from the breast cancer dataset, a set of eight proteins were found as the potential biomarkers that could separate the healthy cases from the cancer patients with accuracy of 98.26%, sensitivity of 100%, and specificity of 95.6%. Conclusion: The results have shown that the new bioinformatic tool can be used in combination with the high-throughput proteomic data such as SELDI-TOF MS to find the potential biomarkers with high discriminative power.
Keywords: Proteomics, Discrete stationary wavelet transform, Data mining, Feature selection, Biomarker, Cancer classification
INTRODUCTION
A major problem in the treatment of cancer is the lack of a suitable technique for early diagnosis of the disease. Unfortunately, the breast and ovarian cancers are widespread within the population of women, and the early diagnosis of these cancers can greatly reduce the mortality rate (Jemal et al., 2007). The most widely used biomarkers do not present accurate diagnosis results (Alaoui-Jamali and Xu, 2006). Therefore, there is still a need for accurate biomarkers, including ones that can identify the ovarian and breast cancers in their early stage of development.
In recent years, researchers have tried to use proteomic technologies for identifying the set of proteins or peptides that are related to the disease (Liu et al., 2002; Ressom et al., 2005; Bhanot et al., 2006; Xu et al., 2006; Shin et al., 2008; Zhu et al., 2008). The surface-enhanced laser desorption/ionization time-of-flight mass spectrometry (SELDI-TOF MS) is currently the most viable technique that generates the protein patterns from biological fluids such as serum, plasma, and urine (Hu et al., 2005; Zinkin et al., 2008). Mass spectrometry is a high-throughput tool that generates a large-scale protein profile. Due to the large number of variables and the small size of samples, the data-mining approaches are necessary to overcome the challenges such as dimensionality reduction, feature selection, and biomarker identification (Thomas et al., 2006; Hilario and Kalousis, 2008).
In the earlier published works, SELDI-TOF MS based cancer diagnosis combined with a data-mining approach has been used to find new biomarkers with high discriminative power (Adam et al., 2002; Petricoin et al., 2002; Yu et al., 2005). In our study, we have developed a data-mining approach based on discrete stationary wavelet transform (DSWT) and discriminant analysis to find highly accurate biomarkers from proteomic profiles. Our method has shown good diagnostic results in the breast and ovarian cancer datasets.
MATERIALS AND METHODS
Data description
We applied our method on two publicly available proteomic datasets. These datasets, hereafter, referred to as DS1 and DS2, contained SELDI-TOF MS protein profiles of ovarian and breast cancers respectively. DS1 is freely available from proteomics databank of Food and Drug Administration of National Cancer Institute website (http://home.ccr.cancer.gov/ncifdaproteomics/ppatterns.asp). DS2 is available from Bioconductor website (http://bioconductor.org).
DS1 consists of 253 serum spectra composed of 15 154 distinct points on the mass-to-charge ratio axis (m/z values). DS2 consists of 167 spectra with 13 488 distinct m/z values. In these datasets, each spectrum is defined by m/z values in the range of 0~20 000 Da and corresponds to the points on the signal intensity axis representing the abundance of proteins in the serum sample. The distribution of samples for each dataset is illustrated in Table 1.
Table 1.
Distribution of samples for two datasets
| Datasets | Normal samples | Cancer samples |
| Ovarian cancer (DS1) | 91 | 162 |
| Breast cancer (DS2) | 77 | 90 |
Data modeling
From the modeling point of view, the mass spectral curve may be considered in terms of additive and independent components (Malyarenko et al., 2005; Hilario et al., 2006). We assumed that there were n measured spectra, each sampled in the time interval T of TOFs tj (j=1,...,T). The following mathematical expression can be written for the mass spectrum signal (Morris et al., 2005):
| yi(tj)=Bi(tj)+NiSi(tj)+εij, i=1,2,...,n. | (1) |
In this model, the signal intensity or abundance of a molecule, yi(tj), refers to each distinct mass in the TOF tj. The baseline, Bi(tj), denotes a systematic error that is mainly due to the molecules of the energy-absorbing matrix. The true signal, Si(tj), represents the peak profile of each molecule in the biological sample and is scaled in each spectrum by the normalization factor Ni. The last term, εij, shows the chemical noise that is assumed to have a Gaussian distribution.
Discrete stationary wavelet transform (DSWT)
The discrete wavelet transform (DWT) is an effective tool for dimensionality reduction and noise removal in the analysis of very high dimensionality data. In recent years, wavelets have been used for the analysis of proteomic data (Qu et al., 2003; Vannucci et al., 2005; Chen et al., 2007). It has been shown that the DSWT has a good performance in finding the informative peaks from MS data (Coombes et al., 2005). The DSWT is similar to the DWT except that the signal is never subsampled and instead filters are upsampled at each level of decomposition (Nason and Silverman, 1995) that has a redundant effect as there is no signal down sampling but is translation-invariant. Last property of the DSWT could lead to better performance in the feature selection from original data space via the selected wavelet coefficients.
Data preprocessing
The raw data obtained from SELDI-TOF mass spectrometer must be preprocessed before the feature selection process. The processing includes baseline removal, denoising, and normalization to reduce the systematic errors. The baseline and electrical noise components given in Eq.(1) must be removed from the spectra. In our approach, the DSWT was used for joint baseline removal and denoising. For baseline removal, the robust baseline estimation technique was applied to the approximation coefficients (Hu et al., 2007; Ruckstuhl et al., 2001). The soft thresholding method was used for denoising in the wavelet domain (Donoho, 1995). To reduce the experimental variations in the datasets, the spectral intensities of all samples were normalized according to the method described by Petricoin and Liotta (2004).
Dimensionality reduction
After applying DSWT to each spectrum, the wavelet thresholding was applied for dimensionality reduction. The wavelet shrinkage method was used to select the threshold value (Donoho and Johnstone, 1998). After choosing the threshold θ, the coefficients whose absolute values were less than θ were set to zero and the other coefficients were retained. For each spectrum, the survived coefficients could be different in different mass spectra.
The common coefficients, which survived from all the spectra, were selected for the subsequent feature extraction. The dataset can be represented by an N×M matrix D, where N is the number of samples and M is the number of m/z values. Using a voting method, a wavelet coefficient was kept if it survived in at least (1−α)×N samples, where α is a parameter in the range [0,1]. The greater α is, the more number of coefficients could be retained.
Wavelet coefficients selection
After the thresholding step, the dimensionality of data was reduced. However, still most of the survived features were irrelevant to differentiate between cancer and normal cases. To select a subset of wavelet coefficients, it was necessary to use a distance measure that distinguished between the two groups with high discriminative power. We applied Bhattacharyya distance as the feature selection criterion (Theodoridis and Koutroumbas, 2003).
Let S denote the subset of features that has a k-dimensional Gaussian distribution. For two-class problem, the Bhattacharyya distance (J B) is expressed as:
 , ,
|
(2) |
where μ and Σ are the sample mean vector and covariance matrix, respectively. In practice, stepwise forward search methods were used to select the near-optimal k features defined by J B.
Protein identification
In the MS data analysis, a set of candidate proteins will be identified to be used in the biomarker selection stage. After selecting k wavelet coefficients, we applied the inverse discrete stationary wavelet transform (IDSWT) to obtain the m/z ratio of proteins. Due to the length of mother wavelet, each coefficient could be related to some of the proteins in a mass interval. We used two-sided t-test P values to select one protein that had minimum P value in this window.
Biomarker selection
The subset of k proteins was identified via the method described above. A recursive support vector machine (R-SVM) algorithm (Zhang et al., 2006) was used to select the potential biomarkers that could discriminate between cancer and normal cases in the datasets successfully. To evaluate the discriminative ability of each selected feature in the training set, a 10-fold cross-validation approach was applied in the blind test set. The fold one was used as the training set in the feature selection process.
RESULTS
To evaluate the performance of the proposed method for biomarker identification, we analyzed the datasets described in Table 1. All the mass spectra were processed to remove the baseline and electrical noise according to the described procedure. In the entire preprocessing steps, the Daubechies mother wavelet was used with four vanishing moments. For discrimination purpose, training and testing sets were selected randomly for normal and cancer groups in each dataset. Due to the small number of samples in each dataset and the large number of features, we used 10-fold cross-validation to avoid any bias and error during feature selection and sample classification.
Effect of wavelet thresholding
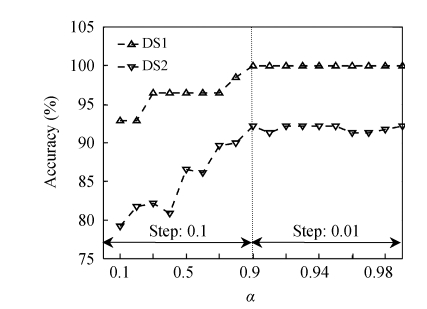
Using the wavelet shrinkage thresholding method and a voting procedure, the length of data was reduced to a lower dimension in the two datasets. To select the survived coefficients after thresholding, we varied the value of α from 0.1 to 0.9 with a step of 0.1, and from 0.9 to 0.99 with a step of 0.01. In each step, the accuracy of diagnosis was used as a desirable measure to choose an appropriate value for α. A plot of the accuracy versus the value of α is shown in Fig.1. We selected α=0.9 according to the first maximum point on the curve. As shown in Table 2, the remaining coefficients have yet a good discrimination power compared with the complete wavelet data. We used the SVM classifier to evaluate the performance of diagnosis in the wavelet domain.
Fig. 1.
The accuracy of diagnosis versus the threshold values (α) in the wavelet domain
Table 2.
Performance of classification in regard to the number of features (n) in the wavelet domain
| Dataset | Threshold value α=1 |
Threshold value α=0.9 |
||
| n | Accuracy (%) | n | Accuracy (%) | |
| DS1 | 15154 | 100 | 3888 | 100 |
| DS2 | 13488 | 92.60 | 1923 | 92.18 |
Coefficients selection
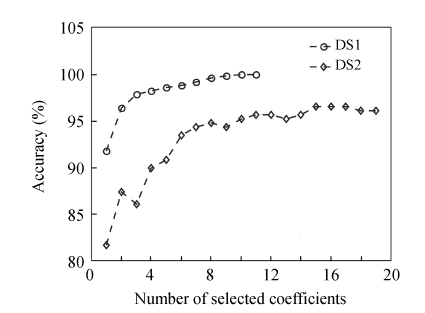
Using DSWT and the proposed thresholding procedure, the dimensionality was reduced in each dataset. However, most of the survived coefficients had irrelevant discrimination performance. We applied a stepwise procedure to select the k features by maximizing a distance measure. To decide how many coefficients needed to be selected, the accuracy was used as the measure. By using 10-fold cross-validation, we selected the k variables according to the first maximum point of the accuracy in each dataset. The result is shown in Fig.2. We chose the 10 and 15 wavelet coefficients in the DS1 and DS2, respectively, corresponding to the point on the curves where the maximum value of accuracy reached.
Fig. 2.
The classification error for the selected coefficients
Protein identification using IDSWT
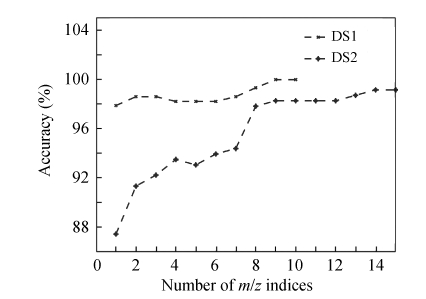
We applied IDSWT to each selected coefficient by discriminant analysis. Due to the order of mother wavelet (Daubechies 4 in this study), each coefficient would relate to a set of eight neighboring m/z values in the reconstructed spectra. In our data-mining approach, the two-sided t-test was used to select one protein from eight neighbor masses. Table 3 gives the P values of detected proteins versus m/z indices in each dataset. Fig.3 shows the accuracy of identified proteins.
Table 3.
The P value of identified proteins
| Dataset | m/z index | P value |
| DS1 | 1677 | 1.62×10−82 |
| 1268 | 3.46×10⁻¹⁰ | |
| 5531 | 1.43×10⁻³¹ | |
| 1662 | 9.30×10⁻²⁵ | |
| 2240 | 2.44×10−59 | |
| 1441 | 3.36×10⁻¹⁵ | |
| 2532 | 4.96×10⁻³⁵ | |
| 2314 | 2.73×10−50 | |
| 2655 | 4.08×10⁻¹⁰ | |
| 1429 | 0.0041 | |
| DS2 | 1657 | 0.0012 |
| 373 | 4.47×10⁻⁸ | |
| 1569 | 1.03×10⁻⁷ | |
| 6812 | 0.0361 | |
| 3258 | 1.15×10⁻⁵ | |
| 5380 | 0.0264 | |
| 3281 | 6.76×10⁻⁵ | |
| 6531 | 0.0137 | |
| 5028 | 0.0535 | |
| 2036 | 1.81×10⁻⁷ | |
| 2037 | 2.09×10⁻⁷ | |
| 9108 | 0.0004 | |
| 1863 | 0.0379 | |
| 7984 | 0.0029 | |
| 8521 | 0.0546 |
Fig. 3.
The accuracy of identified proteins using 10-fold cross-validation SVM classifier
Selection of potential biomarkers
Through the 10-fold cross-validation method, we trained an SVM classifier with detected proteins listed in Table 3 for each dataset. The sets of five and eight proteins were finally selected as potential biomarkers by a recursive feature elimination algorithm (R-SVM) in DS1 and DS2, respectively. Table 4 lists the identified biomarkers for each dataset. Using the detected biomarkers, we evaluated the performance of classification in the blind test set. By two classifiers [SVM and linear discriminate analysis (LDA)], we achieved the perfect discrimination in DS1. Also, we obtained accuracy of 98.26%, sensitivity of 100%, and specificity of 95.6% for DS2. Table 5 shows the performance of classification.
Table 4.
The potential biomarkers identified by R-SVM
| Dataset | m/z index | m/z value (Da) |
| DS1 | 1268 | 139.38 |
| 2532 | 557.06 | |
| 2240 | 435.85 | |
| 2655 | 612.56 | |
| 1429 | 177.11 | |
| DS2 | 1657 | 287.85 |
| 373 | 2.72 | |
| 1569 | 256.73 | |
| 3258 | 1151.51 | |
| 3281 | 1168.03 | |
| 2037 | 441.80 | |
| 9108 | 9102.50 | |
| 1863 | 367.37 |
Table 5.
The results of classification using selected biomarkers in each dataset
| Dataset | SVM |
LDA |
||||
| Accuracy (%) | Sensitivity (%) | Specificity (%) | Accuracy (%) | Sensitivity (%) | Specificity (%) | |
| DS1 | 100 | 100 | 100 | 100 | 100 | 100 |
| DS2 | 98.26 | 100 | 95.6 | 98.26 | 100 | 95.6 |
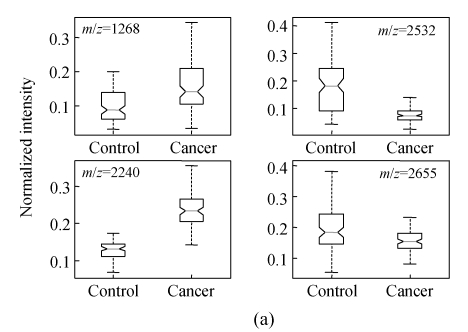
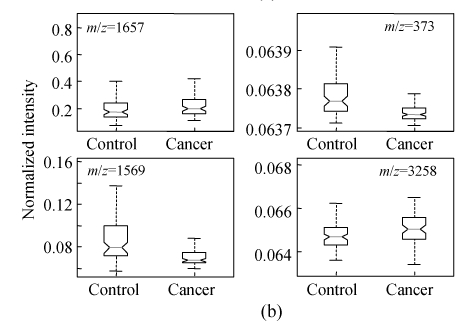
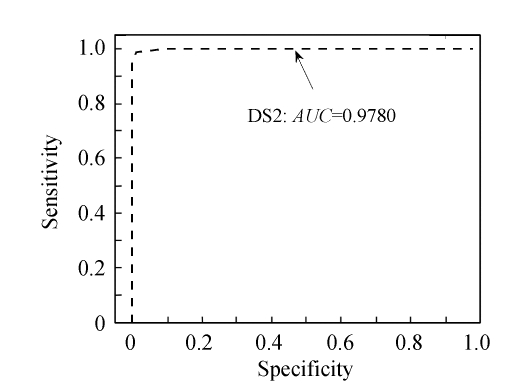
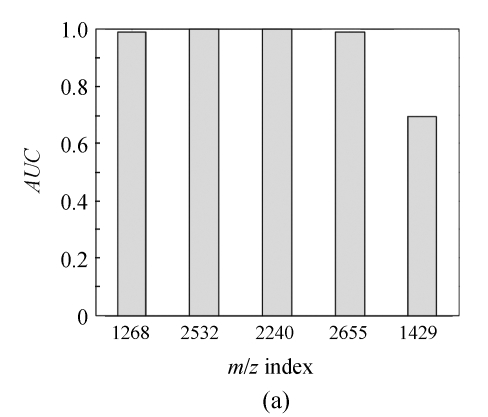
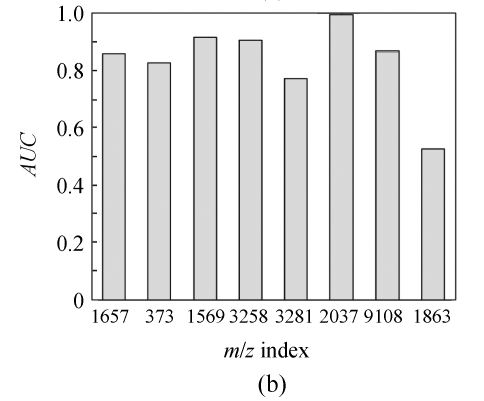
In order to show the intensity differences between normal and cancer cases quantitatively, box-plots of four high-ranked selected peptides were used as shown in Fig.4. As shown, some markers have the lower height in cancer patients than normal cases and vise versa. The receiver operating characteristics (ROC) curve and the area under curve (AUC) were used to estimate the performance of each selected biomarker. By varying the decision threshold of the SVM classifier, we computed the ROC curve and AUC for biomarkers as listed in Table 4. Fig.5 shows the ROC curves of the selected peptides by SVM for DS2 (the AUC value is 0.9780). The AUC value is 1 for DS1 and therefore the ROC curve has not been shown. The AUC values for biomarkers listed in Table 4 have been plotted in Fig.6.
Fig. 4.
Box-plot of the four significant selected peptides for ovarian (a) and breast (b) cancers
Fig. 5.
The ROC curve of SVM detection on DS2 (AUC=1 for DS1 and therefore the ROC curve is not shown)
Fig. 6.
The area under curve (AUC) of identified biomarkers listed in Table 4 for (a) DS1 and (b) DS2
DISCUSSION
Emerging advances in MS technology allow the simultaneous analysis of expression patterns for thousands of proteins in the biological specimen. In the analysis of proteomic profiles, we were faced with the high dimensionality of data and highly correlation between intensity values of mass spectrum. In addition, the appropriate processing of data could play an important role in reproducibility of results (Baggerly et al., 2004).
As it was mentioned, the DWT is an effective tool for dimensionality reduction and noise removal in the analysis of microarray and proteomic data (Vannucci et al., 2005; Subramani et al., 2006). The wavelets are very popular in signal processing because they are able to analyze both local and global behavior of functions. In the field of MS, the wavelet analysis could provide denoised and compressed representation of mass spectra that make the feature extraction process more efficient and accurate due to their favorable properties such as de-correlated coefficients, and a wide variety of orthogonal basis-function possibilities.
In this paper, we developed a data-mining approach based on the DSWT. Due to the translation invariant property of DSWT, it shows better performance in the processing of data including the feature selection step. In our method, a voting procedure was used to reduce the dimensionality of data. The advantage of this thresholding was to keep the most significant coefficients yet achieving the dimensionality reduction. A distance measure was applied to select the survived relevant features from the thresholding stage. By IDSWT and t-test, the candidate proteins were detected from the mass spectra. The potential biomarkers were then identified by the R-SVM.
To evaluate the performance of our proposed method, two independent SELDI-TOF MS datasets were analyzed to select the candidate proteins. In dataset DS1, the m/z values of five identified biomarkers were 139.38, 557.06, 435.85, 612.56, and 177.11 Da. By 10-fold cross-validation, the perfect discrimination was obtained in ovarian cancer dataset. For dataset DS2 and the m/z indices listed in Table 4, the accuracy of 98.26%, sensitivity of 100%, and specificity of 95.6% were achieved in breast cancer dataset.
It is worth mentioning that our approach can identified the five peptides in the range of below 700 Da for ovarian cancer and this is fairly in agreement with previously reported biomarkers for the same data (Alexe et al., 2004; Vannucci et al., 2005; Whelehan et al., 2006). Also, our results have shown that the detected biomarkers were independent of the classifier used in the selection step. This is an application where the data-mining techniques can be used to identify the potential biomarkers.
In conclusion, our algorithm can be used to analyze the high-throughput proteomic data for the selection of potential biomarkers with high discrimination power such as SELDI-TOF MS profiles. Our proposed method is able to identify a small subset of proteins as biomarkers in the training set that could distinguish samples in a blind test set with minimal classification error.
References
- 1.Adam BL, Qu Y, Davis JW, Ward MD, Clements MA, Cazares LH, Semmes OJ, Schellhammer PF, Yasui Y, Feng Z, et al. Serum protein fingerprinting coupled with a pattern-matching algorithm distinguishes prostate cancer from benign prostate hyperplasia and healthy men. Cancer Research. 2002;62:3609–3614. [PubMed] [Google Scholar]
- 2.Alaoui-Jamali MA, Xu YJ. Proteomic technology for biomarker profiling in cancer: an update. Journal of Zhejiang University SCIENCE B. 2006;7(6):411–420. doi: 10.1631/jzus.2006.B0411. [DOI] [PMC free article] [PubMed] [Google Scholar]
- 3.Alexe G, Alexe S, Liotta LA, Petricoin EF, Reiss M, Hammer PL. Ovarian cancer detection by logical analysis of proteomic data. Proteomics. 2004;4(3):766–783. doi: 10.1002/pmic.200300574. [DOI] [PubMed] [Google Scholar]
- 4.Baggerly KA, Morris JS, Coombes KR. Reproducibility of SELDI-TOF protein patterns in serum: comparing datasets from different experiments. Bioinformatics. 2004;20(5):777–785. doi: 10.1093/bioinformatics/btg484. [DOI] [PubMed] [Google Scholar]
- 5.Bhanot G, Alexe G, Venkataraghavan B, Levine AJ. A robust meta-classification strategy for cancer detection from MS data. Proteomics. 2006;6(2):592–604. doi: 10.1002/pmic.200500192. [DOI] [PubMed] [Google Scholar]
- 6.Chen S, Hong D, Shyr Y. Wavelet-based procedures for proteomic mass spectrometry data processing. Computational Statistics & Data Analysis. 2007;52(1):211–220. doi: 10.1016/j.csda.2007.02.022. [DOI] [Google Scholar]
- 7.Coombes KR, Koomen J, Baggerly KA, Morris JS, Kobayashi R. Improved peak detection and quantification of mass spectrometry data acquired from SELDI by denoising spectra with the undecimated discrete wavelet transform. Proteomics. 2005;5(16):4107–4117. doi: 10.1002/pmic.200401261. [DOI] [PubMed] [Google Scholar]
- 8.Donoho DL. De-noising by soft-thresholding. IEEE Transaction on Information Theory. 1995;41(3):613–627. doi: 10.1109/18.382009. [DOI] [Google Scholar]
- 9.Donoho D, Johnstone L. Minimax estimation via wavelet shrinkage. Annals of Statistics. 1998;26(3):879–921. doi: 10.1214/aos/1024691081. [DOI] [Google Scholar]
- 10.Hilario M, Kalousis A. Approaches to dimensionality reduction in proteomic biomarker studies. Briefings in Bioinformatics. 2008;9(2):102–118. doi: 10.1093/bib/bbn005. [DOI] [PubMed] [Google Scholar]
- 11.Hilario M, Kalousis A, Pellegrini C, Muller M. Processing and classification of protein mass spectra. Mass Spectrometry Reviews. 2006;25(3):409–449. doi: 10.1002/mas.20072. [DOI] [PubMed] [Google Scholar]
- 12.Hu Y, Zhang S, Yu J, Liu J, Zheng S. SELDI-TOF-MS: the proteomics and bioinformatics approaches in the diagnosis of breast cancer. The Breast. 2005;14(4):250–255. doi: 10.1016/j.breast.2005.01.008. [DOI] [PubMed] [Google Scholar]
- 13.Hu Y, Jiang T, Shen A, Li W, Wang X, Hu J. A background elimination method based on wavelet transform for Raman spectra. Chemometrics and Intelligent Laboratory Systems. 2007;85(1):94–101. doi: 10.1016/j.chemolab.2006.05.004. [DOI] [Google Scholar]
- 14.Jemal A, Siegel R, Ward E, Murray T, Xu J, Thun MJ. Cancer statistics. CA Cancer J Clin. 2007;57(1):43–66. doi: 10.3322/canjclin.57.1.43. [DOI] [PubMed] [Google Scholar]
- 15.Liu H, Li J, Wong L. A comparative study on feature selection and classification method using gene expression profiles and proteomic patterns. Genome Informatics. 2002;13:51–60. [PubMed] [Google Scholar]
- 16.Malyarenko DI, Cooke WE, Adam BL, Malik G, Chen H, Tracy ER, Trosset MW, Sasinowski M, Semmes OJ, Manos DM. Enhancement of sensitivity and resolution of SELDI-TOF mass spectrometric records for serum peptides using time-series analysis techniques. Clinical Chemistry. 2005;51(1):65–74. doi: 10.1373/clinchem.2004.037283. [DOI] [PMC free article] [PubMed] [Google Scholar]
- 17.Morris JS, Coombes KR, Koomen J, Baggerly KA, Kobayashi R. Feature extraction and quantification for mass spectrometry in biomedical applications using the mean spectrum. Bioinformatics. 2005;21(9):1764–1775. doi: 10.1093/bioinformatics/bti254. [DOI] [PubMed] [Google Scholar]
- 18.Nason GP, Silverman BW. Lecture Notes in Statistics: Wavelets and Statistics. Springer; 1995. The Stationary Wavelet Transforms and Statistical Applications; pp. 281–299. [Google Scholar]
- 19.Petricoin EFIII, Liotta LA. SELDI-TOF-based serum proteomic pattern diagnostics for early detection of cancer. Current Opinion in Biotechnology. 2004;15(1):24–30. doi: 10.1016/j.copbio.2004.01.005. [DOI] [PubMed] [Google Scholar]
- 20.Petricoin EFIII, Ardekani AM, Hitt BA, Levine PJ, Fusaro VA, Steinberg SM, Mills GB, Simone C, Fishman DA, Kohn EC, et al. Use of proteomic patterns in serum to identify ovarian cancer. The Lancet. 2002;359(9306):572–577. doi: 10.1016/S0140-6736(02)07746-2. [DOI] [PubMed] [Google Scholar]
- 21.Qu Y, Adam BL, Thornquist M, Potter JD, Thompson ML, Yasui Y, Davis JW, Cazares LH, Schellhammer PF, Clements MA, et al. Data reduction using a discrete wavelet transform in discriminant analysis of very high dimensionality data. Biometrics. 2003;59(1):143–151. doi: 10.1111/1541-0420.00017. [DOI] [PubMed] [Google Scholar]
- 22.Ressom HW, Varghese RS, Abdel-Hamid M, Eissa SAL, Saha D, Goldman L, Petricoin EF, Conrads TP, Veenstra TD, Loffredo CA, et al. Analysis of mass spectral serum profiles for biomarker selection. Bioinformatics. 2005;21(21):4039–4045. doi: 10.1093/bioinformatics/bti670. [DOI] [PubMed] [Google Scholar]
- 23.Ruckstuhl AF, Jacobson MP, Field RW, Dodd JA. Baseline subtraction using robust local regression estimation. Journal of Quantitative Spectroscopy and Radiative Transfer. 2001;68(2):179–193. doi: 10.1016/S0022-4073(00)00021-2. [DOI] [Google Scholar]
- 24.Shin H, Sheu B, Joseph M, Markey MK. A guilt-by-association feature selection: identifying biomarkers from proteomic profiles. Journal of Biomedical Informatics. 2008;41(1):124–136. doi: 10.1016/j.jbi.2007.04.003. [DOI] [PubMed] [Google Scholar]
- 25.Subramani P, Sahu R, Verma S. Feature selection using Haar wavelet power spectrum. BMC Bioinformatics. 2006;7(1):432. doi: 10.1186/1471-2105-7-432. [DOI] [PMC free article] [PubMed] [Google Scholar]
- 26.Theodoridis S, Koutroumbas K. Pattern Recognition. 2nd Ed. Academic Press; 2003. pp. 174–183. [Google Scholar]
- 27.Thomas A, Tourassi GD, Elmaghraby AS, Valdes R, Jortani SA. Data mining in proteomic mass spectrometry. Clinical Proteomics. 2006;2(1-2):13–32. doi: 10.1385/CP:2:1:13. [DOI] [Google Scholar]
- 28.Vannucci M, Sha N, Brown PJ. NIR and mass spectra classification: baysian methods for wavelet-based feature selection. Chemometrics and Intelligent Laboratory Systems. 2005;77(1-2):139–148. doi: 10.1016/j.chemolab.2004.10.009. [DOI] [Google Scholar]
- 29.Whelehan OP, Earll ME, Johansson E, Toft M, Eriksson L. Detection of ovarian cancer using chemometric analysis of proteomic profiles. Chemometrics and Intelligent Laboratory Systems. 2006;84(1-2):82–87. doi: 10.1016/j.chemolab.2006.03.008. [DOI] [Google Scholar]
- 30.Xu WH, Chen YD, Hu Y, Yu JK, Wu XG, Jiang TJ, Zheng S, Zhang SZ. Preoperatively molecular staging with CM10 ProteinChip and SELDI-TOF-MS for colorectal cancer patients. Journal of Zhejiang University SCIENCE B. 2006;7(3):235–240. doi: 10.1631/jzus.2006.B0235. [DOI] [PMC free article] [PubMed] [Google Scholar]
- 31.Yu JS, Ongarello S, Fiedler R, Chen XW, Toffolo G, Cobelli C, Trajanoski Z. Ovarian cancer identification based on dimensionality reduction for high-throughput mass spectrometry data. Bioinformatics. 2005;21(10):2200–2209. doi: 10.1093/bioinformatics/bti370. [DOI] [PubMed] [Google Scholar]
- 32.Zhang X, Lu X, Shi Q, Xu XQ, Leung HC, Harris LN, Iglehart JD, Miron A, Liu JS, Wong WH. Recursive SVM feature selection and sample classification for mass-spectrometry and microarray data. BMC Bioinformatics. 2006;7(1):197. doi: 10.1186/1471-2105-7-197. [DOI] [PMC free article] [PubMed] [Google Scholar]
- 33.Zhu LR, Zhang WY, Yu L, Zheng YH, Hu J, Liao QP. Proteomic patterns for endometerial cancer using SELDITOF-MS. Journal of Zhejiang University SCIENCE B. 2008;9(4):286–290. doi: 10.1631/jzus.B0710589. [DOI] [PMC free article] [PubMed] [Google Scholar]
- 34.Zinkin NT, Grall F, Bhaskar K, Out H, Spentzos D, Kalmowitz B, Wells M, Guerrero M, Asara JM, Libermann TA, et al. Serum proteomics and biomarkers in hepatocellular carcinoma and chronic liver disease. Clinical Cancer Research. 2008;14(2):470–477. doi: 10.1158/1078-0432.CCR-07-0586. [DOI] [PubMed] [Google Scholar]


