Abstract
Two-photon excitation microscopy was used to image and quantify NAD(P)H autofluorescence from intact pancreatic islets under glucose stimulation. At maximal glucose stimulation, the rise in whole-cell NAD(P)H levels was estimated to be ≈30 μM. However, because glucose-stimulated insulin secretion involves both glycolytic and Kreb's cycle metabolism, islets were cultured on extracellular matrix that promotes cell spreading and allows spatial resolution of the NAD(P)H signals from the cytoplasm and mitochondria. The metabolic responses in these two compartments are shown to be differentially stimulated by various nutrient applications. The glucose-stimulated increase of NAD(P)H fluorescence within the cytoplasmic domain is estimated to be ≈7 μM. Likewise, the NAD(P)H increase of the mitochondrial domain is ≈60 μM and is delayed with respect to the change in cytoplasmic NAD(P)H by ≈20 sec. The large mitochondrial change in glucose-stimulated NAD(P)H thus dominates the total signal but may depend on the smaller but more rapid cytoplasmic increase.
Glucose-induced insulin secretion is coupled to the metabolic state of the β cell. After transport into the cell, glucose is phosphorylated and shunted into glycolysis, which increases metabolic flux. This altered metabolic state, which can be monitored by NAD(P)H autofluorescence increase, leads to an increase in the ATP/ADP ratio that closes the plasma membrane-associated ATP-sensitive potassium (KATP) channel. Closure of this channel depolarizes the membrane, leading to the activation of voltage-sensitive calcium (Ca2+) channels, Ca2+ influx, and insulin secretion (1).
Glucose usage in stimulated pancreatic β cells is principally glycolytic, with the polyol pathway, glycogen synthesis, and pentose phosphate pathway accounting for <10% of total usage (2). Thus, the glucose metabolic signal is derived from glycolysis in the cytoplasm and pyruvate metabolism in the mitochondria. The absence of stimulated insulin secretion with nonmetabolizable glucose derivatives (1) and the abolition of glucose-stimulated insulin secretion in a pancreatic β cell line lacking mitochondrial DNA (3) suggest roles for both cytoplasmic and mitochondrial metabolism in normal secretion. Additionally, both glycolytic intermediates, such as glyceraldehyde 3-phosphate and dihydroxyacetone phosphate (2), and mitochondrial substrates, such as leucine (4) or methyl pyruvate (5), stimulate insulin secretion, which further supports a role for metabolism in both compartments in glucose signaling.
Attempts to resolve the glycolytic and mitochondrial contributions to glucose-stimulated insulin secretion have relied on nutrient secretagogues that couple at various points into glycolysis or Kreb's cycle or on pharmacological inhibition at various points along each pathway (1, 6). Although various nutrient supplements indicate that couplings of the pathway can lead to insulin secretion, they seldom mimic the effects of glucose. For example, pyruvate potentiates glucose-stimulated secretion but does not cause secretion in the absence of glucose, even though it is metabolized in both cases (1, 2). Pharmacological studies provide another approach to separate the glucose-stimulated contributions of glycolysis and Kreb's cycle, but their results must be interpreted with caution because of likely nonspecific inhibitor actions. Such experiments have indicated that the glycerol phosphate shuttle plays an important role in glucose-stimulated KATP channel closure (6). Yet, islets from genetically altered mice, where this shuttle was disrupted, displayed only a small decrease in insulin secretion. When these islets were further treated with aminooxyacetate, which can inhibit the malate–aspartate shuttle, insulin release was strongly inhibited. Despite any experimental weaknesses, these results do provide solid evidence that glycolytic NADH shuttles into the mitochondria are important in normal glucose-stimulated insulin secretion (7). This evidence leads to a model where glycolytic NADH coupling into the electron transport system through the shuttles increases the mitochondrial membrane potential. This, in turn, promotes Ca2+ influx into the mitochondria, which activates Ca2+-dependent dehydrogenases and stimulates pyruvate metabolism in the Kreb's cycle.
Because direct measurements of the glycolytic vs. mitochondrial redox state changes have not been made, we still have little knowledge of their relative contributions to glucose signaling. By using two-photon excitation microscopy to image noninvasively islets of Langerhans (8), the fluorescence from a purified NADH standard curve was compared with subcellular NAD(P)H fluorescence to determine quantitatively the source and number of NAD(P)H molecules involved in glucose metabolic signaling in pancreatic β cells. Isolated islets cultured on extracellular matrix provided β cells that were sufficiently spread out to allow spatial separation of mitochondrial and cytoplasmic regions by fluorescence microscopy. The advantage of this approach is that it is a direct measurement of the change in redox state in each compartment and can yield both steady-state and time-resolved NAD(P)H profiles. Further, the quantitation of NAD(P)H molecules, although still limited by experimental issues, can be used to refine the computer models of glucose-stimulated insulin secretion dynamics.
Methods
Spectroscopy.
NADH and NADPH (Sigma) were diluted to 100 nM in PBS, pH 7.3. The fluorescence excitation and emission spectra were collected on a Fluorolog 1681 spectrofluorometer with a 250-W xenon arc lamp (Spex Industries, Edison, NJ). Absorbance spectra were obtained on 1 μM NADH and NADPH samples in PBS on a Hewlett–Packard 8453 UV-Visible Spectrophotometer.
Islet Isolation and Culture.
Islets were isolated from 6- to 12-week-old B6D2 female mice by collagenase (Boehringer–Mannheim) digestion (9, 10). They were cultured on epithelial cell matrix (Becton Dickinson) in the presence of RPMI 1640 media (Life Technologies, Rockville, MD) supplemented with 11 mM glucose at 37°C and 5% CO2 for ≈14 days before being used in experiments. Because the extracellular matrix promotes cell spreading, islets grown on the matrix change morphology from a spherical mass of cells to a more flattened appearance over a period of ≈14 days.
Islet Perfusion.
Islets were placed in a closed chamber and perfused at 150 μl/min with these constituents in mM: 137 NaCl/5.9 KCl/2.5 CaCl2/1.2 MgCl2/10 Hepes, pH 7.4. The chamber temperature was maintained at 37°C with a temperature-controlled microscope stage (ALA Scientific Instruments, Westbury, NY), an objective heater (Nicholson Precision Instruments, Bethesda), and by prewarming the input perfusate. The perfusion flow rate was maintained with a BPS-8 bath perfusion system coupled with a PR-10 pressure controller (ALA Scientific Instruments).
Microspectrofluorometry.
The chambers were placed on a Nikon TMD microscope and illuminated through a monochromator (TILL Photonics, Planegg, Germany) and optical fiber connected to the epifluorescence input port. The islets were preincubated in the presence of 3 mM glucose on the stage for 25–30 min and were incubated for another 30 min without glucose before the actual recordings. Data were acquired in 50-ms windows at 1 Hz, with emitted light collected through a dichroic mirror (505 nm) and a 510- to 560-nm bandpass filter, and measured by a PMT unit (PTI, South Brunswick, NJ). For NAD(P)H measurements, illumination was at 366 nm. For rhodamine 123 measurements, 10 μg/ml of the dye was added during the first preincubation step, and the islets were washed thoroughly before data were acquired with illumination at 490 nm. Data sets were normalized to the basal levels of fluorescence in the prestimulatory period.
Two-Photon Excitation Microscopy and Image Analysis.
Two-photon excitation microscopy was performed by using a previously described instrument (11) with ≈150-fsec pulses of 710-nm light from a Coherent Mira laser focused through a 40X Plan Neofluar 1.3 numerical aperture objective (Zeiss). The excitation power used for imaging was ≈3 mW at the sample, which produces no observable damage to the islets (8), and <1% photobleaching over the duration of the longest experiments reported here (12). Simultaneous NAD(P)H and rhodamine 123 measurements were made on a modified LSM510 (Zeiss) by using, (i) 488-nm excitation and confocal detection through a 510- to 565-nm bandpass filter for rhodamine, and (ii) two-photon excitation of NAD(P)H with a 385- to 470-nm filter to prevent collection of the rhodamine fluorescence. For all other experiments, NAD(P)H fluorescence was collected with a 380- to 550-nm filter. The mean pixel values from regions of interest encompassing the interior of the islet were determined by quantitative image analysis by using NIH image 1.62b7 (National Institutes of Health, Bethesda). NADH standard curves were generated by using known concentrations of NADH suspended in islet perfusion buffer. The fluorescence values from the regions of interest were used in linear equations derived from these curves to determine NAD(P)H concentrations.
Results and Discussion
NAD(P)H Fluorescence Characteristics.
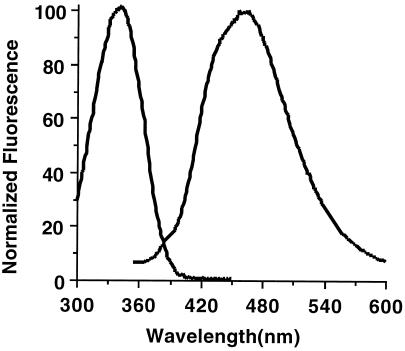
The NADH absorption and emission spectra are shown in Fig. 1. Because the spectra of NADPH exactly overlay those of NADH, only NADH is shown here. Further, the extinction coefficient (6,200 mol−1 cm−1) (13) and quantum yield (2.8%) of both fluorophores is the same, so together they are designated as NAD(P)H. The excitation spectrum shows a major peak at 340 nm, which is attributed to the reduced nicotinamide moiety and is absent in the oxidized form, NAD+. The two-photon excitation spectrum of NADH roughly approximates a wavelength range twice that of the one-photon spectrum (14). Thus, the redox state [NAD(P)H autofluorescence] of pancreatic β cells can be noninvasively monitored by two-photon excitation microscopy (11) by using 710 nm laser light. Fluorescence emission spectra have one major peak centered at 465 nm and a broad emission pattern (≈380 nm–≈560 nm), which is collected efficiently by using the 380- to 550-nm emission filter used in our microscope. Because the collected emission is broad, small shifts in the emission spectra that have been reported for NAD(P)H on enzyme binding did not significantly affect the results described below.
Figure 1.
NAD(P)H excitation and emission spectra. Purified NADH and NADPH were suspended to 1 μM concentration in 50 mM Na2HPO4/50 mM sodium acetate/50 mM glycine, pH 7.0. The excitation spectrum was obtained by exciting at wavelengths from 300 nm to 460 nm while detecting emission at 465 nm. The emission spectrum was obtained by exciting 340 nm and scanning the emission wavelength from 350 nm to 600 nm. NADPH spectra exactly overlay NADH spectra.
NAD(P)H Quantitation in Pancreatic β Cells.
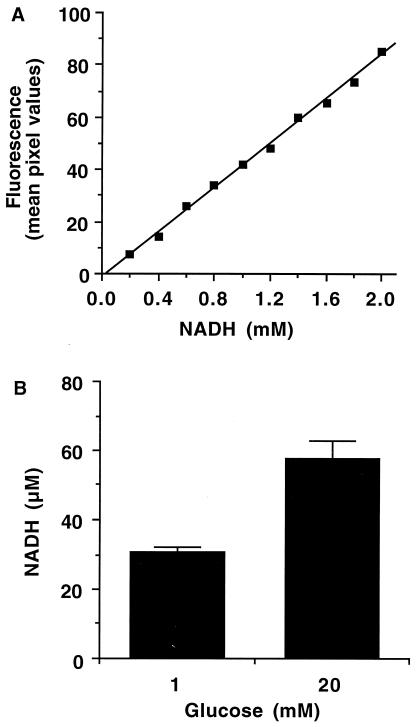
Because components other than NAD(P)H contribute to cell autofluorescence, for example, collagen, elastin, flavin adenine dinucleotide (FAD), or lipopigments (15), absolute NAD(P)H levels cannot be fluorescently determined. In fact, β cell autofluorescence falls only ≈50% when glycolysis is inhibited by mannoheptulose, indicating a fluorescent component not related to glucose metabolism (8). However, the other major metabolically regulated autofluorescent component, FAD, does not contribute measurably to fluorescence generated by two-photon excitation at <780 nm (16, 17). Thus, the glucose-stimulated autofluorescence changes can be attributed to NAD(P)H in these experiments performed at 710 nm. To quantify the stimulated NAD(P)H increases, we used known concentrations of NADH in deep-well slides to produce a standard curve for the microscope such as the one shown in Fig. 2A. Because all experiments are performed by using exactly the same optical setup and input laser profile, the quantitation is consistent over all experiments, although it was rechecked occasionally to ensure its accuracy. Flattened islets were equilibrated with 30 min of 1 mM glucose perfusion before acquiring an autofluorescence image. The islets were then perfused with 20 mM glucose for 10 min and imaged again. Under 20 mM glucose stimulation (Fig. 2B), the whole-cell NAD(P)H level increased ≈2-fold or ≈0.3 mM, based on the standard curve in Fig. 2A. However, the fluorescence of NAD(P)H increases 8- to 12-fold when it is bound as a coenzyme (13, 18–20). From estimates in yeast cells, hepatocytes, and isolated mitochondria, it is accepted that most of the NAD(P)H of normal cells is bound in vivo (18, 19, 21–23), which would lead to a ≈10-fold overestimation of the NAD(P)H level. Thus, the unbound NADH standard curve does not rigorously apply here, but it can be used to determine an absolute upper limit for NAD(P)H changes. Assuming all of the NAD(P)H is unbound, the glucose-stimulated change in whole-cell NAD(P)H level would be ≈300 μM. Based on values from the literature, however, the fluorescent enhancement of bound NAD(P)H in vivo leads to the estimation that the actual glucose-stimulated NAD(P)H change is ≈30 μM or ≈100 fmol/islet. Assuming ≈5,000 β cells/islet, this implies an increase of ≈107 NAD(P)H molecules per cell. This estimation is reasonable and consistent with biochemical measurements of NAD(P)H from homogenized tissues (24). Potential quantitation problems caused by light scattering in the islets are minimal because of the use of two-photon excitation (25, 26).
Figure 2.
NAD(P)H quantitation in pancreatic β cells. (A) Increasing concentrations of purified NADH in deep-well slides were used to produce a standard fluorescence curve. (B) The whole-cell fluorescence signal of NAD(P)H in pancreatic islets at 1 mM and 20 mM glucose was determined in terms of NADH fluorescence from the linear equations of NADH standard curves as shown in A. Data are represented by the mean ± standard error (n = eight islets).
Spatial Separation of the NAD(P)H Response in Pancreatic β Cells.
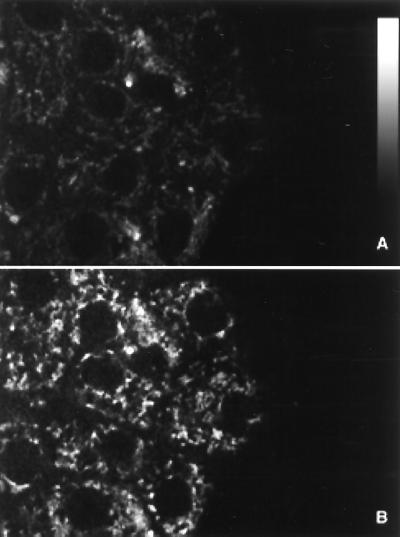
To resolve spatially the mitochondrial and cytoplasmic signals, pancreatic islets were cultured on human extracellular matrix to promote spatial spreading of the islet mass. These islets do not become a monolayer, so the optical sectioning ability of two-photon excitation is still required to perform the measurements. However, a key feature of this spreading is to flatten the cells of the islet and thus spread the intracellular components into distinguishable regions. Previous studies of flattened islets found normal responses in NAD(P)H fluorescence, intracellular Ca2+, and insulin secretion (27). By focusing 5 μm into the attachment layer of cells, both cytoplasmic and mitochondrial changes in NAD(P)H fluorescence could be imaged. A representative flattened islet is shown in Fig. 3, under perfusion with 1 mM glucose (Fig. 3A) and 20 mM glucose (Fig. 3B). The nuclei can be distinguished as large circular regions with little autofluorescence. The pattern of bright punctate regions of autofluorescence directly overlay the pattern of fluorescence observed with the mitochondrial stain, rhodamine 123 (data not shown). Thus, these regions are taken to be mitochondria, and the neighboring nonnuclear regions are considered bulk cytoplasm. As was the case in Fig. 2B, the increase in whole-cell NAD(P)H fluorescence was found to be ≈2-fold by quantitative image analysis.
Figure 3.
Subcellular imaging of NAD(P)H autofluorescence. Flattened pancreatic islets were imaged at a magnification level of 100 pixels/μm2 with a two-photon excitation microscope in the presence of (A) 1 mM or (B) 20 mM glucose.
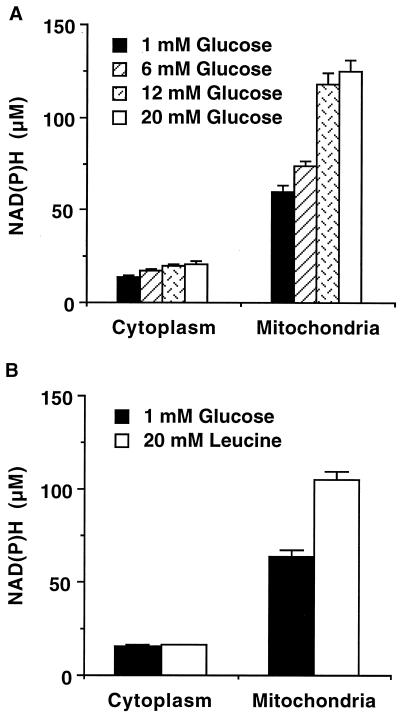
The NAD(P)H autofluorescence in each cellular compartment was determined by analyzing the intensity in the bright punctate mitochondrial regions and in the dimmer cytoplasmic areas of the flattened islets. Because of their movement in and out of the focal plane, the same mitochondria could not be imaged at all glucose levels. Rather, 10–50 mitochondrial and cytoplasmic regions of ≈50 pixels each were chosen at random in each flattened islet to give an average fluorescence intensity for those compartments. Analysis of the flattened islets revealed glucose-stimulated increases in the two subcellular compartments, resulting in a maximum mitochondrial change in NAD(P)H of ≈60 μM (assuming the NAD(P)H is bound), whereas the cytoplasmic change was estimated to be only ≈7 μM under 20 mM glucose stimulation (Fig. 4A, displayed as normalized fluorescence). Leucine, which couples directly into Kreb's cycle metabolism within the mitochondria, generates an NAD(P)H increase of ≈40 μM. However, little change (<5%) in the cytoplasmic NAD(P)H signal was observed under leucine stimulation (Fig. 4B). This result verifies that image analysis of cytoplasmic regions contains very little mitochondrial fluorescence. Still, some cytoplasmic signal contamination of the regions designated as mitochondrial cannot be ruled out and is actually expected, because single mitochondria are about the size of the optical resolution. However, any such contamination would have a small effect on the results, because mitochondrial NAD(P)H levels are considerably larger than those in the cytoplasm.
Figure 4.
Spatial separation of the NAD(P)H response. Flattened pancreatic islets were imaged at 100 pixels/μm2 in the presence of glucose (A) or leucine (B). The NAD(P)H fluorescence signals were quantified from an NADH standard curve. (A) The fluorescence signals for the cytoplasm and the mitochondria were determined in the presence of increasing levels of glucose. Data are represented by the mean ± standard error (n = 90 to 150 regions of interest from 3–9 islets) (B) The fluorescence signals for the cytoplasm and the mitochondria were determined in the presence of 1 mM glucose and 20 mM leucine. Data are represented by the mean ± standard error (n = 50 regions of interest from 5 islets).
The glucose-stimulated NAD(P)H increase in the β cell is dominated by the mitochondrial signal, which is ≈4-fold that of the cytoplasmic signal even at low glucose. This result is consistent with the assumptions of previous NAD(P)H fluorescence studies (28). However, a significant increase in cytoplasmic NAD(P)H, attributed to a change in glycolytic redox state, was specifically measured here. The normalized fluorescence signals track well with each other at the lower glucose levels (6 mM in Fig. 4A) but diverge at the intermediate and high glucose levels (12 mM and 20 mM in Fig. 4A). The comparatively different responses over the range of glucose concentrations imply a second rate-limiting step involved in the mitochondrial activation that becomes apparent at intermediate glucose concentrations. This result suggests that, although Kreb's cycle metabolism probably contributes more to the glucose-signaling pathway, glycolytic production of reducing equivalents has an important role in glucose-stimulated insulin secretion.
Temporal Separation of the NAD(P)H Response.
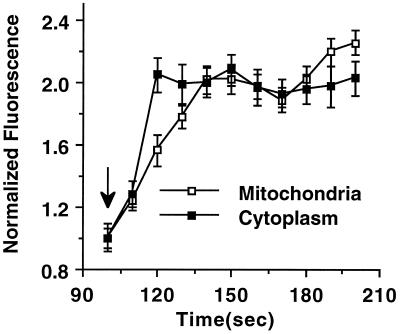
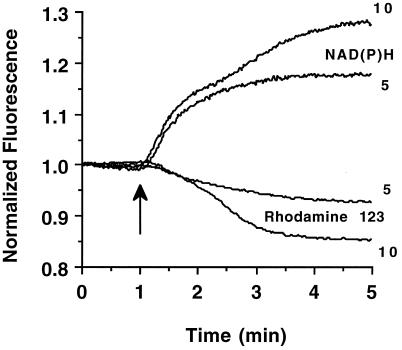
The time courses of NAD(P)H fluorescence increases were also measured in both mitochondrial and cytoplasmic regions in response to 20 mM glucose. As described above, 10 mitochondrial and 10 cytoplasmic regions were chosen at random in the flattened islets to give an average fluorescence intensity for those compartments and are depicted in Fig. 5. The cytoplasmic NAD(P)H signal increases to maximum ≈20 sec after the glucose is increased to 20 mM, whereas the mitochondrial signal is noticeably delayed and reaches its maximum only after ≈40 sec. Whole-islet NAD(P)H and rhodamine 123 fluorescence traces in response to glucose confirm this delay (Fig. 6). Addition of either 5 or 10 mM glucose results in a rapid NAD(P)H increase, whereas the mitochondrial membrane potential, monitored by rhodamine 123 fluorescence, begins to drop only 15–30 sec later. This result agrees well with the time delay seen in Fig. 5 and confirms the presence of distinct glucose-stimulated metabolic activations in our spatial resolution. However, another feature is seen also after addition of 10 mM glucose: there is a secondary increase in NAD(P)H autofluorescence that is accompanied by a large change in rhodamine 123 fluorescence. This secondary amplification is comparable to the data from the 6-mM and 12-mM glucose dose responses (Fig. 4A) and implies a separate rate-determining step in mitochondrial activation. The time delay and variable glucose response of the different metabolic activation regions can be used to test several proposed metabolic models of glucose-stimulated insulin secretion.
Figure 5.
Temporal separation of the NAD(P)H response. The mitochondrial and cytoplasmic NAD(P)H signals were measured in flattened pancreatic islets at 10-sec intervals for 100 sec at 1 mM glucose before the addition of a bolus of 20 mM glucose (denoted by the arrow). The islets were monitored for an additional 500 sec. Only the 100- to 200-sec time segment is shown here. Data are represented by the mean ± standard error (n = 40 regions of interest from 4 islets).
Figure 6.
Temporal NAD(P)H and rhodamine 123 fluorescence responses. The average fluorescence of NAD(P)H and rhodamine 123 fluorescence was monitored after addition of 5 and 10 mM glucose (glucose addition denoted by the arrow). The traces were first normalized individually to the average value of the three earliest time points in each recording. The traces are the mean values of seven experiments for NAD(P)H recordings and four experiments for rhodamine 123 recordings.
One possible explanation of these differences arises from the model suggested in a recent study of glycolytic NADH shuttles in pancreatic β cells (7). In this model, the coupling of glycolytic NADH into the mitochondria increases the mitochondrial membrane potential, leading to Ca2+ influx and stimulation of Kreb's cycle metabolism. However, temporal analysis in Fig. 5 shows that the cytoplasmic response precedes the mitochondrial signal by only ≈20 sec and that both reach their maximal levels within ≈40 sec of stimulation. Because mitochondrial Ca2+ influx depends on the increase of cytosolic Ca2+ (29), which occur at >40 sec after stimulation (30), it is difficult to see how the mitochondrial signal measured here could be caused by Ca2+ stimulation of pyruvate metabolism.
An alternate explanation, which is consistent with results presented here and in Eto et al. (7), is that the increased mitochondrial membrane potential stimulates the uptake of pyruvate into the mitochondria. Because exogenous pyruvate stimulates insulin secretion only in the presence of glucose, some signal from glycolysis is necessary for pyruvate's potentiation effects (1). A feature of pyruvate transporters is cotransport of a proton and a dependence of the Vmax (increasing with membrane potential) on the pH gradient across the membrane (31). Thus, the initial increase in glycolytic NADH (Fig. 5) could couple into the mitochondria through the glycerol phosphate and malate/aspartate shuttles (2, 7) and increase the mitochondria membrane potential. This increase, in turn, could stimulate the rapid uptake of pyruvate, resulting in an increase in Kreb's cycle metabolism, which would be seen as a delayed increase in mitochondrial NAD(P)H signal (Fig. 5). Therefore, the temporal delay between the cytoplasmic and mitochondrial NAD(P)H signals would be explained by glycolytic priming of Kreb's cycle metabolism. This model, which is consistent with all the data presented, would also explain the long-standing pyruvate dilemma, in which glycolytic generation of NAD(P)H is required before pyruvate can be transported into the mitochondria.
Acknowledgments
This work was supported by grants from the National Institutes of Health (DK53434) and the National Science Foundation (DBI-9871063) to D.W.P. During part of this work, G.H.P. was a National Institutes of Health trainee in molecular biophysics (GM08320). Part of this work was performed by using resources of the Cell Imaging Shared Resource supported by the Vanderbilt–Ingram Cancer Center (CA68485) and Diabetes Research and Training Center (DK20593).
Footnotes
Article published online before print: Proc. Natl. Acad. Sci. USA, 10.1073/pnas.090098797.
Article and publication date are at www.pnas.org/cgi/doi/10.1073/pnas.090098797
References
- 1.Newgard C B, McGarry J D. Annu Rev Biochem. 1995;64:689–719. doi: 10.1146/annurev.bi.64.070195.003353. [DOI] [PubMed] [Google Scholar]
- 2.Meglasson M D, Matschinsky F M. Diabetes Metab Rev. 1986;2:163–214. doi: 10.1002/dmr.5610020301. [DOI] [PubMed] [Google Scholar]
- 3.Soejima A, Inoue K, Takai D, Kaneko M, Ishihara H, Oka Y, Hayashi J-I. J Biol Chem. 1996;271:26194–26199. doi: 10.1074/jbc.271.42.26194. [DOI] [PubMed] [Google Scholar]
- 4.Malaisse W J, Hutton J C, Carpinelli A R, Herchuelz A, Sener A. Diabetes. 1980;29:431–437. doi: 10.2337/diab.29.6.431. [DOI] [PubMed] [Google Scholar]
- 5.Zawalich W S, Zawalich K C. J Biol Chem. 1997;272:3527–3531. doi: 10.1074/jbc.272.6.3527. [DOI] [PubMed] [Google Scholar]
- 6.Dukes I D, McIntyre M S, Mertz R J, Philipson L H, Roe M W, Spencer B, Worley J F., III J Biol Chem. 1994;269:10979–10982. [PubMed] [Google Scholar]
- 7.Eto K, Tsubamoto Y, Terauchi Y, Sugiyama T, Kishimoto T, Takahashi N, Yamauchi N, Kubota N, Murayama S, Aizawa T, et al. Science. 1999;283:981–985. doi: 10.1126/science.283.5404.981. [DOI] [PubMed] [Google Scholar]
- 8.Bennett B D, Jetton T L, Ying G, Magnuson M A, Piston D W. J Biol Chem. 1996;271:3647–3651. doi: 10.1074/jbc.271.7.3647. [DOI] [PubMed] [Google Scholar]
- 9.Sharp D W, Kemp C B, Knight M J, Ballinger W F, Lacy P F. Transplantation. 1973;16:686–689. doi: 10.1097/00007890-197312000-00028. [DOI] [PubMed] [Google Scholar]
- 10.Stefan Y, Meda P, Neufeld M, Orci L. J Clin Invest. 1987;80:175–183. doi: 10.1172/JCI113045. [DOI] [PMC free article] [PubMed] [Google Scholar]
- 11.Piston D W, Knobel S M. Methods Enzymol. 1999;307:351–368. doi: 10.1016/s0076-6879(99)07023-8. [DOI] [PubMed] [Google Scholar]
- 12.Patterson G H, Piston D W. Biophys J. 2000;78:2159–2162. doi: 10.1016/S0006-3495(00)76762-2. [DOI] [PMC free article] [PubMed] [Google Scholar]
- 13.Kierdaszuk B, Malak H, Gryczynski I, Callis P, Lakowicz J R. Biophys Chem. 1996;62:1–13. doi: 10.1016/s0301-4622(96)02182-5. [DOI] [PubMed] [Google Scholar]
- 14.Xu C, Williams R M, Zipfel W, Webb W W. Bioimaging. 1996;4:198–207. [Google Scholar]
- 15.Wagnières G A, Star W M, Wilson B C. Photochem Photobiol. 1998;68:603–632. [PubMed] [Google Scholar]
- 16.Masters B R, So P T, Kim K H, Buehler C, Gratton E. Methods Enzymol. 1999;307:513–536. doi: 10.1016/s0076-6879(99)07031-7. [DOI] [PubMed] [Google Scholar]
- 17.Huang S, Heikal A A, Webb W W. Biophys J. 2000;78:443A. [Google Scholar]
- 18.Avi-Dor Y, Olson J M, Doherty M D, Kaplan N O. J Biol Chem. 1962;237:2377–2383. [Google Scholar]
- 19.Estabrook R W. Anal Biochem. 1962;4:231–245. doi: 10.1016/0003-2697(62)90006-4. [DOI] [PubMed] [Google Scholar]
- 20.Gafni A, Brand L. Biochemistry. 1976;15:3165–3171. doi: 10.1021/bi00660a001. [DOI] [PubMed] [Google Scholar]
- 21.Chance B, Baltscheffsky H. J Biol Chem. 1958;233:736–739. [PubMed] [Google Scholar]
- 22.Galeotti T, Van Rossum G D V, Mayer D H, Chance B. Eur J Biochem. 1970;17:485–496. doi: 10.1111/j.1432-1033.1970.tb01191.x. [DOI] [PubMed] [Google Scholar]
- 23.Wakita M, Nishimura G, Tamura M. J Biochem. 1995;118:1151–1160. doi: 10.1093/oxfordjournals.jbchem.a125001. [DOI] [PubMed] [Google Scholar]
- 24.Malaisse W J, Hutton J C, Kawazu S, Herchuelz A, Valverde I, Sener A. Diabetologia. 1979;16:331–341. doi: 10.1007/BF01223623. [DOI] [PubMed] [Google Scholar]
- 25.Denk W, Svoboda K. Neuron. 1997;18:351–357. doi: 10.1016/s0896-6273(00)81237-4. [DOI] [PubMed] [Google Scholar]
- 26.Centonze V E, White J G. Biophys J. 1998;75:2015–2024. doi: 10.1016/S0006-3495(98)77643-X. [DOI] [PMC free article] [PubMed] [Google Scholar]
- 27.Arkhammar P O G, Terry B R, Kofod H, Thastrup O. Methods Cell Sci. 1998;18:1–14. [Google Scholar]
- 28.Duchen M R, Smith P A, Ashcroft F M. Biochem J. 1993;294:35–42. doi: 10.1042/bj2940035. [DOI] [PMC free article] [PubMed] [Google Scholar]
- 29.Kennedy E D, Wollheim C B. Diabetes Metab. 1998;24:15–24. [PubMed] [Google Scholar]
- 30.Civelek V N, Deeney J T, Kubik K, Schultz V, Tornheim K, Corkey B E. Biochem J. 1996;315:1015–1019. doi: 10.1042/bj3151015. [DOI] [PMC free article] [PubMed] [Google Scholar]
- 31.Denton R M, Halestrap A P. Essays Biochem. 1979;15:37–77. [PubMed] [Google Scholar]


