

Abstract
Serotonin, like other neuromodulators, acts on a range of receptor types, but its effects also depend on the functional characteristics of the neurons responding to receptor activation. In the inferior colliculus (IC), an auditory midbrain nucleus, activation of a common serotonin (5-HT) receptor type, the 5-HT1A receptor, depresses auditory-evoked responses in many neurons. Whether these effects occur differentially in different types of neurons is unknown. In the current study, the effects of iontophoretic application of the 5-HT1A agonist 8-OH-DPAT on auditory responses were compared with the characteristic frequencies (CFs), recording depths, and control first-spike latencies of the same group of IC neurons. The 8-OH-DPAT-evoked change in response significantly correlated with first-spike latency across the population, so that response depressions were more prevalent in longer-latency neurons. The 8-OH-DPAT-evoked change in response did not correlate with CF or with recording depth. 8-OH-DPAT also altered the temporal characteristics of spike trains in a subset of neurons that fired multiple spikes in response to brief stimuli. For these neurons, activation of the 5-HT1A receptor suppressed lagging spikes proportionally more than initial spikes. These results suggest that the 5-HT1A receptor, by affecting the timing of the responses of both individual neurons and the neuron population, shifts the temporal profile of evoked activity within the IC.
Keywords: Inferior colliculus, Latency, Serotonin, 5-HT1A receptor, Neuromodulation
1. Introduction
Neuromodulators typically have a diversity of effects among the neurons of a sensory neural circuit (for example, Rogawski and Aghajanian, 1980; Kossl and Vater, 1989; Ebert and Ostwald, 1992; Manunta and Edeline, 1997; Habbicht and Vater, 1996; Hurley et al., 2004). For a neuromodulator like serotonin, the effects of which are mediated by an exceptionally rich array of receptor types, understanding the roles played by these different receptors is especially significant. The responses of sensory circuits to serotonin depend not only on the nature of the receptors expressed, however, but also on the identities of targeted neurons. Even a single serotonin receptor type is capable of having a variety of effects, if the neurons that express it have different functional characteristics (Yan, 2002; Xiang and Prince, 2003; Huang et al., 1993; Mooney et al., 1996).
Within the inferior colliculus (IC), an auditory midbrain nucleus, serotonin alters both the magnitudes and latencies of the responses of neurons to auditory stimuli. How serotonin alters evoked responses varies among neurons, and activation of particular receptor types mimics different aspects of serotonergic effects (Hurley, 2006). One of the receptor types mediating the effects of serotonin is the 5-HT1A receptor, which is expressed prominently in the IC (Thompson et al., 1994; Peruzzi and Dut, 2004). In other brain regions, this metabotropic receptor is localized to soma and dendrites, and its activation leads to the hyperpolarization of neurons that express it (Hoyer et al., 1994; Vergé and Calas, 2000; Hoyer et al., 2002). Reflecting this mechanism, activation of the 5-HT1A receptor in the IC depresses the overall responsiveness of a majority of neurons to sound, decreasing evoked spike counts and increasing response latencies (Hurley, 2006). Whether these effects occur differentially in subpopulations of IC neurons is unknown.
The current study addresses this issue by testing whether the effects of 5-HT1A receptor activation correspond to three specific features of IC neurons: their characteristic frequency (CF), the depth at which they are encountered by recording electrodes, and their first-spike latency. These three characteristics are interrelated, in that with increasing distance along the dorsoventral axis, the CFs of neurons increase, the latencies decrease, and the variability in latency among neurons also decreases (Park and Pollak, 1993; Hattori and Suga, 1997). These characteristics are not entirely coincident, however, in that each is mapped along a slightly different anatomical axis in the IC. The fibrodendritic frequency band laminae of the central IC orient in the dorsomedial-to-ventrolateral direction when viewed in transverse section, with the lowest-frequency neurons in the most dorsolateral laminae (Schreiner and Langner, 1997). Within these laminae, many response properties, including latency, are orthogonally mapped (Langner and Schreiner, 1988; Park and Pollak, 1993; Hattori and Suga, 1997; Schreiner and Langner, 1997; Hurley and Pollak, 2005b). Thus, the effects of the 5-HT1A receptor could correlate with one of the three characteristics of CF, depth, and latency, but not the other two. Such a one-way correlation would also be suggestive of the function of the 5-HT1A receptor, since variation along the axis of each of these three characteristics carries functional implications. For example, neurons in dorsal versus ventral IC are differentially involved in triggering aversive behaviors (Ferreira-Netto et al., 2007), neurons with different CFs respond best to complex vocalizations with different spectra (Klug et al., 2002), and neurons with different latencies may encode different temporal features of sound (O’Neill and Suga, 1982; Sullivan, 1982; Langner et al., 1987; Langner and Schreiner, 1988; Berkowitz and Suga, 1989; Dear et al., 1993; Hopfield, 1995; Langner et al., 2002).
Variation in all three of these neural characteristics has been explored in the Mexican free-tailed bat (Tadarida brasiliensis; Klug et al., 2002; Hurley and Pollak, 2005b; Hall and Hurley, 2007). This species was used in the current study for this and several additional reasons. Like other microchiropteran bats, Mexican free-tailed bats rely on their sense of hearing for echolocation and social interactions, which are mediated in part by an extensive repertoire of vocalizations (Balcombe and McCracken, 1992; French and Lollar, 1998, 2000). Reflecting this, the inferior colliculus is hypertrophied relative to that of many other groups of mammal, yet the patterns of serotonergic innervation within the IC are quite similar to those described in other species (Klepper and Herbert, 1991; Kaiser and Covey, 1997; Hurley and Thompson, 2001). Finally, most of the electrophysiological studies of the effects of serotonin in the IC have been conducted in Mexican free-tailed bats (reviewed in Hurley et al., 2002, but see Faingold et al., 1991).
Using this model species, this study demonstrates that the effect of 5-HT1A activation on evoked spike counts correlates with only one of the three measured neural characteristics, the first-spike latency. Furthermore, responsiveness to activation of this receptor distinguishes subpopulations of IC neurons with longer latencies. By showing a correlation between the effects of 5-HT1A receptor activation and latency, these results suggest a role for this receptor in regulating temporal aspects of sound-evoked activity within the IC.
2. Results
To determine whether the effect of activating the 5-HT1A receptor correlates with other neural characteristics, the action potentials of 91 single IC neurons in 11 male Mexican free-tailed bats were recorded extracellularly through single-barreled glass recording pipettes. Multibarreled drug pipettes attached in piggy-back configuration (Havey and Caspary, 1980) were used to iontophoretically apply the selective 5-HT1A agonist 8-OH-DPAT in the region of the recorded neurons. The effects of 8-OH-DPAT were measured as the change in the number of sound-evoked spikes normalized to the control. 8-OH-DPAT effects were measured from responses to FM sweeps in 87 neurons and from responses to CF tones in 4 neurons. This was not only because more neurons responded to FM sweeps (87) than to tones (71), but also because the effects of 8-OH-DPAT on spike count vary with frequency for some neurons (Hurley, 2006), making FM responses a more sensitive measurement of altered spike count across all frequencies.
The characteristic frequencies (CFs), recording depths, and first-spike latencies of the neurons were also measured. CFs were measured for most neurons as the frequency of the best tone response at the minimum intensity evoking any response. For neurons without tone responses, however, CF was estimated as the center frequency of an FM sweep eliciting the maximum response at threshold. Recording depth was measured with reference to the initial electrical contact of the recording electrode with ground as the electrode was lowered into the IC. Latency was measured as the average first-spike latency for responses to 32 stimulus presentations of tones at 20–30 dB above threshold. Latencies were measured only from CF tone responses because latencies of responses to FM sweeps vary depending on the relative position of the excitatory frequencies within the sweep or with the presence of flanking inhibition (Fuzessery and Hall, 1996; Ferragamo et al., 1998; Heil and Irvine, 1998; Heil, 1997; O’Neill and Brimijoin, 2002). Measuring latencies from tone responses also made them comparable to latencies measured in past studies. As previously described in the Mexican free-tailed bat and in other mammalian species, the CFs, recording depths, and latencies of IC neurons were correlated across the population, with CFs increasing with depth (r2=.42, p<.01), and first-spike latencies decreasing with depth (r2=.24, p<.01). This 3-way correlation reflects the laminar organization of tonotopy within the IC and the within-lamina organization of other response properties including latency (Langner and Schreiner, 1988; Park and Pollak, 1993; Hattori and Suga, 1997; Schreiner and Langner, 1997; Hurley and Pollak, 2005b).
The most common effect of iontophoresing 8-OH-DPAT was to depress evoked responses. Fig. 1A illustrates the response of a single neuron to the iontophoresis of 8-OH-DPAT as paired peri-stimulus time histograms and raster plots. This neuron responded strongly to a 10-kHz FM sweep centered at 25 kHz in the control, but fired less than half of the control number of spikes in the presence of 8-OH-DPAT. The response of the neuron rebounded during the recovery period in which 8-OH-DPAT iontophoresis was halted. Subsequent iontophoresis of the carrier solution, 200 mM NaCl, had little effect on the response relative to the control. That the depression in response evoked by 8-OH-DPAT for this neuron was common among other neurons is illustrated in Fig. 1B, the population distribution of the effects of 8-OH-DPAT expressed as the change in spike count normalized to the control spike count. Dashed gray lines represent facilitations and depressions in response of 30%, a criterion used to assess changes in response in previous studies of serotonin (Hurley and Pollak, 1999). Sample sizes are the numbers of neurons in each category relative to this criterion. Although most neurons with changes in their response showed a response depression (43% of neurons), a small group of neurons facilitated their responses (4%) in the presence of 8-OH-DPAT. These predominantly depressive effects of 8-OH-DPAT are similar to those observed previously in a study of the effects of a range of 5-HT receptor agonists using a different set of IC neurons (Hurley, 2006).
Fig. 1.
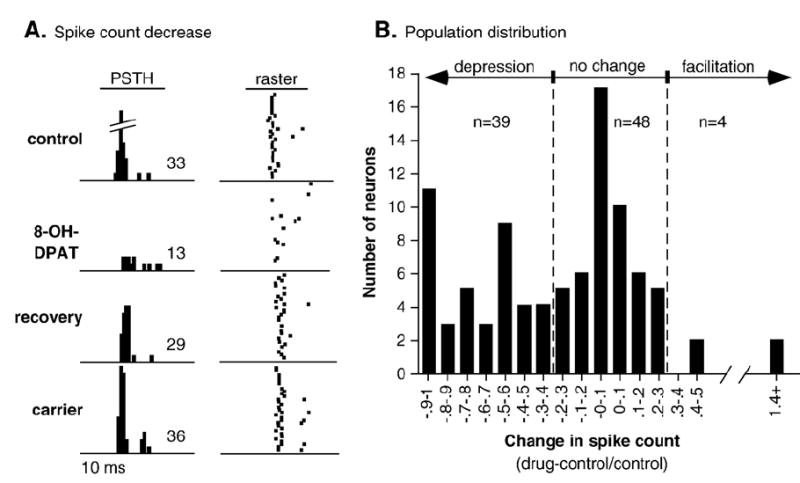
Effects of 8-OH-DPAT iontophoresis on neural responses. (A) Paired PSTHs and raster plots of the response of a single neuron to a 30-dB SPL, 10-kHz FM sweep centered at 25 kHz. Spikes are plotted in the control, in response to iontophoresis of 8-OH-DPAT, during the recovery, and in response to the carrier used to dissolve 8-OH-DPAT, 200 mM NaCl. The 10-ms stimulus is too far in advance of the spikes to plot; the average spike latency is 17.1 ms after stimulus onset for the control. Numbers in each PSTH are spike counts. 8-OH-DPAT depressed spikes, but the carrier did not. (B) Distribution of changes in response during the iontophoresis of the 5-HT1A agonist 8-OH-DPAT. Values along the x-axis are normalized changes in evoked spike count ((drug–control)/control), so that negative values indicate depressions in spike count and positive values indicate facilitations in spike count. Gray dashed lines mark 30% facilitation and depression in response, respectively; sample sizes are for neurons within categories determined by this criterion.
2.1. Change in evoked response correlates with first-spike latency
Of the three neural characteristics measured (CF, depth, and latency), only the control first-spike latency correlated with the effects of 8-OH-DPAT. To compare the effects of 8-OH-DPAT and the three characteristics, a multiple regression of the 8-OH-DPAT-evoked change in response against CF, depth, and latency was performed across the neuron population. The results of this analysis are presented in Fig. 2 as a set of three scatterplots of the 8-OH-DPAT-evoked change in spike count versus CF (Fig. 2A), depth (Fig. 2B), and latency (Fig. 2C). The multiple regression was significant overall (p=.007), but only first-spike latency correlated significantly with the change in response, such that more response depression occurred in neurons with longer latencies (p=.003 and beta=−.409 for latency, p=.77 for CF, p=.79 for depth). When the 2 outliers marked by asterisks were excluded, the partial correlation between the shift in evoked response and latency was even higher (beta=−.521 for latency). Dashed gray lines mark a 30% increase and decrease in spike counts.
Fig. 2.
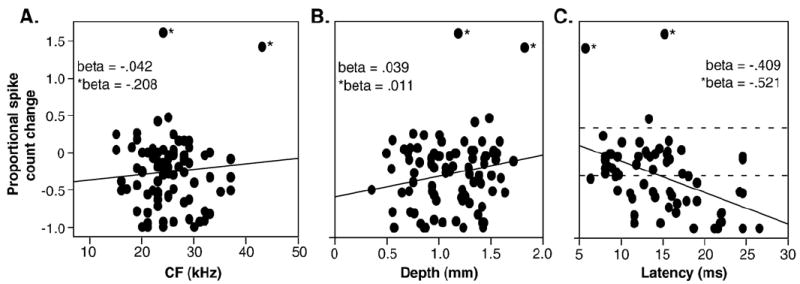
Comparison of 8-OH-DPAT-evoked changes in response with the CFs (A), recording depths (B), and control first-spike latencies (C) of all neurons. Lines represent linear fits to the data. Asterisks mark two outlier neurons. Beta values are for all neurons shown (beta) or excluding the two outliers (*beta). The only significant regression is with latency (see text). Dashed lines mark depressions and facilitations of responses by 30%, as depicted in Fig. 1.
Although changes in response correlated with first-spike latencies across the neuron population, there was a substantial degree of overlap in the latency ranges of neurons with the same level of response depression. This overlap is presented in Fig. 3, which plots the numbers of neurons with no change in response (<30 change in spike count; open bars) and with response depressions (≥30% change in spike count; filled bars) in sequential 5-ms bins as stacked histograms. This plot shows the steady change in the relative numbers of neurons with and without response depression as latencies increase. The numbers of neurons with no change in response are highest in the shortest latency category of 5–10 ms (n=15), and decline steadily in each subsequent category. In contrast, the numbers of neurons with responses that are depressed by 8-OH-DPAT are lowest in the shortest latency bin (n=3), and relatively equal in the next three latency bins. As a result of these complementary changes, the relative proportion of neurons depressed by 8-OH-DPAT gradually increases in each longer-latency bin.
Fig. 3.
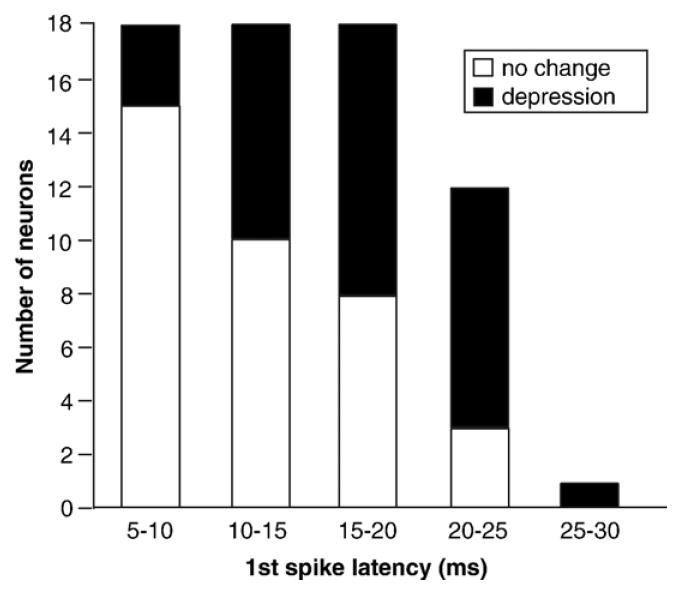
Latency distributions of neurons with no 8-OH-DPAT-evoked changes in response (open bars) versus depressions in response (filled bars). Stacked categories of no change versus depression are relative to a 30% change in response from the control.
Fig. 3 can also be viewed as the timing of population activity in the absence versus presence of 5-HT1A receptor activation. Thus, in the absence of 8-OH-DPAT, all neurons in the plot would respond to auditory stimuli, so that the latency distribution of the population would resemble the sum of both categories, with many neurons active in all latency bins except the longest ones. In the presence of 8-OH-DPAT, however, the depressed neurons would contribute less to the overall auditory response, causing the latency distribution to shift earlier and to therefore more closely resemble that of the ‘no change’ neurons alone.
2.2. 8-OH-DPAT changes the temporal structure of single-neuron responses
In addition to having more prevalent effects on neurons with longer first-spike latencies, 8-OH-DPAT also changed the time courses of the auditory responses of single neurons. The neurons that were recorded showed a variety of temporal patterns in their spike trains. Although most neurons fired single spikes in response to the relatively brief auditory stimuli presented, some neurons fired longer trains consisting of 2 or more spikes. This can be observed particularly well in the raster plots of neurons with relatively constant interspike intervals (Fig. 4A). This type of response was seen more often to FM sweeps (n=14) than to tones (n=4). For most of this specific class of neurons (n=18), 8-OH-DPAT depressed spikes in the second peak more than in the initial peak. For example, for the left-hand neuron of Fig. 4A, 8-OH-DPAT had virtually no effect on the first peak, but decreased the spikes in the second peak by about half. For the right-hand neuron of Fig. 4A, the smaller iontophoresis current also selectively depressed secondary spikes. A larger iontophoresis current slightly increased this effect, and also increased the latency of the initial spike. Of all 18 neurons with two distinct peaks in the PSTH, 8-OH-DPAT differentially (by 30% or more) affected the responses of the two peaks in 12, with 10 neurons showing larger drug-evoked changes in the second peak. Of the remaining 6 neurons in the sample, 8-OH-DPAT had no effect on either peak in 3, and affected the peaks in the same way in 3. Fig. 4B plots the relative effects of 8-OH-DPAT on the first versus second peaks of all 18 neurons, with measurements from the same neurons connected. The predominance of negative slopes in this figure emphasizes that in most neurons, the effect of 8-OH-DPAT on secondary spikes was larger than its effect on initial spikes.
Fig. 4.
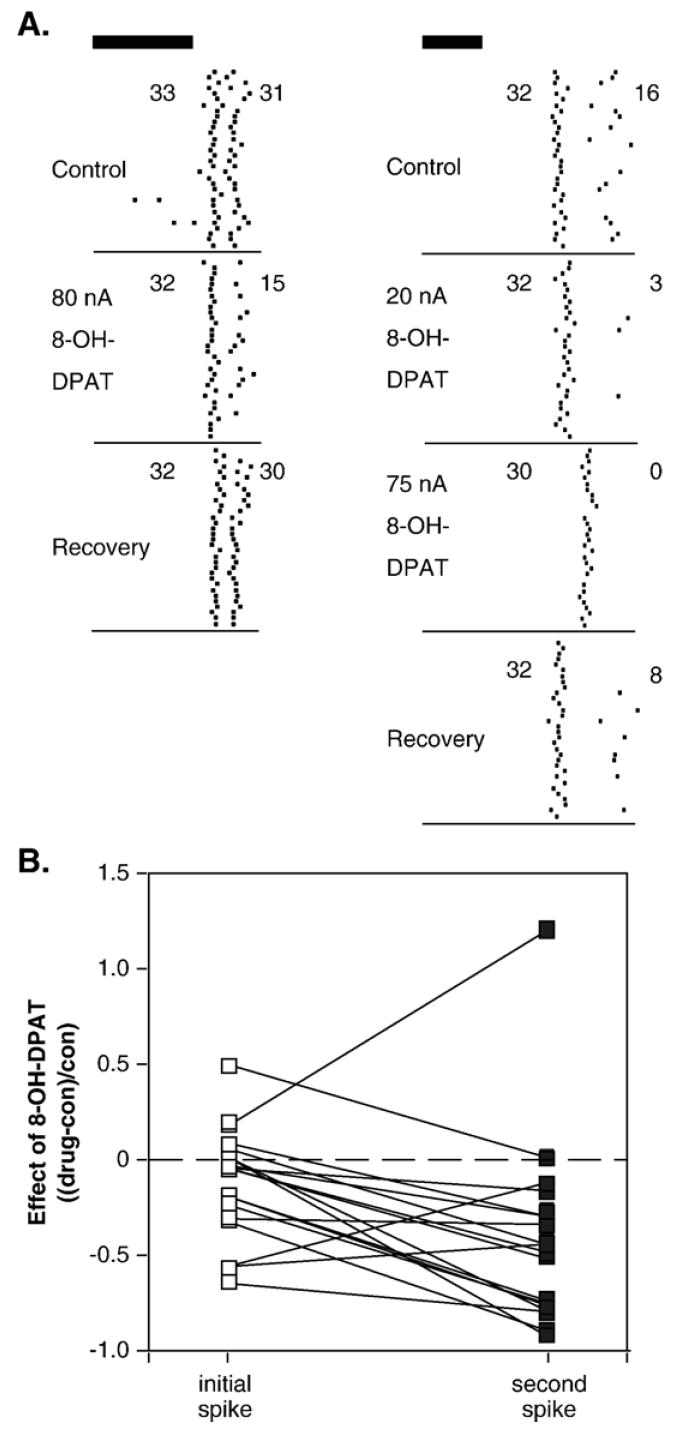
8-OH-DPAT alters the temporal structure of spike trains in single neurons. (A) Peri-stimulus time histograms of two different neurons that both show greater depression of second as opposed to initial spikes in the presence of 8-OH-DPAT. The stimulus presented to the neuron on the left was a 10-kHz FM sweep centered at 24 kHz, at 50-dB SPL, and the stimulus on the right was a 10-kHz FM sweep centered at 24 kHz, at 30-dB SPL. Stimuli for both neurons, represented by dark bars, were 10-ms long. Numbers represent responses for the initial versus second spikes. (B) Effects of 8-OH-DPAT on initial versus second spikes for 18 neurons with consistent intervals between the first and second spike. Values are changes in spike count in the presence of 8-OH-DPAT normalized to the control values for the initial (open symbols) or second (closed symbols) spike. Lines connect values from the same neuron.
3. Discussion
The main finding of this study is that activation of the 5-HT1A receptor depresses the responses of proportionally more neurons with long first-spike latencies than with short latencies. In the presence of a 5-HT1A agonist, most neurons with short latencies (<10 ms) show no change in the evoked response, most neurons with long latencies (>20 ms) show a depression in response, and the population of mid-latency neurons (10–20 ms) is mixed between showing no change or a depression in response. Although the first-spike latencies of IC neurons loosely co-vary with their CFs and positions along the dorsoventral axis (Langner and Schreiner, 1988; Schreiner and Langner, 1988; Park and Pollak, 1993; Haplea et al., 1994; Hattori and Suga, 1997; Ferragamo et al., 1998; Langner et al., 2002; Hurley and Pollak, 2005b), the effect of 5-HT1A activation significantly correlates only with first-spike latency, so that the effects of 5-HT1A receptor activation functionally map with this response property. The following discussion describes the hypothesis that 5-HT1A activation alters the timing of evoked activity within the IC, and analyzes these findings in light of previous studies identifying long-latency neurons as a subpopulation with distinct neurochemical sensitivities and specialized function.
3.1. The 5-HT1A receptor alters the timing of auditory responses in the IC
Serotonin and 5-HT1A activation have previously been reported to change at least one temporal response feature, the first-spike latency (Hurley and Pollak, 2005b, Hurley, 2006). The current study adds to the evidence that the 5-HT1A receptor alters the timing of auditory responses in the IC. Two types of effects of activating the 5-HT1A receptor support this hypothesis. The first of these is that longer-latency neurons are more likely to show a depression in response during activation of the 5-HT1A receptor, biasing the population activity towards shorter latencies. Because long-latency neurons tend to have relatively low CFs (although neurons with low CFs vary greatly in latency, so that not all neurons with low CFs have long latencies), this bias during 5-HT1A activation should be greatest for responses to relatively low frequencies. A possible confound could occur if 5-HT1A activation increased the latencies of short-latency neurons. This is unlikely, however, because in a previous study, serotonin had less of an effect on the latencies of neurons with short control latencies (less than 10 ms) than on the latencies of other neurons (Hurley and Pollak, 2005b).
A second effect of the 5-HT1A receptor on the time course of auditory responses is that, for single neurons, 5-HT1A activation suppresses secondary spikes more than primary ones. This results in the leading portion of the response remaining intact but the lagging portion becoming suppressed (Fig. 4A). Although the data do not support a particular mechanism for this effect of the 5-HT1A agonist, it could result from a uniform as well as from a temporally selective decrease in excitability. Thus, both the population level and single neuron effects of 8-OH-DPAT would change the timing of activity in the IC in similar ways, biasing responses towards times closer to stimulus onset. Of course, IC neurons, in bats and other mammals, are naturally stimulated by sounds that are more complex than the tones or linear FM sweeps used in this study. The 8-OH-DPAT-evoked changes observed here would therefore alter the time course of auditory responses within the IC in a way likely to be dependent on the structure of the stimulus. This is similar to the finding that serotonin-evoked changes in frequency tuning alter responses to recorded vocalizations in Mexican free-tailed bats in ways that are dependent on the spectral content of the calls (Hurley and Pollak, 2005a).
Other neuromodulators also alter the timing of evoked responses in a range of auditory nuclei. Norepinephrine increases the temporal contrast of cochlear nucleus neurons by selectively suppressing later spikes and also by decreasing the variability of initial spikes (Kossl and Vater, 1989). Likewise, manipulating muscarinic receptors in the IC alters different temporal components of evoked responses of some IC neurons (Habbicht and Vater, 1996). Defining a temporal window of responsiveness may therefore be a general role of several neuromodulators.
3.2. Characteristics and roles of long-latency neurons
Several previous studies have suggested that neurons with long latencies are neurochemically distinct from neurons with shorter latencies. Long-latency neurons in the mustache bat IC are influenced heavily by GABAergic inhibition, since the latencies of many are shortened by the GABAA antagonist bicuculline, changing the population distribution of latency (Park and Pollak, 1993). In addition to receiving distinct patterns of inhibitory inputs, the excitatory responses of long-latency neurons are distinctive in that they are due to the activation of NMDA receptors, since the blockade of these receptors, but not of AMPA receptors, abolishes evoked auditory responses. For shorter latency neurons, AMPA receptors play a more dominant role. NMDA receptors may also contribute to the latencies of long-latency neurons in the IC through their slower activation kinetics (Sanchez et al., 2007). The current study provides evidence that long-latency neurons are also especially sensitive to serotonergic modulation. A caveat to this conclusion is that it is possible that the activation of 5-HT1A receptors by endogenous serotonin release could have prevented the full range of effects of the iontophoresed agonist from being observed (Hall and Hurley, 2007). An alternative interpretation of the data is therefore that the 5-HT1A receptors of shorter-latency neurons are already occupied by endogenously released serotonin. This interpretation would still support the conclusion that differences in the effects of activating the 5-HT1A receptor exist among neurons with different latencies, however.
Long-latency neurons in the IC are divergent from short-latency neurons in not only their neurochemical sensitivities, but also their proposed roles in stimulus encoding. A general view of the function of the distribution of latencies among populations of sensory neurons is that they provide for the detection of coincidence between temporally separated features of complex stimuli, facilitating pattern recognition (Hopfield, 1995). Thus, long-latency neurons create delay lines for stimulus features occurring earlier in time that must converge with short-latency lines for stimulus features occurring later in time, in order to generate a maximal response. In bat inferior colliculus, such delay lines are proposed to be involved in encoding stimulus features such as the delay between an echolocation call and its returning echo (O’Neill and Suga, 1982; Sullivan, 1982; Berkowitz and Suga, 1989; Dear et al., 1993; Mittmann and Wenstrup, 1995; Wenstrup et al., 1999; Portfors and Wenstrup, 1999), or the duration of a sound, through the appropriate coincidence of onset and offset responses (Casseday et al., 1994; Ehrlich et al., 1997; Faure et al., 2003). The current results suggest that for both of these temporal coding models, activation of 5-HT1A receptors would disproportionately disrupt the representation of the longest or most widely spaced features of sound by suppressing the responses of proportionally more longer-latency neurons. Yet another proposed function for ranges of latency in coding the temporal characteristics of sound is based on the inverse relationship between latency and the responses to amplitude modulations observed in the cat and chinchilla IC, such that long-latency neurons respond best to low-frequency modulations (Langner et al., 1987; Langner and Schreiner, 1988; Schreiner and Langner, 1988; Langner et al., 2002). In this context, activation of the 5-HT1A receptor would disproportionately suppress the responses to low modulation frequencies.
For all of these features of sound potentially encoded by long-latency neurons, activation of the 5-HT1A receptor, by preferentially suppressing some stimulus response properties, would make the activity of the population of IC neurons more selective. Whether this more selective neural activity would translate to an increased behavioral focus on the less suppressed stimulus features such as shorter or more closely spaced events or more rapid modulations in stimulus amplitude, is currently unknown. However, changes in coding would be more likely to occur in states of high behavioral arousal. This is because neurons in the dorsal raphe nucleus, a major source of serotonergic fibers within the IC, increase their activity in such states (Trulson and Jacobs, 1979, 1981; Klepper and Herbert, 1991). Thus, these results, combined with those of previous studies, support a view of serotonin as a state-dependent regulatory signal that increases the temporal as well as the spectral selectivity of IC neurons.
4. Experimental procedures
4.1. Subjects/surgery
Responses to auditory stimuli and to the iontophoretic application of a 5-HT1A agonist were measured in 91 neurons recorded in the inferior colliculus of 11 male Mexican free-tailed bats (Tadarida brasiliensis). Surgical and iontophoretic techniques were identical to those described in a previous study (Hurley, 2006). Prior to surgery, bats were anesthetized by brief exposure to isoflurane fumes followed by intraperitoneal injection of 120 mg/kg ketamine and 5 mg/kg xylazine. When deep anesthesia was achieved as judged by the lack of response to tail and foot pinch, the skin and muscle overlying the skull were incised and deflected. A small hole was drilled above the IC, the dura was incised, and the hole covered with a thin layer of surgical-grade silicon gel to prevent drying. Lidocaine gel (2%) was applied topically to surgical surfaces, and the bat was placed in a soft foam holder shaped to its body contours and transported to a sound-attenuated chamber. The head of the bat was immobilized in a custom-made stereotaxic device (Schuller et al., 1986) with a post affixed to the skull by dental cement rostral to the IC. In some cases, a second post was attached caudal to the IC with cyanoacrylate gel for additional mechanical stability. The bat was then allowed to waken. Bats usually lay quietly within the recording apparatus. Periodically, topical lidocaine anesthesia was refreshed and the bat was offered water from a dropper. If a bat showed discomfort, as judged by movement that was observed directly or through the recording electrode, a subanesthetic dose of 20 mg/kg ketamine and 1 mg/kg xylazine (1/5 of the surgical dose) was administered. If movement persisted, the experiment was terminated and the bat returned to its home cage. Neurons were recorded during two sessions, with a resting period in the home cage of no less than 10 h between sessions. Before this resting period, bats were reanesthetized with isoflurane, their incisions were sutured, and they were treated with a topical mixture of antibiotic and Lidocaine gels as well as a systemic analgesic (Torbugesic, 1–2 mg/kg). All procedures used in this study were approved by the Bloomington Institutional Animal Care and Use Committee.
4.2. Electrodes, drugs and iontophoresis
Neural recordings were made through single-barreled extracellular pipettes attached in a ‘piggy-back’ configuration (Havey and Caspary, 1980) to tribarreled iontophoresis pipettes. The iontophoresis pipettes were broken to a tip diameter of 10–20 μm, with the recording pipette protruding 10–15 μm in front of the 3-barreled pipette. The tips of the single-barreled pipettes were filled with 1 M NaCl and had resistances of 8–20 MΩ. Pipettes were connected by silver–silver chloride wire to a Dagan 2400 extracellular amplifier (Minneapolis, MN). Spikes were fed through a spike signal enhancer (FHC model, Bowdoinham, ME) before being digitized through a data acquisition processor board (Microstar, Bellevue, WA). Multibarreled electrodes were positioned above the IC under visual control through a dissecting microscope and lowered with a piezoelectric microdrive (Burleigh/EXFO inchworm, Mississauga, Ontario) until action potentials were observed. Batlab software (Dr. Donald Gans, Kent State University) was used for recording action potentials and constructing auditory stimuli.
The selective serotonin receptor agonist 8-OH-DPAT ((±)-8-hydroxy-2-(dipropylamino)tetralin, Sigma-Aldrich, St. Louis, MO) was applied iontophoretically to all 91 neurons recorded. 8-OH-DPAT was dissolved at 10 mM in 200 mM NaCl, pH 4.5. This vehicle solution does not alter neural responses when iontophoresed alone (Hurley and Pollak, 1999, 2001). 8-OH-DPAT was retained in the micropipette with a negative current of 15–20 nA and ejected with a positive current of 75–90 nA. The magnitude of the effect of 8-OH-DPAT depends on the level of iontophoretic current, but the current levels used in the current study were those that induced maximal effects in a previous study on a separate group of neurons (Hurley, 2006). Iontophoretic currents did not exceed 90 nA in order to minimize the possibility of direct effects of the current on neural responses.
Whether the level of anesthesia of the bat could affect the responses of neurons to 8-OH-DPAT is a valid concern, since the levels of endogenous serotonin are hypothesized to vary with the level of behavioral arousal (Trulson and Jacobs, 1979, 1981; Hurley et al., 2004). In a previous study on a separate population of neurons, however, the effects of 8-OH-DPAT on neurons recorded after a dose of supplemental anesthetic were statistically indistinguishable from the effects of this drug in awake bats (Hurley, 2006).
4.3. Auditory stimuli
Auditory stimuli were played through a midline free field speaker (Infinity Emit B, Harman International Industries, Woodbury, NY). Calibration of the speaker was accomplished by placing a measuring microphone (ACO Pacific PS9200 kit, Belmont, CA) in the position occupied by the bat’s head during experiments. The response of the speaker was flat within ±6 dB from 15 to 30 kHz, a range that encompassed the characteristic frequencies of 87% of recorded neurons. Stimuli consisted of tone bursts at CF or FM sweeps ranging from 5 to 10 ms, with 0.5 ms rise and fall time. Linear FM sweeps were centered at the characteristic frequency (CF) for each neuron and swept across a range of 5–10 kHz. Individual stimuli were repeated 32 times to generate measurements of response and first spike latency. Spike data was exported from Batlab in ASCII format for statistical analysis.
After a neuron was encountered, control data were collected. A small portion of the control stimulus repertoire was repeated after a time period equivalent to the expected time to full drug response, to ensure the stability of the response prior to the iontophoresis of drugs. After control measurements were made, 8-OH-DPAT was iontophoresed. While maintaining drug iontophoresis, measurements of auditory responses were made again after drug effects had stabilized, usually a period of several minutes. After drug responses were measured, the iontophoresis of 8-OH-DPAT was halted and additional measurements made after a recovery of 5–10 min.
4.4. Analysis
Responses were measured from FM rather than tone responses in most neurons for two reasons. First, more neurons responded to FM sweeps (n=87) than responded to tones (n=71). Second, since the effects of serotonin are frequency-selective in some neurons (Hurley and Pollak, 2001), responses to FM sweeps provide a more sensitive assessment of the effects of 8-OH-DPAT on evoked responses across all frequencies. Thus, 8-OH-DPAT effects were measured from responses to FM sweeps for 87 neurons and from responses to tones for 4 neurons that were unresponsive to multiple FM sweeps tested. Spikes were counted at intensities 20–30 dB above threshold, and the effect of the iontophoresis of 8-OH-DPAT on evoked responses was normalized relative to control values ((drug–control)/control). For all neurons the CF, recording depth, and the absolute first-spike latency in the control were also measured. CFs were measured for most neurons as the frequency of best tone response at the minimum intensity evoking any response. For neurons without tone responses, CF was estimated as the center frequency of an FM sweep eliciting the maximum response at threshold. Recording depth was measured with reference to the initial electrical contact of the recording electrode with ground as the electrode was lowered into the IC. Latency was measured as the average first-spike latency for responses to 32 stimulus presentations. Since latencies of responses to FM sweeps vary depending on the relative position of the excitatory frequencies within the sweep or with the presence of flanking inhibition (Fuzessery and Hall, 1996; Ferragamo et al., 1998; Heil and Irvine, 1998; Heil, 1997; O’Neill and Brimijoin, 2002), latencies were measured from tone responses.
8-OH-DPAT-evoked changes in response and first-spike latency across the population were compared with CFs, penetration depths, and control first-spike latencies. Linear regressions were used to assess correlations between the effects of 8-OH-DPAT on response and these three descriptive variables. Statistics were performed in SPSS (Chicago, IL).
Acknowledgments
These experiments were supported in part by NIDCD grant DC006608. The author would like to thank Dr. S. Sinha and G.T. Smith for helpful advice on the manuscript.
References
- Balcombe JP, McCracken GF. Vocal recognition in Mexican free-tailed bats: do pups recognize mothers? Anim Behav. 1992;43:79–87. [Google Scholar]
- Berkowitz A, Suga N. Neural mechanisms of ranging are different in two species of bats. Hear Res. 1989;41:255–264. doi: 10.1016/0378-5955(89)90017-8. [DOI] [PubMed] [Google Scholar]
- Casseday J, Ehrlich D, Covey E. Neural tuning for sound duration: role of inhibitory mechanisms in the inferior colliculus. Science. 1994;264:847–850. doi: 10.1126/science.8171341. [DOI] [PubMed] [Google Scholar]
- Dear SP, Fritz J, Haresign T, Ferragamo M, Simmons JA. Tonotopic and functional organization in the auditory cortex of the big brown bat, Eptesicus fuscus. J Neurophysiol. 1993;70:1988–2009. doi: 10.1152/jn.1993.70.5.1988. [DOI] [PubMed] [Google Scholar]
- Ebert U, Ostwald J. Serotonin modulates auditory information processing in the cochlear nucleus of the rat. Neurosci Lett. 1992;145:51–54. doi: 10.1016/0304-3940(92)90201-h. [DOI] [PubMed] [Google Scholar]
- Ehrlich D, Casseday JH, Covey E. Neural tuning to sound duration in the inferior colliculus of the big brown bat, Eptesicus fuscus. J Neurophysiol. 1997;77:2360–2372. doi: 10.1152/jn.1997.77.5.2360. [DOI] [PubMed] [Google Scholar]
- Faingold CL, Gehlbach G, Caspary DM. Functional pharmacology of inferior colliculus neurons. In: Altschuler RA, editor. Neurobiology of Hearing: The Central Auditory System. Raven Press; New York: 1991. pp. 223–251. [Google Scholar]
- Faure PA, Fremouw T, Casseday JH, Covey E. Temporal masking reveals properties of sound-evoked inhibition in duration-tuned neurons of the inferior colliculus. J Neurosci. 2003;23:3052–3065. doi: 10.1523/JNEUROSCI.23-07-03052.2003. [DOI] [PMC free article] [PubMed] [Google Scholar]
- Ferragamo MJ, Haresign T, Simmons JA. Frequency tuning, latencies, and responses to frequency-modulated sweeps in the inferior colliculus of the echolocating bat, Eptesicus fuscus. J Comp Physiol [A] 1998;182:65–79. doi: 10.1007/s003590050159. [DOI] [PubMed] [Google Scholar]
- Ferreira-Netto C, Borelli KG, Brandao ML. Distinct Fos expression in the brain following freezing behavior elicited by stimulation with NMDA of the ventral or dorsal inferior colliculus. Exp Neurol. 2007;204:693–704. doi: 10.1016/j.expneurol.2006.12.023. [DOI] [PubMed] [Google Scholar]
- French B, Lollar A. Observations on the reproductive behavior of captive Tadarida brasiliensis mexicana (Chiroptera: Molossidae) Southw Natural. 1998;43:484–490. [Google Scholar]
- French B, Lollar A. Communication among Mexican free-tailed bats. Bats: Bat Conserv Internat. 2000;18:1–4. [Google Scholar]
- Fuzessery ZM, Hall JC. Role of GABA in shaping frequency tuning and creating FM sweep selectivity in the inferior colliculus. J Neurophysiol. 1996;76:1059–1073. doi: 10.1152/jn.1996.76.2.1059. [DOI] [PubMed] [Google Scholar]
- Habbicht H, Vater M. A microiontophoretic study of acetylcholine effects in the inferior colliculus of horseshoe bats: implications for a modulatory role. Brain Res. 1996;724:169–179. doi: 10.1016/0006-8993(96)00224-7. [DOI] [PubMed] [Google Scholar]
- Hall I, Hurley L. The serotonin releaser fenfluramine alters the auditory responses of inferior colliculus neurons. Hear Res. 2007;28:82–94. doi: 10.1016/j.heares.2007.01.023. [DOI] [PMC free article] [PubMed] [Google Scholar]
- Haplea S, Covey E, Casseday JH. Frequency tuning and response latencies at three levels in the brainstem of the echolocating bat, Eptesicus fuscus. J Comp Physiol [A] 1994;174:671–683. doi: 10.1007/BF00192716. [DOI] [PubMed] [Google Scholar]
- Hattori T, Suga N. The inferior colliculus of the mustached bat has the frequency-vs-latency coordinates. J Comp Physiol [A] 1997;180:271–284. doi: 10.1007/s003590050047. [DOI] [PubMed] [Google Scholar]
- Havey DC, Caspary DM. A simple technique for constructing ‘piggy-back’ multibarrel microelectrodes. Electroencephalogr Clin Neurophysiol. 1980;48:249–251. doi: 10.1016/0013-4694(80)90313-2. [DOI] [PubMed] [Google Scholar]
- Heil P. Auditory cortical onset responses revisited: I. First-spike timing. J Neurophysiol. 1997;77:2616–2641. doi: 10.1152/jn.1997.77.5.2616. [DOI] [PubMed] [Google Scholar]
- Heil P, Irvine DR. Functional specialization in auditory cortex: responses to frequency-modulated stimuli in the cat’s posterior auditory field. J Neurophysiol. 1998;79:3041–3059. doi: 10.1152/jn.1998.79.6.3041. [DOI] [PubMed] [Google Scholar]
- Hopfield JJ. Pattern recognition computation using action potential timing for stimulus representation. Nature. 1995;376:33–36. doi: 10.1038/376033a0. [DOI] [PubMed] [Google Scholar]
- Hoyer D, Clarke D, Fozard J, Hartig P, Martin G, Mylecharane E, Saxena P, Humphrey P. International Union of Pharmacology classification of receptors for 5-hydroxytryptamine (serotonin) Pharmacol Rev. 1994;46:157–203. [PubMed] [Google Scholar]
- Hoyer D, Hannon J, Martin G. Molecular, pharmacological and functional diversity of 5-HT receptors. Pharmacol Biochem Behav. 2002;71:533–534. doi: 10.1016/s0091-3057(01)00746-8. [DOI] [PubMed] [Google Scholar]
- Huang X, Mooney R, Rhoades R. Effects of serotonin on retinotectal-, corticotectal-, and glutamate-induced activity in the superior colliculus of the hamster. J Neurophysiol. 1993;70:723–732. doi: 10.1152/jn.1993.70.2.723. [DOI] [PubMed] [Google Scholar]
- Hurley L. Different serotonin receptor agonists have distinct effects on sound-evoked responses in inferior colliculus. J Neurophysiol. 2006;96:2177–2188. doi: 10.1152/jn.00046.2006. [DOI] [PMC free article] [PubMed] [Google Scholar]
- Hurley L, Pollak G. Serotonin differentially modulates responses to tones and frequency-modulated sweeps in the inferior colliculus. J Neurosci. 1999;19:8071–8082. doi: 10.1523/JNEUROSCI.19-18-08071.1999. [DOI] [PMC free article] [PubMed] [Google Scholar]
- Hurley L, Pollak G. Serotonin effects on frequency tuning of inferior colliculus neurons. J Neurophysiol. 2001;85:828–842. doi: 10.1152/jn.2001.85.2.828. [DOI] [PubMed] [Google Scholar]
- Hurley L, Thompson A. Serotonergic innervation of the auditory brainstem of the Mexican free-tailed bat, Tadarida brasiliensis. J Comp Neurol. 2001;435:77–88. doi: 10.1002/cne.1194. [DOI] [PubMed] [Google Scholar]
- Hurley L, Pollak G. Serotonin modulates responses to species-specific vocalizations in the inferior colliculus. J Comp Physiol [A] 2005a;191:535–546. doi: 10.1007/s00359-005-0623-y. [DOI] [PubMed] [Google Scholar]
- Hurley L, Pollak G. Serotonin shifts first-spike latencies of inferior colliculus neurons. J Neurosci. 2005b;25:7876–7886. doi: 10.1523/JNEUROSCI.1178-05.2005. [DOI] [PMC free article] [PubMed] [Google Scholar]
- Hurley L, Thompson A, Pollak G. Serotonin in the inferior colliculus. Hear Res. 2002;168:1–11. doi: 10.1016/s0378-5955(02)00365-9. [DOI] [PubMed] [Google Scholar]
- Hurley L, Devilbiss D, Waterhouse B. A matter of focus: monoaminergic modulation of stimulus coding in mammalian sensory networks. Curr Opin Neurobiol. 2004;14:488–495. doi: 10.1016/j.conb.2004.06.007. [DOI] [PubMed] [Google Scholar]
- Kaiser A, Covey E. 5-HT innervation of the auditory pathway in birds and bats. In: Syka JL, editor. Acoustical Signal Processing in the Central Auditory System. Plenum Press; New York: 1997. pp. 71–78. [Google Scholar]
- Klepper A, Herbert H. Distribution and origin of noradrenergic and serotonergic fibers in the cochlear nucleus and inferior colliculus of the rat. Brain Res. 1991;557:190–201. doi: 10.1016/0006-8993(91)90134-h. [DOI] [PubMed] [Google Scholar]
- Klug A, Bauer EE, Hanson JT, Hurley L, Meitzen J, Pollak GD. Response selectivity for species-specific calls in the inferior colliculus of Mexican free-tailed bats is generated by inhibition. J Neurophysiol. 2002;88:1941–1954. doi: 10.1152/jn.2002.88.4.1941. [DOI] [PubMed] [Google Scholar]
- Kossl M, Vater M. Noradrenaline enhances temporal auditory contrast and neuronal timing precision in the cochlear nucleus of the mustached bat. J Neurosci. 1989;9:4169–4178. doi: 10.1523/JNEUROSCI.09-12-04169.1989. [DOI] [PMC free article] [PubMed] [Google Scholar]
- Langner G, Schreiner CE. Periodicity coding in the inferior colliculus of the cat: I. Neuronal mechanisms. J Neurophysiol. 1988;60:1799–1822. doi: 10.1152/jn.1988.60.6.1799. [DOI] [PubMed] [Google Scholar]
- Langner G, Schreiner C, Merzenich MM. Covariation of latency and temporal resolution in the inferior colliculus of the cat. Hear Res. 1987;31:197–201. doi: 10.1016/0378-5955(87)90127-4. [DOI] [PubMed] [Google Scholar]
- Langner G, Albert M, Briede T. Temporal and spatial coding of periodicity information in the inferior colliculus of awake chinchilla (Chinchilla laniger) Hear Res. 2002;168:110–130. doi: 10.1016/s0378-5955(02)00367-2. [DOI] [PubMed] [Google Scholar]
- Manunta Y, Edeline J-M. Effects of noradrenaline on frequency tuning of rat auditory cortex neurons. Eur J Neurosci. 1997;9:833–847. doi: 10.1111/j.1460-9568.1997.tb01433.x. [DOI] [PubMed] [Google Scholar]
- Mittmann DH, Wenstrup JJ. Combination-sensitive neurons in the inferior colliculus. Hear Res. 1995;90:185–191. doi: 10.1016/0378-5955(95)00164-x. [DOI] [PubMed] [Google Scholar]
- Mooney R, Huang X, Shi M, Bennett-Clarke C, Rhoades R. Serotonin modulates retinotectal and corticotectal convergence in the superior colliculus. Prog Brain Res. 1996;112:57–69. doi: 10.1016/s0079-6123(08)63320-8. [DOI] [PubMed] [Google Scholar]
- O’Neill WE, Suga N. Encoding of target range and its representation in the auditory cortex of the mustached bat. J Neurosci. 1982;2:17–31. doi: 10.1523/JNEUROSCI.02-01-00017.1982. [DOI] [PMC free article] [PubMed] [Google Scholar]
- O’Neill WE, Brimijoin WO. Directional selectivity for FM sweeps in the suprageniculate nucleus of the mustached bat medial geniculate body. J Neurophysiol. 2002;88:172–187. doi: 10.1152/jn.00966.2001. [DOI] [PMC free article] [PubMed] [Google Scholar]
- Park T, Pollak G. GABA shapes a topographic organization of response latency in the mustache bat’s inferior colliculus. J Neurosci. 1993;13:5172–5187. doi: 10.1523/JNEUROSCI.13-12-05172.1993. [DOI] [PMC free article] [PubMed] [Google Scholar]
- Peruzzi D, Dut A. GABA, serotonin and serotonin receptors in the rat inferior colliculus. Brain Res. 2004;998:247–250. doi: 10.1016/j.brainres.2003.10.059. [DOI] [PubMed] [Google Scholar]
- Portfors C, Wenstrup J. Delay-tuned neurons in the inferior colliculus of the mustached bat: implications for analyses of target distance. J Neurophysiol. 1999;82:1326–1338. doi: 10.1152/jn.1999.82.3.1326. [DOI] [PubMed] [Google Scholar]
- Rogawski MA, Aghajanian GK. Norepinephrine and serotonin: opposite effects on the activity of lateral geniculate neurons evoked by optic pathway stimulation. Exp Neurol. 1980;69:678–694. doi: 10.1016/0014-4886(80)90060-6. [DOI] [PubMed] [Google Scholar]
- Sanchez JT, Gans D, Wenstrup JJ. Contribution of NMDA and AMPA receptors to temporal patterning of auditory responses in the inferior colliculus. J Neurosci. 2007;27:1954–1963. doi: 10.1523/JNEUROSCI.2894-06.2007. [DOI] [PMC free article] [PubMed] [Google Scholar]
- Schreiner CE, Langner G. Periodicity coding in the inferior colliculus of the cat: II. Topographical organization. J Neurophysiol. 1988;60:1823–1840. doi: 10.1152/jn.1988.60.6.1823. [DOI] [PubMed] [Google Scholar]
- Schreiner CE, Langner G. Laminar fine structure of frequency organization in auditory midbrain. Nature. 1997;388:383–386. doi: 10.1038/41106. [DOI] [PubMed] [Google Scholar]
- Schuller G, Radtke-Schuller S, Betz M. A stereotaxic method for small animals using experimentally determined reference profiles. J Neurosci Methods. 1986;18:339–350. doi: 10.1016/0165-0270(86)90022-1. [DOI] [PubMed] [Google Scholar]
- Sullivan WE., III Neural representation of target distance in auditory cortex of the echolocating bat Myotis lucifugus. J Neurophysiol. 1982;48:1011–1032. doi: 10.1152/jn.1982.48.4.1011. [DOI] [PubMed] [Google Scholar]
- Thompson GC, Thompson AM, Garrett KM, Britton BH. Serotonin and serotonin receptors in the central auditory system. Otolaryngol Head Neck Surg. 1994;110:93–102. doi: 10.1177/019459989411000111. [DOI] [PubMed] [Google Scholar]
- Trulson ME, Jacobs BL. Raphe unit activity in freely moving cats: correlation with level of behavioral arousal. Brain Res. 1979;163:135–150. doi: 10.1016/0006-8993(79)90157-4. [DOI] [PubMed] [Google Scholar]
- Trulson ME, Jacobs BL. Activity of serotonin-containing neurons in freely moving cats. In: Jacobs BL, Gelperin A, editors. Serotonin Neurotransmission and Behavior. The MIT Press; Cambridge: 1981. pp. 339–365. [Google Scholar]
- Vergé D, Calas A. Serotoninergic neurons and serotonin receptors: gains from cytochemical approaches. J Chem Neuroanat. 2000;18:41–56. doi: 10.1016/s0891-0618(99)00050-2. [DOI] [PubMed] [Google Scholar]
- Wenstrup J, Mittmann D, Grose C. Inputs to combination-sensitive neurons of the inferior colliculus. J Comp Neurol. 1999;409:509–528. doi: 10.1002/(sici)1096-9861(19990712)409:4<509::aid-cne1>3.0.co;2-s. [DOI] [PubMed] [Google Scholar]
- Xiang Z, Prince DA. Heterogeneous actions of serotonin on interneurons in rat visual cortex. J Neurophysiol. 2003;89:1278–1287. doi: 10.1152/jn.00533.2002. [DOI] [PubMed] [Google Scholar]
- Yan Z. Regulation of GABAergic inhibition by serotonin signaling in prefrontal cortex: molecular mechanisms and functional implications. Mol Neurobiol. 2002;26:203–216. doi: 10.1385/MN:26:2-3:203. [DOI] [PubMed] [Google Scholar]