Abstract
Purpose
To quantify the prevalence and effect on visual acuity of macular cysts in a large cohort of patients with retinitis pigmentosa.
Methods
In 316 patients with typical forms of retinitis pigmentosa, we measured visual acuities with Early Treatment Diabetic Retinopathy Study (ETDRS) charts, detected macular cysts with optical coherence tomography (OCT), and quantified retinal thicknesses by OCT. We used the FREQ, LOGISTIC, and GENMOD procedures of SAS to evaluate possible risk factors for cyst prevalence and the MIXED procedure to quantify the relationships of visual acuity to retinal thickness measured at different locations within the macula.
Results
We found macular cysts in 28% of the patients, 40% of whom had cysts in only one eye. Macular cysts were seen most often in patients with dominant disease and not at all in patients with X-linked disease (p = 0.006). In eyes with macular cysts, multiple regression analysis revealed that visual acuity was inversely and independently related to retinal thickness at the foveal center (p = 0.038) and within a ring spanning an eccentricity of 5° to 10° from the foveal center (p = 0.004).
Conclusions
Macular cysts are a common occurrence in retinitis pigmentosa, especially among patients with dominantly-inherited disease. Visual acuity is influenced by edema in the parafovea, as well as in the fovea.
Introduction
In a previous study of 162 patients with retinitis pigmentosa we used optical coherence tomography (OCT) to demonstrate that visual acuity was best related to central foveal retinal thickness by a 2nd-order polynomial for eyes without macular cysts.1 By cross-sectional analysis, visual acuity declined both for decreasing retinal thickness due to photoreceptor loss and for increasing retinal thickness, presumably due to edema. While the acuity loss due to retinal thinning was marked, we could not precisely relate the acuity loss due to macular edema, because the increases in retinal thickness were generally small.
For the present study we enlarged our cohort of patients with retinitis pigmentosa evaluated by OCT and included in our analyses eyes with macular cysts. We first quantified the percentage of patients with macular cysts, which has ranged from 13% to 70% in reports based on smaller numbers of patients,2-9 to estimate the midpoint and confidence limits for cyst prevalence in retinitis pigmentosa. We next determined whether the likelihood of cysts depended on genetic type — which was found in one report5 but not in another6 —or on age, gender, or previous cataract surgery. Lastly, we investigated the extent to which central and off-center macular edema impacted visual acuity in patients with cysts, because a previous study had found that visual acuity was better related to the width (transverse extent) of edema than to the central foveal thickness in patients with retinitis pigmentosa.7
Methods
Patients
The protocol was approved by the Institutional Review Boards of the Massachusetts Eye and Ear Infirmary and Harvard Medical School and conformed to the tenets of the Declaration of Helsinki and HIPAA regulations. Informed consent was obtained from all patients. We examined 316 consecutive unrelated adults with typical forms of retinitis pigmentosa (57% male, ages 18 to 68 years) who had best-corrected Snellen visual acuities of 20/20 to hand motions. There were 71 dominant cases (22.5%), 44 recessive cases (13.9%), 15 X-linked cases (4.7%), 167 simplex (i.e., isolate) cases (52.9%), and 19 cases with undetermined inheritance (6.0%).
Visual acuity measurements
We measured best-corrected visual acuities with transilluminated Early Treatment Diabetic Retinopathy Study (ETDRS) charts.10 The ETDRS charts contain 5 letters of comparable difficulty on each line, and letters on each lower line decrease in size by 0.1 log10-unit (21%). ETDRS acuity was scored as the number of letters correctly read, each letter being valued at 0.02 log10-unit.
OCT evaluations
We used a Stratus High-Resolution Optical Coherence Tomographer (Model 3000, Carl Zeiss Meditec, Dublin, CA) with software version 3 to assess retinal structure and measure retinal thickness after pupillary dilation. With this third-generation instrument (OCT3) we recorded from each eye six 6-mm line scans in a radial spoke pattern of 30° intervals intersecting at the foveal center.11 Each tomogram consisted of 512 A-scans, each A-scan comprising 1,024 data points spanning a 2-mm depth, and location of the foveola in the scan was routinely monitored and centered by the examiner (MAS).1 However, in eyes with macular cysts it was sometimes difficult to confirm that the foveola was precisely centered in the scan, and in such cases the examiner relied on the patient's fixation.
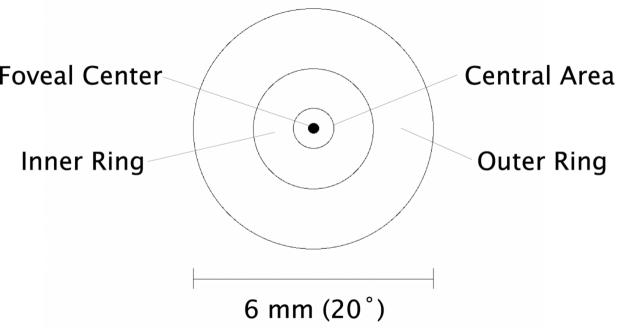
Each radial scan group was analyzed as a retinal thickness map by the automated OCT software which identified the vitreoretinal interface and retinal pigment epithelium (RPE)/choriocapillaris complex as regions of high reflectance. As illustrated in the schematic of Figure 1, we coded the retinal thickness at the foveal center, the mean retinal thickness for a central area of 1 mm diameter, the mean retinal thickness for an inner ring of 1 mm inner diameter (ID) and 3 mm outer diameter (OD), and the mean retinal thickness for an outer ring of 3 mm ID and 6 mm OD. In rare cases, we quantified the central foveal thickness of individual scans by manually positioning the software calipers. Recording and quantification of tomograms were done with the examiner masked to the patients' visual acuities.
1.
Schematic of retinal locations evaluated in the present study. Retinal thicknesses were quantified for the foveal center, a central area of 1 mm (3.3°) diameter, an inner ring of 1 mm (3.3°) ID to 3 mm (10°) OD, and an outer ring of 3 mm (10°) ID to 6 mm (20°) OD.
Statistical analyses
We used PROC FREQ of SAS, version 9.1 (SAS Institute, Cary, NC) to assess the prevalence of macular cysts by genetic type or gender and PROC LOGISTIC to assess the prevalence of macular cysts by genetic type controlling for age. We used PROC GENMOD with a binary outcome distribution and repeated measures to determine whether macular cysts were significantly more common in pseudophakic eyes than in phakic eyes. We used PROC MIXED with repeated measures to regress ETDRS acuity on retinal thickness measured at different locations, singly or in combination, in eyes with macular cysts, taking into account the correlation between eyes of the same patient. Other analyses were done with JMP, version 6 (SAS Institute).
Results
Representative tomograms
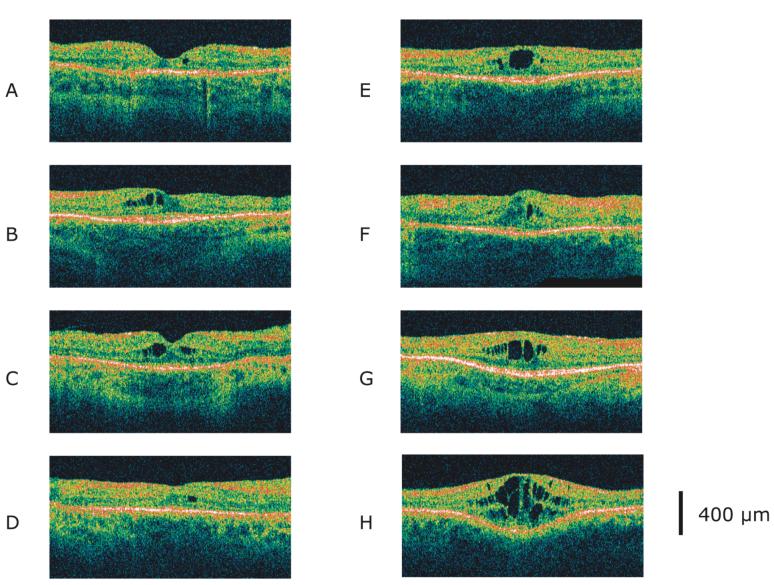
Figure 2 illustrates the variety of edematous changes that we observed in the tomograms, in order of increasing central foveal thickness. Some tomograms showed a rare vacuole of 50-µm diameter in the inner nuclear layer situated eccentric to the foveal center (A, D), some showed medium-sized cysts symmetric about the foveal center (C), and others had single or several large centralized cysts, distorting multiple layers (E, G, H). Rarely, pronounced foveal swelling was accompanied by only small cysts (F). Some tomograms had thickening mostly confined to the fovea (E, G, H), while other showed diffuse swelling into the parafovea, either asymmetrically (B) or symmetrically (C, D, F). In our population, central foveal thickness averaged 256 µm in eyes with cysts versus 170 µm in eyes without cysts OD and 262 µm in eyes with cysts versus 167 µm in eyes without cysts OS (normal mean = 167 µm). Both of these increases in retinal thickness due to cysts were statistically significant (p < 0.001).
2.
Tomograms from 8 patients with retinitis pigmentosa and macular cysts. The tomograms are from the right eye of a 33-year-old male with dominant disease (A), the left eye of a 41-year-old female with simplex disease (B), the right eye of a 29-year-old male with simplex disease (C), the right eye of a 44-year-old female with simplex disease (D), the left eye of a 35-year-old female with simplex disease (E), the right eye of a 34-year-old female with dominant disease (F), the right eye of a 37-year-old male with simplex disease (G), and the left eye of a 47-year-old female with dominant disease (H). Each tomogram subtends 6 mm horizontally.
Prevalence of Macular Cysts
Eighty-nine (28%) of the patients had macular cysts by OCT. Thirty-seven (40%) of these patients with cysts had them in only one eye. The patients with bilateral cysts were not significantly different in average age from those with unilateral cysts (p = 0.30). However, the bilateral group had an average central foveal thickness based on both eyes (273 µm) that was significantly larger than the average central foveal thickness of the cystic eyes of the unilateral group (219 µm, p = 0.001).
We found macular cysts in 26% of males and in 34% of females after excluding patients with X-linked disease; this variation by gender was not statistically significant (exact test, p = 0.16). Two patients had diabetes mellitus but were negative for cysts. Twenty-seven patients were pseudophakic in both eyes: six had bilateral cysts, 4 had unilateral cysts, and 17 had no cysts. Ten patients were pseudophakic in one eye: 2 had cysts and 8 had no cysts in that eye. The probability of having a cyst in one or both eyes was not significantly related to being pseudophakic in those eyes (p = 0.36).
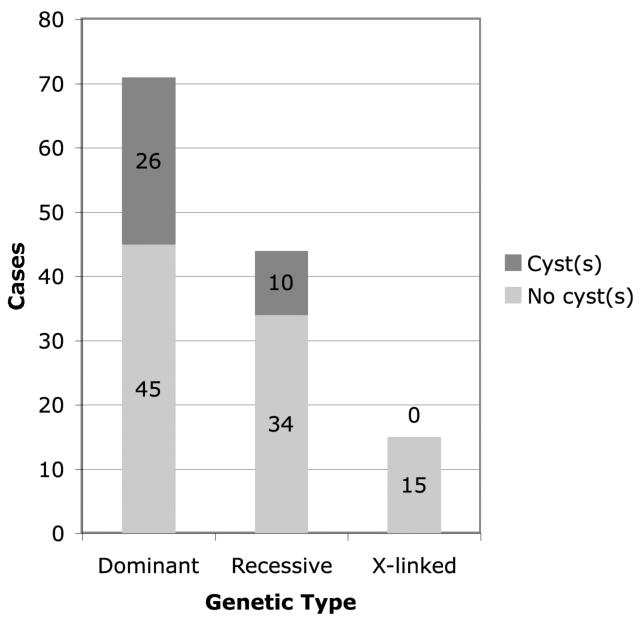
Figure 3 shows that the prevalence of macular cysts was highest (37%) in patients with dominant disease, less (23%) in patients with autosomal recessive disease, and lowest (0%) in patients with X-linked disease; this variation was statistically significant (generalized exact test, p = 0.006). Since patient age varied by genetic type (p < 0.001) — mean ages were 41 years for patients with dominant disease, 39 years for patients with autosomal recessive disease, and 30 years for patients with X-linked disease — we hypothesized that differences in age could underlie the differences in cyst prevalence by genetic type. However, by multiple logistic regression we found that cyst prevalence remained significantly related to genetic type even when adjusting for differences in patient age (p = 0.009).
3.
Number of patients with retinitis pigmentosa with and without macular cysts by genetic type.
Regression of Visual Acuity on Retinal Thickness by Location
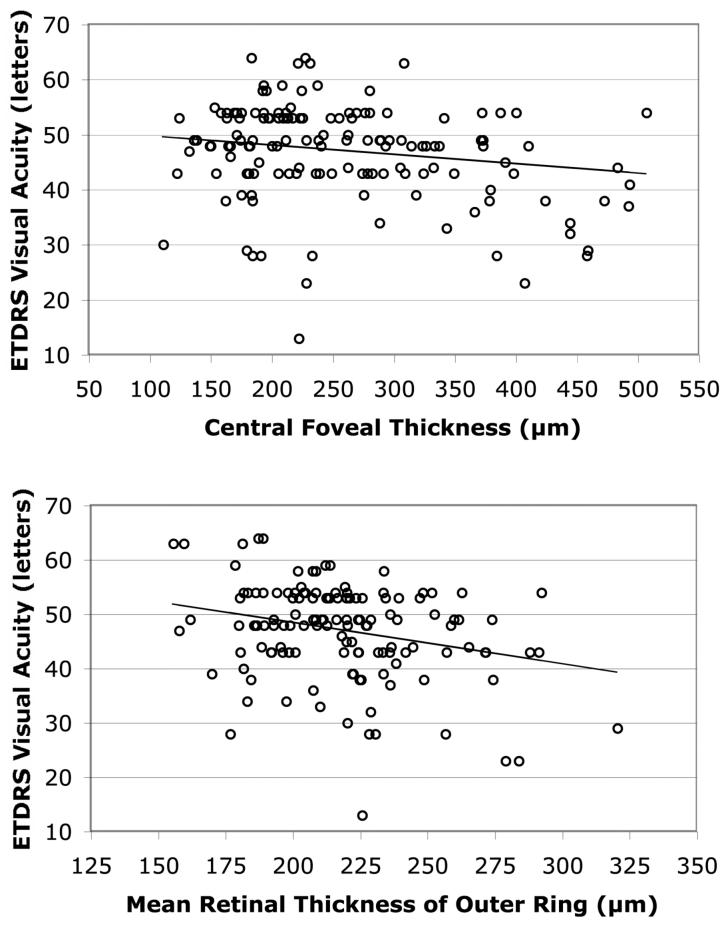
Table 1 lists the slope and level of significance for the regression of ETDRS acuity on retinal thickness by location for eyes with macular cysts. Each of the four locations showed an inverse relationship between visual acuity and retinal thickness. However, the slopes were significantly different from zero only for two retinal locations — the foveal center and the outer ring — and these two inverse relationships are illustrated in Figure 4. The variation in central foveal thickness explained 6% of the variation in visual acuity (i.e., r2 = 0.06), while the variation in mean retinal thickness of the outer ring explained 12% of the variation in visual acuity (i.e., r2 = 0.12). When these two measurements were included in a multiple regression model, both were independent predictors of visual acuity (Table 2) and their combination provided a better fit to the acuity data (r2 = 0.14, p < 0.001) than any single measure of retinal thickness alone.
Table 1.
Regression of ETDRS Visual Acuity on Retinal Thickness in Patients with Retinitis Pigmentosa and Macular Cysts
| Retinal Location | Cases/Eyes with Cysts* | Slope (letters/100 µm)† | P-value‡ |
|---|---|---|---|
| Foveal Center | 89/141 | −1.7 ± 0.8 | 0.032 |
| Central Area (1 mm diameter) | 88/137 | −1.7 ± 1.1 | 0.105 |
| Inner Ring (1 mm ID - 3 mm OD) | 89/139 | −4.4 ± 2.4 | 0.067 |
| Outer Ring (3 mm ID - 6 mm OD) | 89/139 | −7.6 ± 2.7 | 0.006 |
The variation in the number of cases or eyes with cysts reflects instances where retinal thickness could not be correctly quantified by the software at a given location.
Estimates of mean slope ± standard error by PROC MIXED of SAS.
The two-tailed significance level with respect to zero slope.
4.
Regression of ETDRS visual acuity on central foveal thickness (top) and on the mean retinal thickness of the outer ring with a 3 mm inner diameter and a 6 mm outer diameter (bottom) based on data from cystic eyes of 89 patients with retinitis pigmentosa. The regression lines were estimated by PROC MIXED of SAS and are y = 51.4 − 0.017 x (top) and y = 63.6 − 0.076 x (bottom), where y is ETDRS acuity (letters) and x is retinal thickness (µm). For reference, an ETDRS acuity of 61 letters corresponded to a Snellen acuity of 20/20 in eyes with cysts, and 95% confidence limits are 118 µm - 216 µm for central foveal thickness and 214 µm - 266 µm for the mean retinal thickness of the outer ring based on data from 22 normal volunteers evaluated in our test system.
Table 2.
Multiple Regression of ETDRS Visual Acuity on Retinal Thickness in Patients with Retinitis Pigmentosa and Macular Cysts
| Retinal Location | Slope (letters/100 µm)* | P-value† |
|---|---|---|
| Foveal Center | −1.6 ± 0.8 | 0.038 |
| Outer Ring (3 mm ID - 6 mm OD) | −7.7 ± 2.6 | 0.004 |
Estimates of mean slope ± standard error by PROC MIXED of SAS based on data from 89 cases (139 eyes).
The two-tailed significance level with respect to zero slope controlling for the relationship of visual acuity to retinal thickness at the other location. The regression line is y = 67.9 − 0.016 x1 − 0.077 x2, where y is ETDRS acuity (letters), x1 is central foveal thickness (µm), and x2 is mean outer ring retinal thickness (µm); the overall model has a p-value = 0.0004.
Discussion
Prevalence of Macular Cysts in Retinitis Pigmentosa
Based on our cohort of 316 patients studied by OCT, we estimate the prevalence of macular cysts in retinitis pigmentosa to be 28%. For this sample size, the percentage of patients with cysts is accurate to within ± 5% with 95% confidence as an estimate of the population value for patients with retinitis pigmentosa.12 Our study used a protocol of scanning each eye with 6 radial lines at the highest resolution, and we observed many patients who had a cyst in one or two tomograms and not in the other four or five tomograms. Perhaps for this reason, a lower prevalence estimate (21%) was obtained based on a combined total of 75 patients from two OCT studies that used only vertical and horizontal scans to detect macular cysts.7,8 A higher prevalence estimate (49%) was recently reported for 39 patients tested with OCT using all 6 radial scans.9 If we combine their results with ours, we obtain a prevalence of 30%. Since we previously reported that some patients had retinas that appeared swollen without cysts,1 the prevalence of edema with or without cysts in retinitis pigmentosa most likely is at least 1/3 of cases. In our study, 40% of patients with cysts had them in only one eye, and their cysts tended to be smaller than those in patients with bilateral cysts. This suggests that those with unilateral cysts have earlier-stage edema, at risk for worsening and involving the second eye.
We did not find age, gender, diabetes, or pseudophakia to affect the risk for having macular cysts in our patients with retinitis pigmentosa. However, we documented a genetic predisposition to macular cysts, which were found in 37% of cases with dominant disease, in 23% of cases with recessive disease, and in no cases with X-linked disease. This variation confirms a previous report based on biomicroscopy of 94 eyes,5 which found cysts in 69% of eyes of patients with dominant disease, in 17% of eyes of patients with recessive disease, and in no eyes of patients with X-linked disease. In spite of the fact that neither their study nor ours detected cysts in patients with X-linked disease, there are reported instances of macular cysts in patients with this genetic type.6,7,13
Clinical Significance of Macular Cysts in Retinitis Pigmentosa
Of three smaller studies that measured the association between visual acuity and central foveal thickness in patients with retinitis pigmentosa and macular cysts, one found a significant relationship8 and two did not.7,9 In the present study we confirmed that visual acuity is inversely related to central foveal thickness in eyes with macular cysts. ETDRS acuity declined by an average of 1.7 letters for each 100-µm increase in thickness. We previously reported an 11-letter average decline in ETDRS acuity for each 100-µm decrease in central foveal thickness due to cell loss in eyes of patients with retinitis pigmentosa without macular cysts.1 By taking a ratio of these two figures (i.e., 11 letters/1.7 letters), we find that for a given change in central foveal thickness the impact of cell loss on visual acuity appears to be 6.5 times the impact of edematous swelling on acuity in this disease.
Remarkably, we found in our patients with macular cysts that ETDRS acuity declined due to increases both in central foveal thickness and in the mean retinal thickness within an outer ring spanning an eccentricity of 5° to 10° from the foveal center (see Fig 4, top and bottom). The retinal thicknesses in the bottom graph likely underestimate the magnitude of edema at that location, since patients with retinitis pigmentosa generally have marked parafoveal cell loss as evidenced by the tomograms of eyes without macular cysts.1 Thus, much of the retinal thickness data in the bottom graph reflect the net result of cell loss and swelling.
While the dependence of visual acuity on edema at the foveal center — where acuity is measured — is intuitive, the basis of its dependence on edema in a parafoveal region is not obvious, especially given that these two dependencies appear to be independent according to our analysis. That is, our data indicate that the loss of acuity due to edema represents the sum of the effect of edema in the foveal center and the effect of edema in the parafovea. It may be relevant to note that in some patients with retinitis pigmentosa and cystoid macular edema marked reductions in retinal thickness within the fovea following treatment with a topical carbonic anhydrase inhibitor14 or an intravitreal steroid15 were not associated with commensurate improvements in visual acuity. It is possible that these eyes had reduced acuity due to foveal cell loss prior to the edema or developed irreversible functional damage as a result of the edema itself,8 and treatment benefit was, therefore, limited by a ceiling effect. However, it is also possible that the treatments did not effectively reduce parafoveal edema (as was evident in one illustration15). Our results suggest that in evaluating the benefit of any treatment for macular edema in retinitis pigmentosa its effect on both the foveal and parafoveal retina should be considered.
Acknowledgments
The authors thank Bernard Rosner, Ph.D., Professor of Medicine (Biostatistics), Harvard Medical School for guidance regarding the use of SAS.
Supported by: National Eye Institute grant EY00169 and The Foundation Fighting Blindness, Owings Mills, MD.
References
- 1.Sandberg MA, Brockhurst RJ, Gaudio AR, Berson EL. The association between visual acuity and central retinal thickness in retinitis pigmentosa. Invest Ophthalmol Vis Sci. 2005;46:3349–54. doi: 10.1167/iovs.04-1383. [DOI] [PubMed] [Google Scholar]
- 2.Fetkenhour CL, Choromokos E, Weinstein J, Shoch D. Cystoid macular edema in retinitis pigmentosa. Trans Am Acad Ophthalmol Otolaryngol. 1977;83:515–21. [PubMed] [Google Scholar]
- 3.Fishman GA, Maggiano JM, Fishman M. Foveal lesions seen in retinitis pigmentosa. Arch Ophthalmol. 1977;95:1993–6. doi: 10.1001/archopht.1977.04450110087008. [DOI] [PubMed] [Google Scholar]
- 4.Newsome DA. Retinal fluorescein leakage in retinitis pigmentosa. Am J Ophthalmol. 1986;101:354–60. doi: 10.1016/0002-9394(86)90831-7. [DOI] [PubMed] [Google Scholar]
- 5.Kuchle M, Nguyen NX, Martus P, et al. Aqueous flare in retinitis pigmentosa. Graefes Arch Clin Exp Ophthalmol. 1998;236:426–33. doi: 10.1007/s004170050101. [DOI] [PubMed] [Google Scholar]
- 6.Pruett RC. Retinitis pigmentosa - clinical observations and correlations. Trans Am Ophthalmol Soc. 1983;81:693–735. [PMC free article] [PubMed] [Google Scholar]
- 7.Hirakawa H, Iijima H, Gohdo T, Tsukahara S. Optical coherence tomography of cystoid macular edema associated with retinitis pigmentosa. Am J Ophthalmol. 1999;128:185–91. doi: 10.1016/s0002-9394(99)00100-2. [DOI] [PubMed] [Google Scholar]
- 8.Chung H, Hwang J-U, Kim J-G, Yoon Y. Optical coherence tomography in the diagnosis and monitoring of cystoid macular edema in patients with retinitis pigmentosa. Retina. 2006;26:922–7. doi: 10.1097/01.iae.0000250008.83779.23. [DOI] [PubMed] [Google Scholar]
- 9.Adackapara CA, Sunness J, Dibernardo CW, et al. Prevalence of cystoid macular edema and stability in OCT retinal thickness in eyes with retinitis pigmentosa during a 48-week lutein trial. Retina. 2008;28:103–110. doi: 10.1097/IAE.0b013e31809862aa. [DOI] [PubMed] [Google Scholar]
- 10.Berson EL, Rosner B, Sandberg MA, et al. A randomized trial of vitamin A and vitamin E supplementation for retinitis pigmentosa. Arch Ophthalmol. 1993;111:761–71. doi: 10.1001/archopht.1993.01090060049022. [DOI] [PubMed] [Google Scholar]
- 11.Massin P, Vicaut E, Haouchine B, et al. Reproducibility of retinal mapping using optical coherence tomography. Arch Ophthalmol. 2001;119:1135–42. doi: 10.1001/archopht.119.8.1135. [DOI] [PubMed] [Google Scholar]
- 12.Pezzullo JC. Exact binomial and Poisson confidence intervals. http://statpages.org/confint.html
- 13.Spalton DJ, Bird AC, Cleary PE. Retinitis pigmentosa and retinal oedema. Br J Ophthalmol. 1978;62:174–82. doi: 10.1136/bjo.62.3.174. [DOI] [PMC free article] [PubMed] [Google Scholar]
- 14.Grover S, Apushkin MA, Fishman GA. Topical dorzolamide for the treatment of cystoid macular edema in patients with retinitis pigmentosa. Am J Ophthalmol. 2006;141:850–8. doi: 10.1016/j.ajo.2005.12.030. [DOI] [PubMed] [Google Scholar]
- 15.Ozdemir H, Karacorlu M, Karacorlu S. Intravitreal triamcinolone acetonide for treatment of cystoid macular oedema in patients with retinitis pigmentosa. Acta Ophthalmol Scand. 2005;83:248–51. doi: 10.1111/j.1600-0420.2005.00395.x. [DOI] [PubMed] [Google Scholar]


