Abstract
In this paper, we analyze the physical basis for elasticity imaging of the breast by measuring breast skin stress patterns that result from a force sensor array pressed against the breast tissue. Temporal and spatial changes in the stress pattern allow detection of internal structures with different elastic properties and assessment of geometrical and mechanical parameters of these structures. The method entitled mechanical imaging is implemented in the breast mechanical imager (BMI), a compact device consisting of a hand held probe equipped with a pressure sensor array, a compact electronic unit, and a touchscreen laptop computer. Data acquired by the BMI allows calculation of size, shape, consistency/hardness, and mobility of detected lesions. The BMI prototype has been validated in laboratory experiments on tissue models and in an ongoing clinical study. The obtained results prove that the BMI has potential to become a screening and diagnostic tool that could largely supplant clinical breast examination through its higher sensitivity, quantitative record storage, ease-of-use, and inherent low cost.
Index Terms: Breast, breast cancer screening, elastography, mechanical imaging, tissue elasticity
I. Introduction
Breast cancer is one of the most common causes of death from cancer in the United States. The American Cancer Society estimates that in 2007, approximately 180 510 new cases of invasive breast cancer will be diagnosed in the U.S. alone, and 40 910 deaths (40 460 women and 450 men) from this disease are predicted [1]. The lifetime probability of developing breast cancer in the next 10 years is evaluated as 13.2% [2]. A critical key to a continued reduction in mortality is easy detection and accurate diagnosis [3] made in a cost-effective manner [4].
Current methods of breast pathology assessment include clinical breast examination (CBE), mammography, ultrasound, magnetic resonance imaging (MRI), and biopsy. Recent large-scale clinical study of diagnostic performance of mammography for breast-cancer screening showed that diagnostic accuracy of digital and film mammography is only 78% and 74%, respectively [5]. According to data from the behavioral risk factor surveillance system, only 54.9% of U.S. women in 2003 have had a mammogram within that year [2]. Ultrasound is increasingly being used as a complementary method for the assessment of mammographically or clinically detected masses and can add information for dense tissue [6], but there are limited data supporting the use of ultrasound for breast cancer screening as an adjunct to mammography in women at increased risk of breast cancer or dense breast tissue [4]. Many indications for clinical breast MRI are recognized, including resolving findings on mammography and staging of breast cancer [7].
The premise underlying CBE is visually inspecting and palpating the breast tissue to detect abnormalities or evaluate patient reports of symptoms to find palpable breast cancers at an earlier stage of progression [8]. American Cancer Society guidelines suggest an annual CBE for age 40 and older for early detection of breast cancer in asymptomatic women [2]. The CBE identifies some cancers missed by mammography [9], [10] and provides an important screening tool among women for whom mammography is not recommended or women who do not receive high-quality screening mammography according to recommended guidelines. But CBE performance and reporting approaches are inconsistent. Health care providers report a lack of confidence in their CBE skills and would welcome training and practical recommendations for optimizing performance and reporting [11]. Data for the six studies examined by Barton et al. resulted in an overall estimate of 54.1% for CBE sensitivity and 94.0% for CBE specificity [12]. These findings are comparable to the published values for CBE sensitivity (58.8%) and specificity (93.4%) observed in U.S. national screening program for 752 081 CBE reports [13]. Early-stage breast cancer typically produces no symptoms when the tumor is small and most treatable. When breast cancer has grown to a size when it can be felt, the most important physical sign of breast cancer is a painless mass [14]. From this point, CBE may be a suitable option for countries in economic transition, where incidence rates are on the increase but limited resources do not permit screening by mammography.
Therefore, a method that mimics CBE but with enhanced sensitivity and specificity might consequently lead to a greater screening yield. Such a method for detection and visualizing breast abnormalities and assessing their mechanical properties with sensitivity exceeding that of manual palpation is described in this paper. The method, termed mechanical imaging (MI), translates the tissue’s elastic properties into a digital 3-D map of the detected mass [15]. MI is based on reconstructing the internal structure of soft tissues using the data obtained by a force sensor array pressed against the examined site. The changes in the surface stress patterns as a function of displacement, applied load and time provide information about elastic composition and geometry of the underlying tissue structures.
The MI might be considered as a branch of elasticity imaging or elastography—an emerging medical imaging technology. Various versions of ultrasound elastography (USE) and magnetic resonance elastography (MRE) have been developed during last decade [16]–[27] and tested in a broad range of clinical applications including breast cancer detection [28]–[32].
Evaluation of tissue “hardness” (Young’s or shear elasticity modulus) by various elasticity imaging techniques provides a means for characterizing the tissue, differentiating normal and diseased conditions and detecting tumors [33]. Measurements on excised breast specimens showed that normal tissue has a modulus that is noticeably lower than the modulus of the breast cancers. Tumor inclusions or tissue blocked from its blood nutrients are stiffer than normal tissue; benign and cancerous tumors also have distinguishing elastic properties [34], [35].
MI, which is being developed at Artann Laboratories since early 1990s, yields a tissue elasticity map, similarly to other elastographic techniques. At the same time, MI, which is also called “stress imaging” or “tactile imaging,” most closely mimicks manual palpation, since the MI probe with a pressure sensor array mounted on its tip acts similarly to human fingers during clinical examination, slightly compressing soft tissue by the probe. Laboratory studies on breast phantoms and excised prostates have shown that computerized palpation is more sensitive than a human finger [36]–[38].
Significant progress in development of tactile imaging technology has been made by researchers at Harvard University in the applications related to detection of breast masses and cancer [39]–[45].
The main purpose of the present study is the development and validation of the breast mechanical imager (BMI), a device for real time imaging of breast pathologies and assessment of the detected lesion features such as size, shape, consistency/hardness, strain hardening, heterogeneity, and mobility.
II. Breast Mechanical Imaging System
A. System Overview
The BMI includes a probe with a pressure sensor array, an electronic unit, and a laptop computer as shown in Fig. 1. The device shown in Fig. 1 is currently produced by Medical Tactile, Inc., Los Angeles, CA, under the trade name SureTouch, as a visual mapping system for documentation of the CBE findings. The pressure sensor array (Pressure Profile Systems, Inc., Los Angeles, CA) is installed on the probe head surface contacting with breast skin through a disposable elastic protective cover during the examination procedure. The probe head measures 50 mm in length and 40 mm in width, having a curvature radius of 38 mm. The sensor array comprises 192 (16 × 12) pressure sensors covering 40 mm × 30 mm. Each pressure sensor has a rectangular pressure sensing area of 2.5 mm × 2.5 mm, sensitivity of about 0.05 kPa, and a hysteresis of 2%–4% of the operational range [46]. The electronic unit communicates with the computer through a USB port, and provides about 20 pressure distribution frames per second.
Fig. 1.
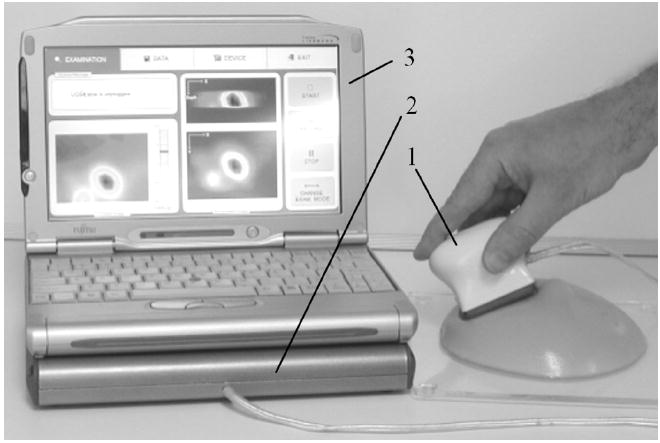
General view of the Breast Mechanical Imager. The device comprises: (1) a probe with 2-D pressure sensor array, (2) an electronic unit, and (3) a laptop computer with touch screen capability.
BMI software provides three operational statuses of the device: examination procedure, data management, and device management status. During examination, the software allows real time visualization of a current 2-D pressure pattern, total applied force to the breast surface, as well as detected breast nodule cross-sectional views (see Fig. 2). Displaying real time images helps a breast examinator to evaluate findings in real time, and to avoid excessive data collection. The data management tab allows data saving and retrieval, as well as a printout of the examination report for the patient’s chart. The device management tab is utilized for software configuration, probe identification, tuning, and calibration. The user interface in the examination mode is shown in Fig. 2.
Fig. 2.
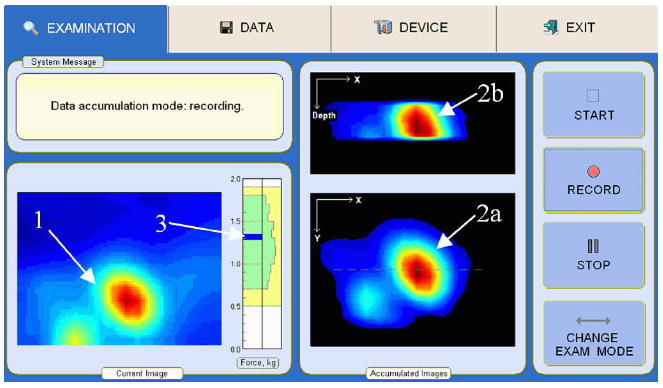
Breast examination interface for mode 1: (1) momentary pressure pattern of a lesion; (2a) real-time composed frontal and (2b) transversal cross-sections of the lesion; (3) indicator of total applied force to the probe and data collection.
B. Examination Procedure
The examination is performed on a patient in the lying position. The examination procedure includes two modes: mode 1—total breast examination to detect suspicious site and mode 2—local scan to characterize detected nodules (see Fig. 3). The breast examination in mode 1 is performed with the use of a lubricating gel. The BMI indicates detected abnormalities by generating visual and sound alert signals. After a suspicious site is detected, the device is switched to mode 2. The local scan in mode 2 is accomplished by two procedure variations: probe pressings against the breast over the detected abnormality, and circular motion of the probe with a lubricant (ultrasound gel). The examiner observes in real time accumulated cross-sectional images of a mass/lesion in orthogonal projections as shown in Fig. 2. The breast examination in mode 1 takes 1–2 min; a single local scan in mode 2 takes 20–40 s. Collected data with a geometrical localization of findings on a breast map are instantly saved in digital format. Three-dimensional image composition and features calculations are accomplished in real time.
Fig. 3.
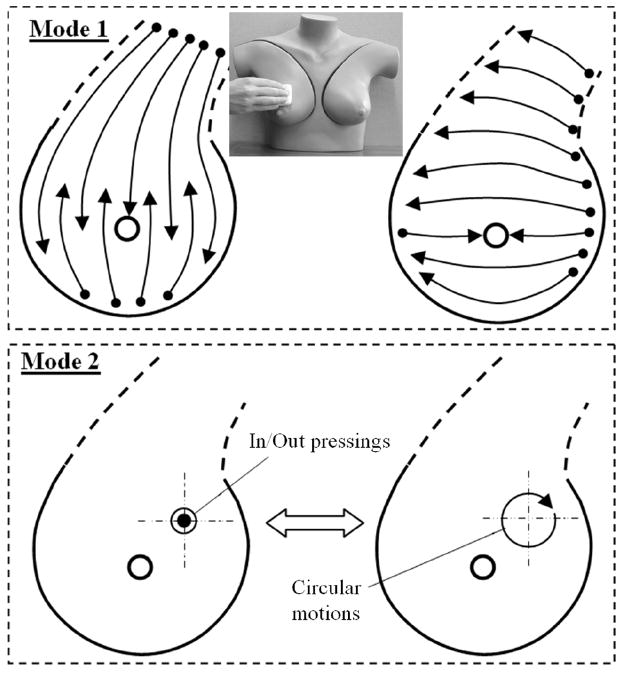
Procedure model for breast examination by the BMI. Mode 1 shows the total breast examination to detect suspicious sites by means of linear sliding motions. Mode 2 shows a local scan of a suspicious site by means of vertical up/down probe pressings and by means of circular motions with a lubricant.
Fig. 4 shows the device interface as the operator sees it after the completion of an examination. The operator may look through selected orthogonal slices of the underlying breast lesions by moving a slicebar under either the frontal (coronal) or transversal cross-sections images (two upper black windows). The examiner may select the levels for 3 iso-surfaces to visualize the abnormality’s internal features in 3-D representation. Two visualization modes are provided, so that the examiner may choose the absolute or normalized image representations as described in Section III-E. The main diagnostically relevant calculated parameters of the detected lesion: dimensions, the Young’s modulus, mobility relative to the surrounding tissue, surrounding tissue heterogeneity and hardness are represented in the upper left panel. All findings are translated automatically in a generated report ready for wireless printing.
Fig. 4.
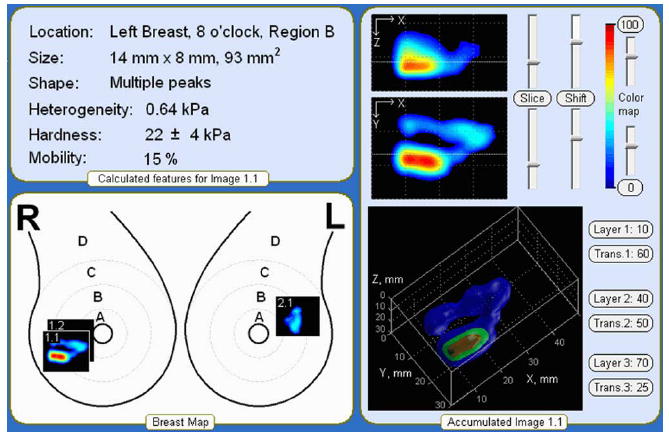
Representation of the breast examination results.
This enables physicians to see the differences in tissue elasticity in the color images in contrast to CBE that is “blind” and relies exclusively on the clinician’s subjective sense of touch. The BMI creates a hard copy of the examination results which can be placed into the patient’s file. This is advantageous for the physician on multiple fronts, as it gives the physician the ability to compare the patient’s examination results from year to year, and to get second opinions on the patient’s status in regards to the diagnosis.
III. Breast Data Processing and Imaging Algorithms
Table I provides a list and a brief description of basic algorithms of BMI data processing and analysis incorporated into the described imaging system. An expanded explanation of the algorithms is given below.
TABLE I.
Data Processing Algorithms
| Algorithm | Input | Procedure | Output | Purpose |
|---|---|---|---|---|
| Image filtration | Pressure sensor signal vs. time, raw pressure pattern | Temporal and 2-D spatial noise-removal filtering, signal threshold | Filtered image | To improve the signal/noise ratio.
To be used in image analysis. |
| Background/ skewing subtraction | Filtered image | The background is calculated as the second order surface based on perimeter sensors, 2-D interpolation | Image without background | To be used in 2-D/3-D image composition |
| Moving structure detection and evaluation | Images without background | Image sequence analysis to extract moving object | Moving object characterization | To be used in tissue abnormality detection, feature calculations |
| Extracting reference image | Sequence of filtered images | Calculation of reference lesion image | Lesion reference image | To be used in 2-D matching algorithm |
| 2-D matching and image integration | Image without background | Matching calculation, image superposition and integration | 2-D integrated image | To be used in 3-D image formation, feature calculations |
| 3-D image composition | 2-D integrated image | 3-D image superposition, 3-D image correction and smoothing | 3-D structure image | To be used in real time cross-section visualization, 3-D pictorial visualization, feature calculations |
| Feature extraction | Sequence of filtered images, reference image, 3-D image | Feature calculations | Calculated features | To be used in examination report, finding evaluation |
| Examination data quality evaluation | Row pressure pattern sequence | Data are tested by criteria set | Data quality classification | Data characterization.
To be used in training. |
A. Image Preprocessing
Image enhancement techniques are used to improve an image, where “improving” is defined either objectively (e.g., increased signal-to-noise ratio), or subjectively (e.g., making certain features easier to see by modifying the colors or intensities). Fig. 5 illustrates an image enhancement route using a recorded raw pressure pattern over the breast of a patient in the clinical study. The data from the pressure sensor arrays is preprocessed through the following procedures.
Fig. 5.
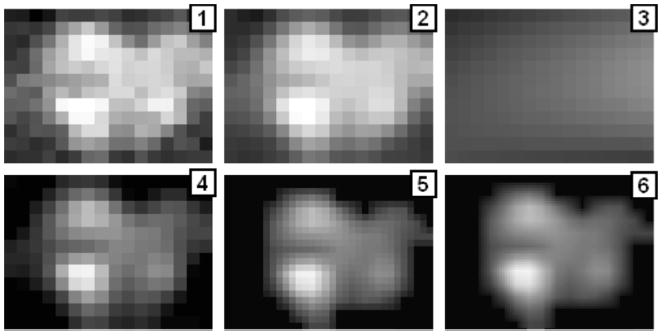
Illustration of the image processing sequence for a pressure pattern recorded during compression of the probe against the breast in vivo. (1) Raw pressure pattern. (2) After temporal and spatial filters. (3) Calculated background. (4) After background subtraction. (5) After thresholding, pixel-wise filter and interpolation. (6) After further interpolation.
-
Lowpass noise-cutting filtration, which is based on the calculation of the exponential moving average for each pressure sensor signal according to
(1) where st is the sensor signal at time t, St is the calculated exponential moving average value at time t, and α is the smoothing factor corresponding to the time constant of 0.3 s.
Two-dimensional noise-removal filtration, which includes three steps. The first step is thresholding negative sensor signals. The second step is edge smoothing by linear filtration (weighed averaging of 3 × 2 pixels/sensors along the pressure sensor array boundary). The third step is linear filtering of 3 × 3 pixels/sensors inside the frame. Application of all these procedures after the lowpass filtering is illustrated in Fig. 5, where panels (1) and (2) show single raw and filtered 2-D pressure patterns respectively.
Background/skewing subtraction algorithm, which includes calculation of the background image (Fig. 5, panel 3) and its subtraction. Result of this subtraction is shown in panel 4 of Fig. 5. The background is calculated as the second order surface using only the boundary sensors. This procedure provides image correction for the possible probe skewing relative to the surface of examined tissue.
Signal thresholding and 2-D interpolation, which are widely used techniques in image processing [47]. A parameter è called the “brightness threshold” is chosen and if the brightness/intensity for a pixel in the image is less than è, this pixel value is changed to zero. We used a fixed threshold of 0.25 kPa that was verified in phantom experiments.
Pixel neighborhood rating (Nr) based filtering, which calculates for each pixel its rating relative to the surrounding pixel intensities, has maximum weight of center and sided pixels of 1 with angle pixels of 0.6. If the neighborhood pixel rating is less than empirically predetermined value (Nr < 3.2), this pixel value is changed to zero.
For boundary pixels/sensors, additional downgrading coefficients are established because the boundary sensors are more subjected to artifacts and distortions.
Two-dimensional interpolation serves the purpose to prepare the image for following processing and analysis; segmentation and matching procedure are more effective if in the input we have an image of 32 × 24 pixels rather than 16 × 12. We used simple linear interpolation. The result of these procedures is shown in frame 5, Fig. 5. Further linear interpolation, shown in the panel 6 of Fig. 5, is used for better image perception.
B. Moving Object Detection
Mobility of lesions is an important diagnostically relevant feature. Assessing motion of lesions relative to a probe pressure sensing surface during probe manipulations is performed with the help of subtraction of background signal for each pressure sensor in the sequence of 2-D filtered images. In a sequence of images, a new reading Sj (ti) for sensor j in time ti is
| (2) |
where Sj (ti) is the current sensor signal; k = 15 defines the time tail of 0.75 s. After this procedure, the pixel neighborhood rating based filtering, convolution filtering and 2-D interpolation described above are applied to receive image sequence shown in line 4 of Fig. 6. This algorithm dramatically improves BMI sensitivity during the entire breast examination to detect suspicious breast sites during mode 1 examination (see Fig. 3).
Fig. 6.
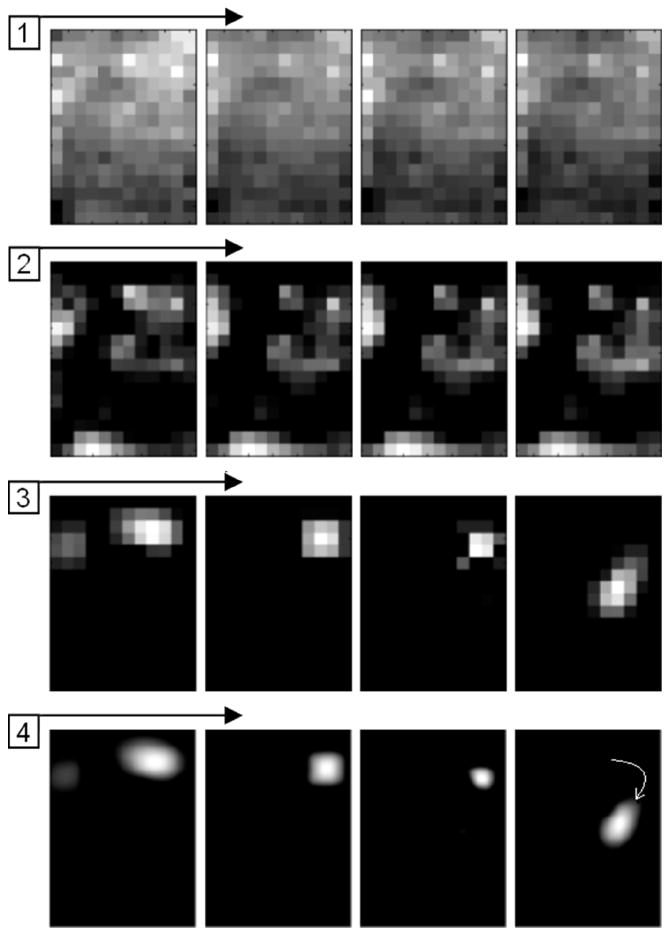
Illustration of a moving object detection algorithm for a pressure pattern recorded during the sliding of the probe over the breast in vivo. (1) Raw image sequence. (2) The same image sequence after noise-removal filter and background/skewing subtraction. (3) Image sequence processed by an algorithm accounting for the detection of a moving object. (4) Image sequence after filtration and interpolation.
C. Two-Dimensional Image Matching
An important aspect of the scanning mode of the examination and imaging is creation of a compound image using the sequence of successive images obtained along the scanning trajectory over the detected lesion. Specifically, after pressing the RECORD button on the examination tab (see Fig. 2), the first n-frames of pressure response data are captured to construct a starting image of a lesion. This capture of data is performed when the total force applied to the sensor array is within the operational range from 7 to 18 N, and acquired maximum signal from a detected lesion exceeds a predetermined detection threshold (2 kPa) above the background. This starting image is used as the first reference image. Each subsequent pressure response data frame is recorded and analyzed in order to add new pressure response information into the 2-D reference image. At the same time, a separate operational module runs a matching algorithm, which tries to find the best fit for the every imprint of the lesion within the 2-D reference image inside the spatial limits imposed by the probe head sensors possible displacement for 1/20 s. The best fit is calculated by maximizing a functional F
| (3) |
where k and l are quantities of horizontal and vertical pixels inside the analyzed pressure frame (32 × 24), n and m are image shift in pixels relative to a previous fitted pattern (within [−2, +2]), Si,j is pressure response signal of i, j pixels, and Pn+i+m+j is a pressure signal of n +i + m + j pixel inside 2-D reference image. Such a simple matching calculation procedure has been chosen because it requires relatively low computer resources in real time examination mode.
D. Three-Dimensional Image Reconstruction
There is a theoretical possibility of rigorous 3-D reconstruction of a complex soft tissue structure by solving the inverse problem for 2-D input patterns. Such an approach would require numerous assumptions and huge computational power which is far from being practical. We have developed an alternative semi-empirical way of 3-D image formation, which is described below.
The input data for 3-D reconstruction comprises a continuous sequence of 2-D filtered images. The initial hypotheses enabling 3-D reconstruction are: 1) the higher the compression force, the greater the representation of deeper structures in the imprint image; 2) the total pressure is proportional to the tissue deformation in the Z-direction (normal to the probe surface); 3) probe angle deviations provide additional structure information which can be incorporated into the composed image. The 3-D image reconstruction technique is used only in mode 2 examination when at least 200 original images are recorded for a local breast scan (see Fig. 3). The sequence of raw images is subjected to the image enhancement procedures described in Section III-A. The 3-D reconstruction starts with the formation of an initial (seed) 3-D structure by stacking the series of 2-D structure images along Z-coordinate during first tissue compression. Every 2-D imprint is further integrated by a parallel translation inside the 3-D structure image where X, Y-coordinates are determined by matching algorithm described in Section III-C, and Z-coordinate (layer number) is calculated according to
| (4) |
where A = 1.04 * 10−5 and B = −5 are empirical constants, k and l are quantities of horizontal and vertical pixels inside the pressure response frame with the analyzed lesion pattern, and Si,j is the current pressure signal of i,j-pixels expressed in Pa. After the best fit is found, each image pixel is placed into the 3-D composite image with a weight factor we = 0.1 if its current value exceeds respective pixel value inside the 3-D composite image, and with factor wd = 0.005 if its current value is below that respective pixel value. Next, the reference image is taken from the composed 3-D image according to the value of Z-coordinate calculated from (4). This procedure has good convergence and allows finding a position for each subsequent 2-D imprint image if an operator does not lose the structure image during the local examination in mode 2, or does not skew the probe by more than what is prescribed by examination technique.
After the local breast examination is complete, a final smoothing and 3-D interpolation is applied to the constructed structures. The final 3-D structure visualization is deployed by the computation of iso-surfaces and 2-D image slices for the 3-D pressure field, which is related to the hardness distribution of the underlying structure. The ability of this approach to reproduce the underlying tissue structures was demonstrated on a variety of phantom models.
E. Lesion Feature Calculation
Geometrical characteristics of the detected lesions are calculated with the use of all 2-D images carrying information about underlying lesion. Lesion shape and edges are evaluated directly from the final 3-D composed image. A lesion strain hardening is evaluated from a loading curve recorded during probe pressings against the tissue. Lesion mobility is estimated as an ability to change lesion shape and position under applied stress by the BMI probe.
Dimension and hardness of the detected mass/lesion are calculated in terms of both the lesion linear measures Lx, Ly in orthogonal X, Y-coordinates, a cross-section area Axy, and Young’s modulus E. For this purpose 2-D image P (x,y,Zm) which is just the layer Zm inside 3-D image including the detected lesion is analyzed to calculate closed surface area according to
| (5) |
| (6) |
where Ph is a binary lesion image, m is the layer number, Th is a threshold. We found [48] that two thresholds are of practical importance: 1) fixed Th1 = 4 kPa, and 2) relative Th2 = 0.5 * max{P (x,y,Zm)} for medium Z-layer. For Th1 and for Th2 we have accordingly Axy1 and Axy2. Further, as a value related to the lesion hardness we calculate a slope SA for
| (7) |
where M(Zi) is maximum value inside the layer Zi of 3-D image.
In such a manner, we have two pairs of functions (SA, Axy1) and (SA, Axy2), which are associated with the lesion hardness E and cross-sectional area A. In other words, each pair of (E, A) defines (SA, Axy1) and (SA, Axy2); and vice verse. It seemed possible to construct directly defined functions f1, f2, f3 such as
| (8) |
| (9) |
herein a projected to E, A-plane an intersection of two lines produced by conditions
| (10) |
allows for unambiguously localization of the intersection which specifies E and A values. In some zones, these lines are passing close to each other, being almost parallel. When it happens, analysis of intersection line for the second pair
| (11) |
provides calculation of E, A values with better accuracy. That way, we can analyze the intersection angle for both pairs and calculate average E, A values with weight factors being proportional to the angle in the range from 0° to 90°. Calculated in this manner, lesion cross-sectional area A can be translated into the linear measures Lx, Ly in orthogonal X, Y-coordinates.
Lesion strain hardening, expressed in relative units, is calculated as the second-order coefficient H in the expression
| (12) |
where i is a layer number in the 3-D image, M (Zi) is calculated according to (7), SA is the linear coefficient, and c is a constant. This simple procedure provides more robust H-values than a conventional approach to calculating the strain hardening factor as a ratio of loading curve slopes for different layers.
The evaluation of surrounding tissue hardness is based on the fact that the pressure profile along the curved pressure sensing surface of the BMI probe depends on Young’s modulus of surrounding tissue. While presence of a lesion/mass affects the fine structure of the 2-D pressure profile (as a rule in the center zone of the 2-D image), its peripheral region is defined mainly by two other factors: the thickness of the compressed surrounding tissue and its average elasticity. It appeared that the sensitivity of pressure profile to average tissue firmness exceeds that with respect to the thickness of the breast tissue [50]. Due to that fact, the following linear expression for the breast tissue hardness evaluation is an acceptable approximation for practical purposes:
| (13) |
where E0 is Young’s modulus of surrounding tissue; Pc and Ps are pressure values at characteristic locations at the edges of the sensor array; and a, b are constants. The value of E0 is calculated as an averaged value from all examination data frames with minimal skewing and total force between 8 N and 15 N, excluding signals from detected lesions.
The shape of the lesion is evaluated directly from the P(x,y,Zm), calculating its absolute maximum Pmax and the number of additional local maxima satisfying the following criteria of spatial separation: 1) the distance from the closest maxima is more than 4 mm; 2) a straight line connecting two neighboring maxima has a minimum which is below 0.95 of the smaller maximum; 3) a local maximum that exceeds 0.25 * Pmax. For practical purposes, we have chosen the following classification for the lesion shape: single peak, peak with a satellite, and multiple peaks, if at least three local maxima are detected.
Heterogeneity of breast tissue Hg outside the lesion is evaluated as an averaged value of Hg(t) through the examination time t for all pressure patterns
| (14) |
where S (x,y,t) is momentary pressure response of sensor with x, y-coordinates, Bckg is a background pressure pattern calculated as a second-order surface.
Mobility of the lesion Mbaver is evaluated as an averaged value of Mb(t) through the examination time for t all pressure patterns containing the lesion image
| (15) |
| (16) |
where Ph is the accumulated 3-D binary lesion image, Th is the threshold of binarization, Sh(x,y,t) is a binary image of a momentary lesion image to be placed/compared with Z-layer, S(x,y,t) is momentary pressure response of sensor with x, y-coordinates at time t. Before the use of (15) and (16), image Sh(x,y,t) is matched with the accumulated image Pz(x,y) according to (3). The sense of the Mbaver value, expressed in percentage, is the characterization of capability of the lesion to change its form and position under applied mechanical indentation by the probe with curved surface.
Lesion edge evaluation, expressed in percents, is based on the comparison of the calculated lesion boundary length with the boundary length of an ideal spherical lesion.
F. Neural Network for Automated Lesion Detection
We have designed a three-layer feed forward neural network for automated lesion detection using the MATLAB Neural Network Toolbox v.4.0.2. The neural network was composed of 10 input neurons in the first layer, three neurons in the second layer, and one in the 3rd output layer, and log-sigmoid transfer functions. The MATLAB toolbox includes a graphical user interface for creating, managing, training and implementing neural network architecture. For the purpose of this research, data of 90 local BMI scans performed by 5 different people in mode 2 (circular motions) were collected. The BMI scans were performed on a specially designed tissue model [49] containing an array of spherical inclusions [see Fig. 8(a)]. Sixty-five of the scans were performed over inclusion of various diameter (6–14.5 mm) and depth (7.5–35 mm), and 25 scans were performed over a homogeneous phantom with no inclusion. Ten selected image features related to tissue heterogeneity and the presence of moving substructure in the sequence of images have been used as network inputs in a supervised training procedure using a steepest descent algorithm [50]. The input features were: 1) average pressure, 2) average pressure standard deviation (STD), 3) trajectory step, 4) trajectory step STD, 5) maximum pressure, 6) maximum pressure STD, 7) size of a signal surface (above predetermined threshold), 8) signal surface STD, 9) average signal from lesion, and 10) average signal STD. We used MATLAB’s default threshold value for the single output node of the neural network.
Fig. 8.
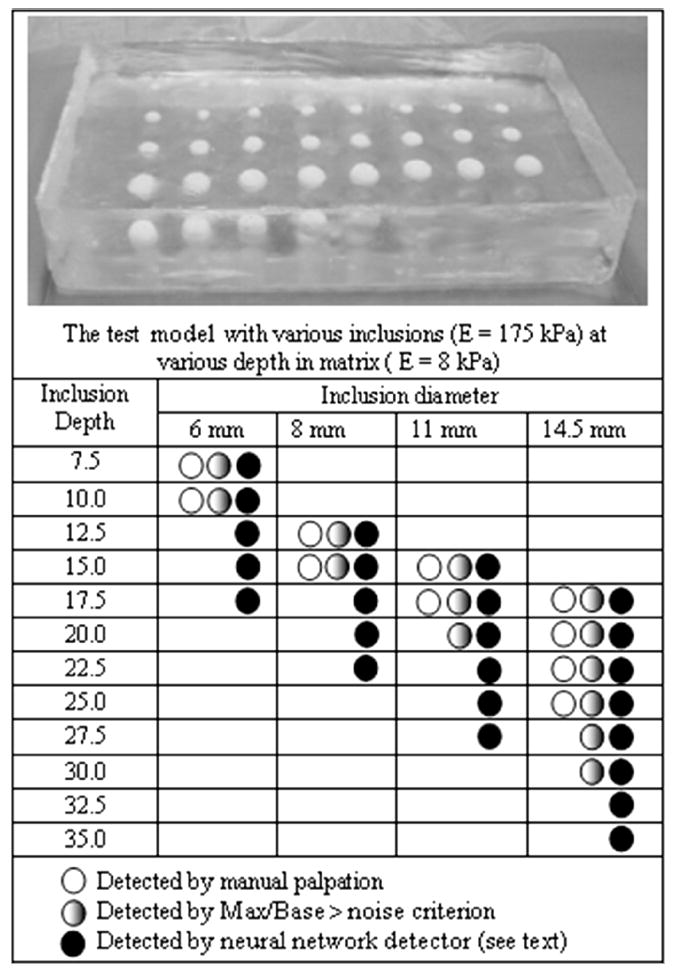
Parametric study results of the detection capability for manual palpation versus mechanical imaging with the use of the BMI probe (see text).
IV. Results of Laboratory and Clinical Studies
A. Tissue Phantom Experiments: Detection Capability
Since the MI technology is based on quantitative assessment of the stress pattern on the surface of examined object, it is important to explore the possible role of the boundary conditions at the interface between the sensor array and the object. Fig. 7 shows the results of BMI measurements on a tissue phantom with and without a lubricating gel as is used in ultrasonography. The curves show relative amplitude of the pressure peak resulting from the presence of a hard inclusion in the phantom as a function of the inclusion diameter at two levels of loading. The tissue model has been fabricated from two component silicone [49], with the inclusion and base material Young’s modulus of 110 and 5 kPa, respectively, inclusion depth of 6 mm, and phantom thickness of 30 mm. The vertical bar at the experimental points in Fig. 7 denotes the standard deviation calculated for five repeated scans. Each scan consists of three up/down pressings with about 150 pressure frames in the range from 8 to 18 N. Pressure frames with the force from 11.5 to 12.5 N were averaged to calculate a parameter, “Max/Base ratio,” which equals to the maximum pressure signal from inclusion divided by a base signal level from surrounding tissue. The same way, we calculated Max/Base ratio for pressure frames with the force from 15.5 to 16.5 N. This Max/Base ratio characterizes the relative amplitude of the pressure signal from the inclusion and may serve as a measure of the sensitivity of the technique in lesion detection. It is clearly seen that the presence of gel significantly improves the sensitivity of the method.
Fig. 7.
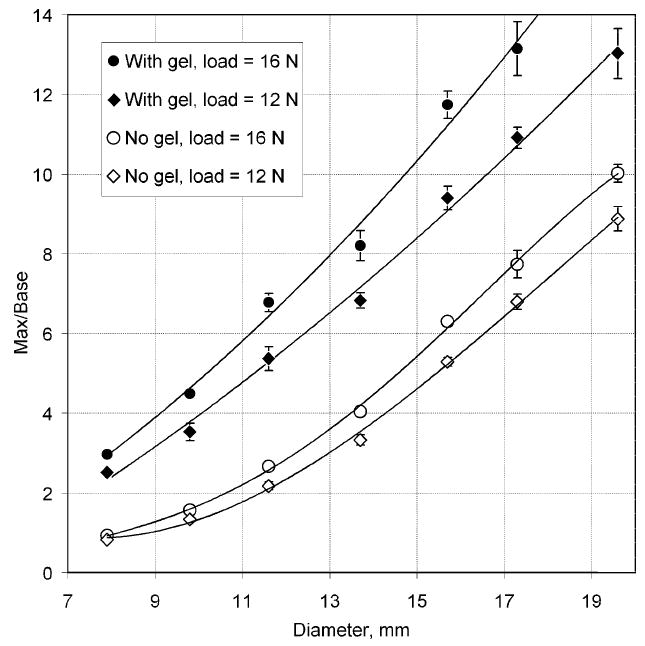
Dependence of the relative strength of the inclusion signal versus the inclusion diameter.
The threshold for inclusions detection of the BMI has been explored in experiments with a specially designed model shown in the upper panel of Fig. 8. This model was made of a silicone composite having Young’s modulus, E, of 8 kPa with an array of hard spherical inclusions (E = 175 kPa) embedded at different depth in the model. The thickness of the model was 50 mm. The table in Fig. 8 shows the inclusion parameters (depth and diameter) and represents the results of averaged manual detection limit by three persons and the results of BMI detection study which are subdivided into two categories: 1) detection based on evaluating the Max/Base ratio (detection threshold = 0.04) and 2) using the neural network detection described in Section II-F. The experiments were conducted with the use of the lubricating gel.
B. Tissue Phantom Experiments: 3-D Image Composition
Fig. 9 shows one of the phantoms with complex inclusion (A), a subsequence of recorded 2-D images of the inclusion (B), and corresponding results of the 3-D image formation (C). The input data for 3-D reconstruction were collected as a continuous sequence of 2-D pressure response images during BMI probe circular motions above the embedded complex inclusion shown in Fig. 9(a). This test phantom had three inclusions (E = 125 kPa) at various depth in a matrix with Young’s modulus E = 8 kPa. The sequence of images obtained at different positions was first subjected to the image enhancement procedures described above in Section II-A. The applied 3-D image reconstruction algorithm is described in SectionII-D.
Fig. 9.
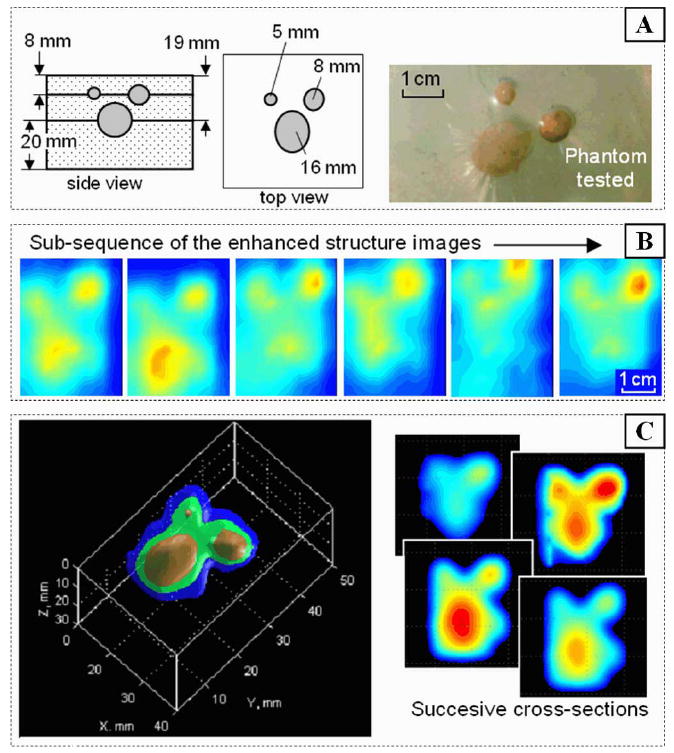
Three-dimensional image reconstruction (C) from a 2-D image sequence (B) recorded in the process of circular oscillation of the BMI probe over the embedded structure (A) tissue phantom.
C. Tissue Phantom Experiments: Mode 1 Examination
Realistic breast tissue phantoms shown in Fig. 10 with embedded hard nodules have been fabricated from two component silicone gels SEMICOSIL (Wacker Silicon Corporation, Adrian, MI), according to the technique described earlier [49], [51]. The illustrations in Fig. 10 represent the result of application of Mode 1 breast examination (see upper panel in Fig. 3) to one of the breast phantoms with base material Young’s modulus E = 6 kPa and inclusion hardness E = 75 kPa. The BMI probe trajectory has been reconstructed after a single probe passing over the phantom with the gel to facilitate this procedure as shown in Fig. 10. Calculation of the frame-to-frame displacement was evaluated on the base 2-D correlation function between two sequential pressure patterns according to (3). Inclusion detector analyzes tissue heterogeneity, local Max/Base distribution and moving object characteristics to reveal suspicious sites for detailed examination in Mode 2.
Fig. 10.
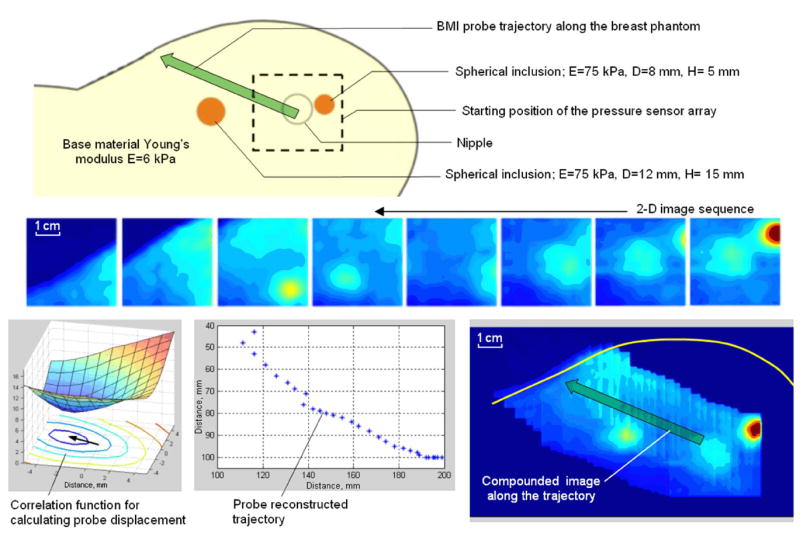
Algorithm for image compounding along the BMI probe trajectory.
D. Tissue Phantom Experiments: Mode 2 Examination
Laboratory testing on the breast phantoms demonstrated that just three successive pressings of the probe against the phantom are sufficient to provide a clear integrated image of the underlying structure/inclusion and sufficient to allow reproducible features calculation in the accordance with algorithms described in Section II. Table II presents a comparison of geometrical and elasticity parameters of phantoms evaluated by BMI with the actual values obtained by direct measurements. The phantom thickness measured 30 mm, inclusions were placed 11 mm below the upper surface of the phantoms. The Young’s modulus, E, of the base material of the phantom was 5 kPa; and skin has been modeled by 1 mm surface layer with E = 10 kPa.
TABLE II.
Evaluation of the BMI Performance on Models With Spherical Inclusions of Different Size and Elasticity. The 35-mm-Thick Models Were Made of Base Material Having the Young’s Modulus of 5 kPa With Spherical Inclusions Located at 10 mm Depth
| Known Evaluated | Inclusion 1
D = 5 mm E = 20 kPa |
Inclusion 2
D = 5 mm E = 80 kPa |
Inclusion 3
D = 10 mm E = l0 kPa |
Inclusion 4
D = 10 mm E = 40 kPa |
Inclusion 5
D = 14 mm E = 40 kPa |
Inclusion 6
D = 14 mm E = 156 kPa |
Inclusion 7
D = 18 mm E = 20 kPa |
Inclusion 8
D = 18 mm E = 80 kPa |
Typical relative error, % |
|---|---|---|---|---|---|---|---|---|---|
| Diameter, mm | 5.0 | 5.3 | 7.7 | 9.0 | 14.6 | 13.1 | 17.0 | 17.2 | 5 |
| Inclusion Young’s modulus. kPa | 20 | 80 | 10 | 42 | 41 | 128 | 20 | 78 | 10 |
| Young’s modulus of the base material, kPa | 4.8 | 4.9 | 5.0 | 5.0 | 5.6 | 5.2 | 5.9 | 6.5 | 19 |
| Heterogeneity of the model body, kPa | 0.01 | 0.08 | 0.06 | 0.23 | 0.35 | 0.28 | 0.58 | 0.50 | 10 |
E. Tissue Phantom Experiments: Measurement Accuracy as a Function of the Inclusion Depth
Fig. 11 represents inclusion depth influence on the Young’s modulus and cross-section area calculations. The phantoms had an inclusion with diameter of 10 mm, Young’s modulus of 80 kPa, total phantom thickness of 35 mm, and the base material Young’s modulus of 5 kPa. The inclusions were placed 6, 11, and 16 mm below the upper surface of the phantoms. Calculated features are the result of five repeated scans above the same inclusion.
Fig. 11.
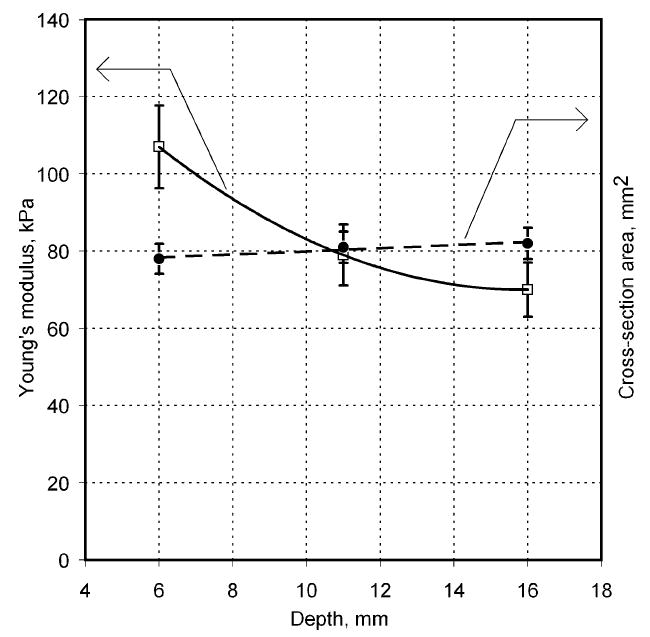
Inclusion depth influence on the Young’s modulus and cross-sectional area calculations. Inclusion diameter of 10 mm, Young’s modulus of 80 kPa, phantom thickness of 35 mm, and base material Young’s modulus of 5 kPa.
F. Clinical Results
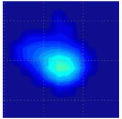
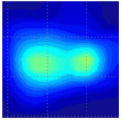
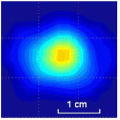
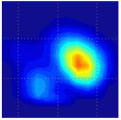
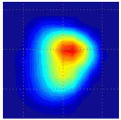
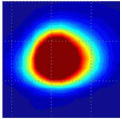
Clinical studies of the BMI are currently conducted in several hospitals and detailed results of these studies will be published elsewhere [52], [53]. Here, in Table III, we present just a few examples of typical results obtained by BMI in the ongoing clinical studies conducted at the Cancer Institute of New Jersey and The Breast Care Centers of New York and Pennsylvania. Eligible participants were informed about the nature of the investigation and signed an informed consent form. Upon patient’s consent, relevant clinical and demographical data were recorded. All patients presented with a lesion that was initially detected by another modality (mammography, ultrasound, or manual palpation). When performing the scans, the operator already knew where the lesions were located. Table III shows several calculated tissue features and compounded 2-D cross-sectional images of the examined breast lesions.
TABLE III.
Clinical Data for Six Patients
| Evaluated feature | Patient’s number | |||||
|---|---|---|---|---|---|---|
| 1 | 2 | 3 | 4 | 5 | 6 | |
|
| ||||||
| Lesion cross-sectional image |
|
|
|
|
|
|
| Lesion dimensions, mm | 10 × 8 | 18 × 11 | 16 × 13 | 10 × 9 | 14 × 16 | 17 × 14 |
| Lesion cross-section area, mm2 | 78 | 180 | 170 | 74 | 206 | 171 |
| Lesion Young’s modulus, kPa | 50 | 25 | 108 | 75 | 68 | 123 |
| Lesion mobility, % | 21 | 19 | 7 | 17 | 12 | 8 |
| Lesion shape | Single peak | Mult. peak | Single peak | Mult. peak | Single peak | Single peak |
| Young’s modulus of bulk tissue, kPa | 6.7 | 7.0 | 5.7 | 5.6 | 6.9 | 9.5 |
| Heterogeneity of the bulk tissue, kPa | 0.30 | 0.05 | 0.71 | 0.44 | 0.41 | 0.56 |
| Lesion size measured by ultrasound, mm | 21 | 15 | 20 | 12 × 8 | 20 × 20 | 22 × 11 |
| Patient age, years | 74 | 17 | 19 | 60 | 62 | 52 |
| Biopsy | Benign fibrostic tissue | Benign nodular adenosis | Fibroadenoma | Adenocarcinoma | Ductal carcinoma | Ductal carcinoma |
V. Discussion
As illustrated in Fig. 7, the ability of the BMI to detect inclusions is greatly facilitated by using a lubricating gel such as the one used in ultrasonic examination. Presence of a gel layer eliminates lateral stress on the surface of the model during probe motion. In the absence of the gel, the slippage of the probe is hindered and the examined object is subjected to lateral stresses. The data in Fig. 7 shows the use of the lubricant results in a three-fold increase in sensitivity for the detection of small inclusions with the diameter of less than 10–11 mm. The improvement in sensitivity due to gel usage is less for larger inclusions: about 1.5 times for the inclusion diameter of 20 mm. These results are consistent with a known fact that a lubricant increases sensitivity of manual breast self-palpation [55]. All further laboratory experiments as well as clinical studies with the use of the BMI were conducted with the use of a lubricating gel (7G2401, Medical Tactile, Inc., Los Angeles, CA).
Comparison of the thresholds for detection of hard inclusions by manual palpation and by BMI examination is presented in Fig. 8. The detection sensitivity by the BMI with use of the neural network detector is greatly superior to that of palpation. For example, at inclusion depth of 17.5 mm from the surface, the human finger feels only 14.5 mm and larger inclusions, while the BMI detects an inclusion of 6 mm in diameter. The 6 mm inclusion which is detected by the BMI at a 17.5 mm depth is detected manually only at a 10 mm depth. The nodules that are nearly half the size at a given depth or nearly twice deeper for a given size are detected with the use of the neural network classifier for the BMI, in comparison with manual palpation. Even by a simple assessment of the Max/Base ratio of the stress pattern, without any sophisticated analysis and the use of artificial intelligence, the BMI provides a better detection capability than a human finger for the inclusions of 11 mm diameter or greater.
The 3-D image reconstruction algorithm of inclusions, described in Sections III-C and III-D, is based on the use of a sequence of 2-D stress patterns obtained at different levels of tissue compression and Z-coordinate (normal to the breast surface) calculated according to (4). The highest inaccuracy in the evaluation of the inclusion geometry is in Z-coordinate, since relating the integral pressure to the compression of the tissue is based on numerous assumptions that have not been well justified.
Table II presents a comparison of the phantom parameters evaluated by the BMI with the actual values. The accuracy of the geometrical and elasticity parameter assessment is on the order of 20% and better. Since the main motivation for creating the BMI and other elasticity imaging devices was to use elasticity data to differentiate normal and diseased tissues, it is important to define what a sufficient accuracy range of Young’s modulus measurements would be. A rough estimate of the required accuracy can be made by using data on the range of elasticity modulus of tissues in normal and pathological conditions. Most normal soft tissues have Young’s modulus on the order of 10 kPa, while the Young’s modulus of some “rock-hard” cancerous tumors can reach 1 MPa [33]. Thus, tissue elasticity can vary in a range up to 10,000% of the normal value. Let us then assume that the efficient use of the elasticity modulus as a parameter for tissue characterization and discrimination requires a resolution taken as 1% of the entire variation range of said parameter. This means that even with a Young’s modulus measurement error of 100%, we will be able to satisfy this resolution requirement. Another criterion for evaluating the required accuracy of Young’s modulus measurements is related to the range of mechanical heterogeneity of normal tissue. Our experimental data showed that the elasticity modulus measured along a strip of tissue may vary up to 40% [55]. Obviously, the measurement of a parameter with much higher accuracy than the range of normal variability of this parameter will hardly provide additional useful information. It can thus be concluded that the accuracy of the BMI in evaluating the Young’s modulus of soft tissues within 20%–30% may be sufficient for tissue differentiation.
As can be seen in Fig. 11, the cross-section area of the inclusion does not practically depends on its depth (see black points and right vertical coordinate), and we have up to 19% overestimated Young’s modulus by lifting the inclusion closer to the surface from 11 to 6 mm. In the light of the above stated reasons we do not expect any clinical implications from this effect.
Results of preliminary clinical studies illustrated in Section IV-F demonstrate both the advantages and limitations of the technology. The lesion linear sizes evaluated by BMI as shown in Table III are smaller by 10%–50% than the lesion sizes evaluated by conventional ultrasound. Patient 2 has a BMI evaluated lesion size of 18 mm that includes the lesion with a satellite mass having increased hardness as it might be seen on the 2-D image; ultrasound evaluated lesion size of 15 mm characterizes only one left lesion. This indicates that the patient 2 lesion size data follow the tendency seen also with the other five patients: BMI provides decreased lesion sizes relative to the ultrasound measured ones. This question about lesion size discrepancy evaluated by both methods requires further analysis with the use wider clinical data from the ongoing clinical study.
Malignant breast lesions of the patients 4, 5, and 6 (histologically confirmed) had:
increased Young’s modulus (68, 75, and 123 kPa), compared to benign lesions (25 kPa and 50 kPa, patient 1 and 2);
increased heterogeneity of the surrounding tissue (0.44, 0.41, and 0.56 kPa), compared to the tissue of the patients with benign lesions (0.30 and 0.05 kPa);
decreased mobility compared to benign lesions of patients 1 and 2.
The breast lesion of the patient 3 (histologically confirmed fibroadenoma) had:
increased Young’s modulus (108 kPa), compared to benign lesions (25 and 50 kPa, patient 1 and 2);
increased heterogeneity of the surrounding tissue (0.71 kPa) compared to the tissue of the patients with benign (0.30 and 0.05 kPa) and malignant lesions (0.41, 0.44, and 0.56 kPa);
decreased mobility compared to benign lesions of patients 1 and 2.
Full statistical analysis of the ongoing clinical study results is beyond the scope of this paper. Here, we may say that preliminary results are promising from the point of benign/malignant lesion discrimination [53]. The possibility of fibroadenoma and malignant lesion discrimination is now under investigation; more clinical data are needed for a statistically meaningful conclusion.
Among the limitations of the method we can list an inability to reliably palpate deep lesion in a big breast and difficulty in a lesion scan when the lesion is highly mobile in a very soft breast tissue. Both of these cases are relatively rare [52].
In general, the results of the ongoing clinical studies indicate that the BMI has the ability to reconstruct the mechanical/elasticity image of the lesion and quantitatively evaluate its diagnostically relevant features.
Until recently, most of the information gleaned from various elasticity imaging modalities was qualitative. Published findings characterized pathologies by their being some magnitude stiffer than the normal surrounding tissues. But during the last few years, a number of laboratories around the world clearly demonstrated that elasticity imaging has a significant potential for not only detecting but also differentiating malignant and benign lesions with the sensitivity and specificity of up to 100% [56], [57]. Obviously, complex and expensive MR and Ultrasonic Imaging devices have numerous advantages over MI, such as higher spatial resolution and the possibility to examine deep laying tissues in a great variety of organs. On the other hand, the advantages of Mechanical Imaging devices include inherent low cost, ease-of-use, portability, and minimal training required [58]. The BMI has potential to become a home-use self-palpation device, which can be made compact, wireless, and capable of translating examination data via Internet to a central database for subsequent clinical investigation of detected abnormalities.
VI. Conclusion
MI technology provides documented 3-D images of the breast lesions with a quantitative evaluation of diagnostically relevant features of the lesion, such as size, shape, hardness, heterogeneity, and mobility. The BMI is superior to the CBE, one of the current means for breast cancer screening according to the guidelines of American Cancer Society. The BMI has a potential to be positioned as an adjunct to mammography and a pre-screening device for breast cancer detection.
Acknowledgments
The authors would like to thank T. J. Kearney, M.D. of the Cancer Institute of New Jersey, S. B. Pollak, M.D. of Mercy Medical Center of New York, and C. Rohatgi, M.D. of The Breast Care Center of Pennsylvania for their assistance in the ongoing clinical study. The authors would also like to thank S. Kanilo, Ph.D., Senior Programmer of Artann Laboratories for the development and implementation of a core data acquisition and data management engine for the BMI software and S. Ayrapetyan, M.D., Vice President for clinical research and general management of Artann Laboratories, for helping in clinical data analysis.
This work was supported in part by National Institute of Health (NIH) under SBIR Grant CA094444 “Use of a Tactile Breast Imager for Mass Prescreening” and Grant CA091392 “Imaging Network for Breast Cancer Mass Screening.”
Contributor Information
Vladimir Egorov, Artann Laboratories, Inc., 1459 Lower Ferry Road, Trenton, NJ 08618 USA (e-mail: vegorov@artannlabs.com).
Armen P. Sarvazyan, Artann Laboratories, Inc., Trenton, NJ 08618 USA.
References
- 1.Cancer facts & figures 2007. Amer. Cancer. Soc.; Atlanta, GA: p. 6. [Google Scholar]
- 2.Breast cancer facts & figures 2005–2006. Amer. Cancer. Soc.; Atlanta, GA: pp. 1–32. [Google Scholar]
- 3.Berry DA, et al. Effect of screening and adjuvant therapy on mortality from breast Cancer; Cancer intervention and surveillance modeling network (CISNET) collaborators. New Eng J Med. 2005;353:1784–1792. doi: 10.1056/NEJMoa050518. [DOI] [PubMed] [Google Scholar]
- 4.Bevers TB. National Comprehensive Cancer Network, Clinical Practice Guidelines in Oncology. 1. Fort Washington, PA: NCCN; 2006. Breast cancer screening and diagnosis guidelines; pp. 1–38. [Google Scholar]
- 5.Pisano ED, et al. Diagnostic performance of digital versus film mammography for breast-cancer screening. N Engl J Med. 2005;353(17):1773–1883. doi: 10.1056/NEJMoa052911. [DOI] [PubMed] [Google Scholar]
- 6.Altmann A, Hellerhoff K, Heywang-Köbrunner SH. Screening in women with increased breast cancer risk. Breast Care. 2006;1:22–25. [Google Scholar]
- 7.Padhani AR, Ah-See ML, Makris A. MRI in the detection and management of breast cancer. Expert Rev Anticancer Ther. 2005;5(2):239–52. doi: 10.1586/14737140.5.2.239. [DOI] [PubMed] [Google Scholar]
- 8.McDonald S, Saslow D, Alciati MH. Performance and reporting of clinical breast examination: A review of the literature. CA Cancer J Clin. 2004;54(6):345–361. doi: 10.3322/canjclin.54.6.345. [DOI] [PubMed] [Google Scholar]
- 9.Oestreicher N, et al. Predictors of sensitivity of clinical breast examination (CBE) Breast Cancer Res Treatment. 2002;76:73–81. doi: 10.1023/a:1020280623807. [DOI] [PubMed] [Google Scholar]
- 10.Bancej C, et al. Contribution of clinical breast examination to mammography screening in the early detection of breast cancer. J Med Screen. 2003;10:16–21. doi: 10.1258/096914103321610761. [DOI] [PubMed] [Google Scholar]
- 11.Saslow D, et al. Clinical breast examination: Practical recommendations for optimizing performance and reporting. CA Cancer J Clin. 2004;54(6):327–344. doi: 10.3322/canjclin.54.6.327. [DOI] [PubMed] [Google Scholar]
- 12.Barton MB, Harris R, Fletcher SW. Does this patient have breast cancer? The screening clinical breast examination: Should it be done? How? JAMA. 1999;282:1270–1280. doi: 10.1001/jama.282.13.1270. [DOI] [PubMed] [Google Scholar]
- 13.Bobo JK, Lee NC, Thames SF. Findings from 752,081 clinical breast examinations reported to a national screening program from 1995 through 1998. J Natl Cancer Inst. 2000;92:971–976. doi: 10.1093/jnci/92.12.971. [DOI] [PubMed] [Google Scholar]
- 14.Osteen R. Breast cancer. In: Lenhard RE, Osteen RT, Gansler T, editors. Clinical Oncology. Atlanta, GA: Amer. Cancer Soc.; 2001. pp. 251–268. [Google Scholar]
- 15.Sarvazyan AP. Mechanical imaging: A new technology for medical diagnostics. Int J Med Inf. 1998;49:195–216. doi: 10.1016/s1386-5056(98)00040-9. [DOI] [PubMed] [Google Scholar]
- 16.Ophir J, Cespedes I, Ponnekanti H, Yazdi Y, Li X. Elastography: A quantitative method for imaging the elasticity of biological tissues. Ultrason Imag. 1991;13:111–134. doi: 10.1177/016173469101300201. [DOI] [PubMed] [Google Scholar]
- 17.Skovoroda AR, Emelianov SY, Lubinski MA, Sarvazyan AP, Odonnell M. Theoretical-analysis and verification of ultrasound displacement and strain imaging. IEEE Trans Ultrason Ferroelect Freq Control. 1994 May;41(3):302–313. [Google Scholar]
- 18.Sarvazyan AP, et al. Biophysical bases of elasticity imaging. In: Jones JP, editor. Acoustical Imaging. Vol. 21. New York: Plenum; 1995. pp. 223–240. [Google Scholar]
- 19.Muthupillai R, et al. Magnetic-resonance elastography by direct visualization of propagating acoustic strain waves. Science. 1995;269:1854–1857. doi: 10.1126/science.7569924. [DOI] [PubMed] [Google Scholar]
- 20.Sarvazyan AP, Rudenko OV, Swanson SD, Fowlkes JB. Shear wave elasticity imaging: A new ultrasonic technology of medical diagnostics. Ultrasound Med Biol. 1998;24(9):1419–1435. doi: 10.1016/s0301-5629(98)00110-0. [DOI] [PubMed] [Google Scholar]
- 21.Plewes DB, Bishop J, Samani A, Sciarretta J. Visualization and quantification of breast cancer biomechanical properties with magnetic resonance elastography. Phys Med Biol. 2000;45:1591–1610. doi: 10.1088/0031-9155/45/6/314. [DOI] [PubMed] [Google Scholar]
- 22.Taylor LS, Porter BC, Rubens DJ, Parker KJ. Three-dimensional sonoelastography: Principles and practices. Phys Med Biol. 2000;45:1477–1494. doi: 10.1088/0031-9155/45/6/306. [DOI] [PubMed] [Google Scholar]
- 23.Manduca A, et al. Magnetic resonance elastography: Non-invasive mapping of tissue elasticity. Med Image Anal. 2001;5:237–254. doi: 10.1016/s1361-8415(00)00039-6. [DOI] [PubMed] [Google Scholar]
- 24.Nightingale K, Soo MS, Nightingale R, Trahey G. Acoustic radiation force impulse imaging: In vivo demonstration of clinical feasibility. Ultrasound Med Biol. 2002;28(2):227–235. doi: 10.1016/s0301-5629(01)00499-9. [DOI] [PubMed] [Google Scholar]
- 25.Greenleaf JF, Fatemi M, Insana M. Selected methods for imaging elastic properties of biological tissues. Annu Rev Biomed Eng. 2003;5:57–78. doi: 10.1146/annurev.bioeng.5.040202.121623. [DOI] [PubMed] [Google Scholar]
- 26.Washington CW, Miga MI. Modality independent elastography (MIE): A new approach to elasticity imaging. IEEE Trans Med Imag. 2004 Sep;23(9):1117–1128. doi: 10.1109/TMI.2004.830532. [DOI] [PubMed] [Google Scholar]
- 27.McCracken PJ, Manduca A, Felmlee J, Ehman RL. Mechanical transient-based magnetic resonance elastography. Magn Reson Med. 2005;53:628–639. doi: 10.1002/mrm.20388. [DOI] [PubMed] [Google Scholar]
- 28.Melodelima D, Bamber JC, Duck FA, Shipley JA, Xu L. Elastography for breast cancer diagnosis using radiation force: System development and performance evaluation. Ultrasound Med Biol. 2006;32(3):387–96. doi: 10.1016/j.ultrasmedbio.2005.12.003. [DOI] [PubMed] [Google Scholar]
- 29.Itoh A, et al. Breast disease: Clinical application of US elastography for diagnosis. Radiology. 2006;9(2):341–350. doi: 10.1148/radiol.2391041676. [DOI] [PubMed] [Google Scholar]
- 30.Xydeas T, et al. Magnetic resonance elastography of the breast: Correlation of signal intensity data with viscoelastic properties. Invest Radiol. 2005;40(7):412–420. doi: 10.1097/01.rli.0000166940.72971.4a. [DOI] [PubMed] [Google Scholar]
- 31.Bercoff J, et al. In vivo breast tumor detection using transient elastography. Ultrasound Med Biol. 2003;29(10):1387–1396. doi: 10.1016/s0301-5629(03)00978-5. [DOI] [PubMed] [Google Scholar]
- 32.Van Houten EE, Doyley MM, Kennedy FE, Weaver JB, Paulsen KDKD. Initial in vivo experience with steady-state subzone-based MR elastography of the human breast. J Magn Reson Imag. 2003;17(1):72–85. doi: 10.1002/jmri.10232. [DOI] [PubMed] [Google Scholar]
- 33.Sarvazyan AP. Elastic properties of soft tissues. In: Levy, Bass, Stern, editors. Handbook of Elastic Properties of Solids, Liquids and Gases. ch 5. III. New York: Academic; 2001. pp. 107–127. [Google Scholar]
- 34.Skovoroda AR, et al. Quantitative analysis of the mechanical characteristics of pathologically changed soft biological tissues. Biophsics. 1995;40(6):1359–1364. [PubMed] [Google Scholar]
- 35.Krouskop TA, Wheeler TM, Kallel F, Garra BS, Hall T. Elastic moduli of breast and prostate tissues under compression. Ultrason Imag. 1998;20(4):260–274. doi: 10.1177/016173469802000403. [DOI] [PubMed] [Google Scholar]
- 36.Sarvazyan AP. Computerized palpation is more sensitive than human finger. Proc 12th Int Symp Biomed Measure Instrum; Dubrovnik, Croatia. 1998. pp. 523–524. [Google Scholar]
- 37.Niemczyk P, et al. Mechanical imaging, a new technology for cancer detection. Surgical Forum. 1996;47:823–825. [Google Scholar]
- 38.Kearney TJ, Airapetian S, Sarvazyan A. Tactile breast imaging to increase the sensitivity of breast examination. J Clin Oncol. 2004;22S:103. [Google Scholar]
- 39.Wellman PS, Howe RG, Dewagan N, Cundari MA, Dalton E, Kern KA. Tactile imaging: A method for documentation breast masses. Proc 1st Joint BMES/EMBS Conf; 1999. pp. 1131–1132. [Google Scholar]
- 40.Wellman PS, Dalton EP, Krag D, Kern KA, Howe RD. Tactile imaging of breast masses: First clinical report. Arch Surg. 2001;136(2):204–208. doi: 10.1001/archsurg.136.2.204. [DOI] [PubMed] [Google Scholar]
- 41.Howe RD. Tactile sensing and control of robotic manipulation. J Adv Robot. 1994;8(3):245–261. [Google Scholar]
- 42.Wellman PS. Ph.D. dissertation. Div. Eng. Appl. Sci. Harvard. Univ.; Cambridge, MA: 1999. Tactile imaging. [Google Scholar]
- 43.Weber G. Undergraduate thesis engineering. Harvard Univ.; Cambridge, MA: 2000. Using tactile images to differentiate breast cancer types. [Google Scholar]
- 44.Pawluk DT, Son JS, Wellman PS, Peine WJ, Howe RD. A distributed pressure sensor for biomechanical measurements. ASME J Biomechan Eng. 1998;102(2):302–305. doi: 10.1115/1.2798317. [DOI] [PubMed] [Google Scholar]
- 45.Howe RD, Peine WJ, Kontarinis DA, Son JS. Remote palpation technology. IEEE Eng Med Biol Mag. 1995 May-Jun;14(3):318–323. [Google Scholar]
- 46.Pressure profile capacitive sensor design and data acquisition [Online]. Available: http://www.pressureprofile.com/tactArray.php
- 47.Gonzalez RC, Woods RE, Eddins SL. Digital Image Processing Using MATLAB. Englewood Cliffs, NJ: Prestince Hall; 2003. p. 782. [Google Scholar]
- 48.Egorov V, Kanilo S, Sarvazyan A. Breast tissue characterization by means of surface stress patterns analysis. Abstracts 32nd Int Symp Ultrasonic Imag Tissue Characterization; Arlington, VA. May 16–18, 2007; p. 45. [Google Scholar]
- 49.Egorov V, Airapetian S, Sarvazyan A. Tissue mimicking materials and phantoms. Proc 5th Int Conf Ultrasonic Measure Imag Tissue Elasticity; Snowbird, UT. Oct 8–11, 2006; p. 45. [Google Scholar]
- 50.Hagan MT, Demuth HB, Beale MH. Neural Network Design. Boston, MA: PWS; 1996. p. 736. [Google Scholar]
- 51.Sarvazyan T, Stolarsky V, Fishman V, Sarvazyan A. Development of mechanical models of breast and prostate with palpable nodules. Proc 20th Annu Int Conf IEEE Eng Med Biol; Hong Kong. 1998. pp. 736–73. [Google Scholar]
- 52.Egorov V, Ayrapetyan S, Pollak SB, Sarvazyan A. Breast lesion characterization and differentiation by mechanical imager: Preliminary clinical results. Proc 6th Int Conf Ultrason Measure Imag Tissue Elasticity; Santa Fe, NM. Nov. 2–5, 2007; p. 92. [Google Scholar]
- 53.Egorov V, Kearney TJ, Pollak SB, Rohatgi C, Sarvazyan N, Airapetian S, Browning S, Sarvazyan A. Differentiation of benign and malignant breast lesions by mechanical imaging. Breast J. doi: 10.1007/s10549-009-0369-2. submitted for publication. [DOI] [PMC free article] [PubMed] [Google Scholar]
- 54.Mayer JA. Assessing breast self-examination compliance in the natural environment. J Behav Med. 1986;9(4):363–371. doi: 10.1007/BF00845120. [DOI] [PubMed] [Google Scholar]
- 55.Egorov V, Tsyuryupa S, Kanilo S, Kogit M, Sarvazyan A. Tissue elastometer. Med Eng Phys. 2008;30(2):206–12. doi: 10.1016/j.medengphy.2007.02.007. [DOI] [PMC free article] [PubMed] [Google Scholar]
- 56.Zhang XF, Liu XM, Bao XF, Peng XJ, Zhang W, Xu J. Application of real-time tissue elastography in diagnosis of breast cancer. Zhejiang Da Xue Xue Bao Yi Xue Ban. 2006;35(4):444–447. doi: 10.3785/j.issn.1008-9292.2006.04.018. [DOI] [PubMed] [Google Scholar]
- 57.Barr RG. Clinical applications of a real time elastography technique in breast imaging. Proc 5th Int Conf Ultrason Measure Imag Tissue Elasticity; Snowbird, UT. Oct. 8–11, 2006; p. 112. [Google Scholar]
- 58.Kaufman CS, Jacobson L, Bachman B, Kaufman L. Digital documentation of the physical examination: Moving the clinical breast exam to the electronic medical record. Amer J Surg. 2006;192:444–449. doi: 10.1016/j.amjsurg.2006.06.006. [DOI] [PubMed] [Google Scholar]


