

Abstract
Purpose
Data are unavailable for rational selection of pulse sequences to assess post-infarction myocardial viability in rodents at high field strength. We implemented a widely used clinical inversion recovery (IR) sequence at 4.7T and compared the results to a heavily T1-weighted cine FLASH sequence (T1-CF) for assessment of infarction size.
Materials and Methods
Eleven infarcted rats were examined within 24 h of infarction after injection of Gadophrin-3 contrast agent. Images were acquired using both pulse sequences and a standard cine (SC) sequence. Estimates of infarct size were compared to TTC. Global LV function was compared between the T1-CF and SC sequences.
Results
SNR, relative SNR, and CNR for the infarcted and normal myocardium were significantly greater for the IR sequence. Infarction size was overestimated by both sequences, but correlated highly and showed very close agreement with TTC. Global function revealed no significant differences between T1-CF and SC.
Conclusion
Both IR and T1-CF produced reliable results for assessment of infarction size at 4.7T. While the IR sequence delivers better overall SNR and CNR, the T1-CF allows concomitant assessment of global cardiac function with a much shorter acquisition time.
Keywords: Heart, Experimental Studies, Infarction-MR, Comparative Studies-MR
Introduction
Cardiac magnetic resonance (CMR) is becoming an increasingly important tool in cardiovascular research involving small animal models (1–3). The same advantages of this noninvasive imaging modality that apply to its use in patients (eg, permitting serial assessment of myocardial function, viability and mass) translate to its use in research (4–6). The technique has been used in normal and diseased rodent models for the assessment of global and regional myocardial function, left ventricular mass, and acute and chronic myocardial infarction (MI) size (5, 7). The high spatial and temporal resolution needed to produce images of suitable quality makes this application of CMR very challenging. Most investigators use scanners that operate at 2.0–9.4 Tesla due to the inherently greater signal to noise ratio (SNR) associated with imaging at higher magnet field strengths. The same imaging protocols that gained wide recognition for assessment of cardiovascular disease in patients and large animal models have not easily translated to rodent imaging due to differences in physiological parameters (eg, elevated heart rates) and hardware. The extremely long T1 of myocardium at higher field strengths (∼1300 ms at 4.7T) and rapid rodent heart rates make the implementation of inversion recovery (IR) pulse sequences especially demanding. While fast, segmented k-space gradient-echo sequences preceded by an IR pulse have become the gold standard for the noninvasive assessment of infarction size in humans, its use has not been described in small animal models (8–10). Various authors have approached this issue by using an inversion recovery spin-echo or heavily T1 weighted images (5, 11, 12). However, because of the excellent SNR and contrast to noise ratio (CNR) that the IR pulse sequences offer in comparison to other approaches, its implementation and use in small animal imaging of MI warrants further investigation. Thus, the aim of this study was the implementation and validation of an IR pulse sequence on a 4.7T dedicated small animal scanner for the assessment of reperfused MI. We compared this sequence with a widely used heavily T1-weighted fast gradient echo sequence.
Methods
Animal model
All animal studies were approved by the local Institutional Animal Care and Use Committee (IACUC). Eleven Male Sprague-Dawley rats were used for the study (200–300 g). The rats were purchased from Charles River Laboratories, Inc., Wilmington, MA, and housed in the institutional research animal facilities. The rats were induced by intraperitoneal injection of ketamine/xylazine (50/2.5 mg/kg). Subsequently, they were intubated and ventilated with 1% isoflurane mixed with oxygen (Harvard Apparatus, Model 680, Holliston, MA, USA). After blunt dissection of the thoracic muscles the thoracic cavity was opened in the 4–5th intercostal space. The pericardium was removed, and the left anterior descending (LAD) coronary artery was then ligated by passing a piece of 7–0 silk suture around the vessel and the surrounding myocardium. Both ends of the ligature were threaded through a piece of polyethylene tubing to form a snare. Successful occlusion was confirmed by color change of the myocardium and significant ECG changes. The snare remained in place for 60–120 minutes after which LAD perfusion was restored by release of the snare and removal of the ligature.
CMR imaging and contrast agent injection
All MRI images were acquired within 24 h post MI on a 4.7 T horizontal small bore scanner (Varian, Palo Alto, CA, USA) with a maximum gradient strength of 25 gauss/cm and a rise time to full amplitude of 200 μs. A Varian transmit-receive whole body coil was used for signal transmission and reception. A series of coronal and sagittal gradient-echo (GRE) scout images was acquired to determine the long axis of the heart. An ECG-gated GRE-sequence (FLASH) was planned in the short axis orientation using the long axis images (Fig. 1b). Imaging parameters for this sequence were as follows: flip angle 20°, echo time (TE) 3 ms, FOV 5–6 cm, matrix 128 × 128, reconstructed to 256 × 256, slice thickness 1.5 mm. The TR was adjusted to fit 12 cardiac phases evenly into one RR-interval. One k-space line was acquired per cardiac phase/heartbeat. The data acquisition was averaged 4 times resulting in a duration of approximately 2 minutes per slice. Ten to 11 slices were typically required to span the entire LV. For assessment of infarction size the same sequence was repeated covering the infarcted area, but with an increased flip angle of 60° to account for more T1 weighting (T1-cine FLASH, T1-CF) (5).
Figure 1.
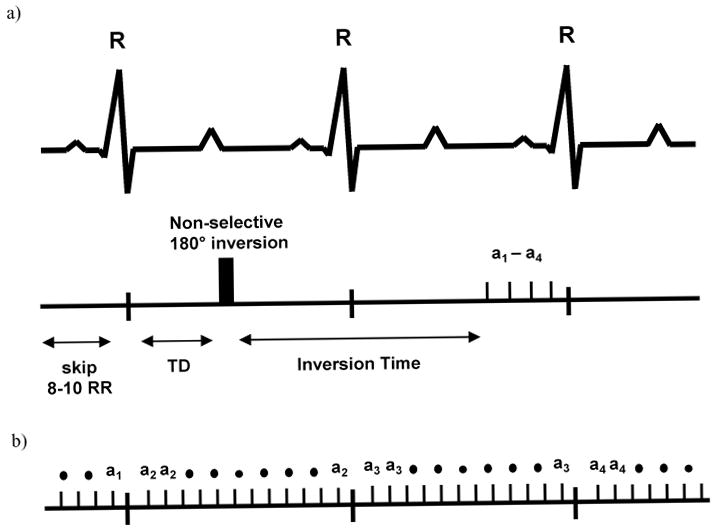
(a.) Timing of the IR-sequence, where 8–10 R-R intervals are skipped between each acquisition. Due to the animal's high heart rate, the readout occurs 1–2 heart beats after the inversion pulse. The imaging portion of the sequence consists of 4 phase encoding steps (a1–a4) timed to end diastole. (b.) The T1-CF sequence can be repeated for each heartbeat. Only one phase encoding step per cardiac phase is acquired during each R-R interval.
The IR sequence was implemented using an identical slice position. It consisted of a non slice-selective composite 90-180-90 inversion pulse followed by an inversion delay of 450–550 ms which was individually adapted to yield the best contrast between the nulled myocardium and the infarcted tissue. After the inversion time, a 15 degree excitation pulse was followed by 4 phase readouts (Fig. 1a). Using a TE of 3 ms and a TR of 6 ms the acquisition window was 24 ms. The FOV and resolution were chosen identical to the FLASH sequence. Six signal averages were used instead of 4 to yield sufficient signal. The imaging portion of the sequence was timed to end diastole to avoid motion artifacts. Depending on the animals' heart rate, a delay of 8–12 heartbeats was introduced between each acquisition to allow for sufficient recovery of the magnetization (longitudinal relaxation) between IR pulses. This resulted in an imaging time of about 10 minutes per slice.
We used the necrosis-specific porphyrin-based T1-enhancing gadolinium agent Gadophrin-3 (Schering AG, Berlin, Germany). Gadophrin-3 was injected into the tail vein (0.05 mmol/kg) 1 hour after reperfusion and at least 3 h prior to imaging (13, 14). During that time the contrast agent accumulates in infarcted myocardium and clears from the plasma. The use of a necrosis-specific contrast agent for this study was preferred for two reasons: (1) non-specific standard extracellular contrast agents (eg, Gd-DTPA) tend to overestimate or underestimate infarction size depending on the imaging time after injection. Given that Gadophrin binds to necrotic tissue, the contrast uptake pattern reflects the true extent of necrosis once the agent has cleared from the plasma and (2) since the enhancing area (after 3 h) is not influenced by altered wash-in/wash-out kinetics in the infarction and peri-infarction zone, the enhancing area remains stable over many hours. Any influence on the pulse sequence comparison due to differing distributions and concentrations of the contrast agent can therefore be excluded.
Image analysis
Global function and infarction size
The global myocardial functional parameters and infarction sizes were determined using a program available in the public domain, Image J. The LV epicardial and endocardial borders were manually traced on the end-diastolic (ED) image of each slice. Endocardial borders were also drawn on the end-systolic images (ES) so that both LV end-diastolic (EDV) and LV end-systolic (ESV) volumes could be obtained by multiplication of the slice areas by the slice thickness. Stroke volume (SV) and ejection fraction (EF) were calculated using the end diastolic (EDV) and end systolic (ESV) volumes (SV = EDV-ESV, EF = SV/EDV).
From the heavily T1-weighted cine FLASH gradient echo sequence (T1-CF) the end-diastolic phase was selected for analysis of MI. The images acquired using the IR sequence were timed to end diastole. Endo- and epicardial borders, as well as the hyperenhanced region, were then planimetered on the Gadophrin-enhanced images. An area was defined as hyperenhanced if the image intensity was greater than or equal to 2 SD above the mean of a normal region in the septum (8, 16). At each slice position, the areas of the enhanced and nonenhanced pixels were determined, and the size of the contrast-enhanced region was then expressed as a percentage of the total LV myocardial area.
Post Mortem TTC (Triphenyltetrazolium chloride)-staining
After sacrificing the animals their hearts were quickly removed from the thoracic cavity and perfused retrograde through a cannula inserted in the ascending aorta with 4 ml saline followed by 5 ml 1.5% TTC in PBS solution at 37°C. After freezing the hearts they were cut perpendicular to their long axis to approximately 1.5 mm thick slices and the right ventricles were removed. Subsequently the hearts were scanned on both sides using a flatbed scanner (Epson, Long Beach, CA). Images were post processed using Image J (http://rsb.info.nih.gov/ij/). The infarcted area (non stained pale/white region) was measured on both sides and averaged for each slice, and summed from all slices. The infarction size was expressed as the fraction of the infarcted region relative to the total area of the myocardium on all slices.
Relative SNR, SNR and CNR
For all calculations, regions of interest (ROIs) were drawn for each subject on two adjacent infarcted slices and then averaged. The noise was defined as the standard deviation (SD) of the signal of a region outside the body. Contours for ROIs were drawn around the enhancing myocardium (SIinf), the normal myocardium (SInorm), and the LV blood pool (SIblood) to calculate the respective mean signal intensities. The relative signal intensity was calculated as:
| [1] |
The signal to noise ratio (SNR) was defined as:
| [2] |
and the contrast noise ratio (CNR) was defined as:
| [3] |
and
| [4] |
Statistics
All data are presented as the mean ± standard deviation (SD). Global cardiac function, as assessed by the standard FLASH and the T1-CF sequence were compared by Student's t-test. In addition, a Bland-Altman analysis, shown as the mean of differences ±1 SD, was used to assess the limits of agreement between the sequences. SNR and CNR of the T1-CF sequence and the Inversion Recovery (IR) sequence were compared using Student's t-test. Linear regression analysis and Bland-Altman analysis were performed for comparison of the 60-degree with the IR sequence, as well as the TTC-results. A p value <.05 was considered statistically significant.
Results
All rats survived the surgical procedure and the scanning protocol at 1 day post-MI. Infarction sizes ranged from 1.2–33% of the LV myocardium, with an average of 18.4%. Of all rats completing the imaging protocol, 2 were excluded for the SNR and CNR measurements due to improper choice of inversion time. One rat was excluded for the comparison of infarction sizes because no TTC data was available.
Global function
End diastolic volume (EDV), end systolic volume (ESV), ejection fraction (EF), and left ventricular (LV) mass were calculated in a subgroup of 6 rats for comparison between the standard cine FLASH sequence and the 60-degree T1-CF sequence. There were no significant differences between the sequences for EDV (305.5 ± 74.4 μL for FLASH and 306.5 ± 69.4 μL for 60-degree FLASH), ESV (87.8 ± 19.4 μL and 86.4 ± 18.3), EF (69 ± 12% and 70 ± 11%), or LV mass (330 ± 44 mg and 342 ± 35 mg); p = NS for all. The Bland-Altman analysis revealed a very close agreement between both sequences as well (1.0 ± 9.6 for EDV, −1.4 ± 3 for ESV, 0.8 ± 9 for EF and 12.1 ± 21.6 for LV mass). Figures 5a, 5d, and 5g show typical short and long axis images at end diastole.
Figure 5.
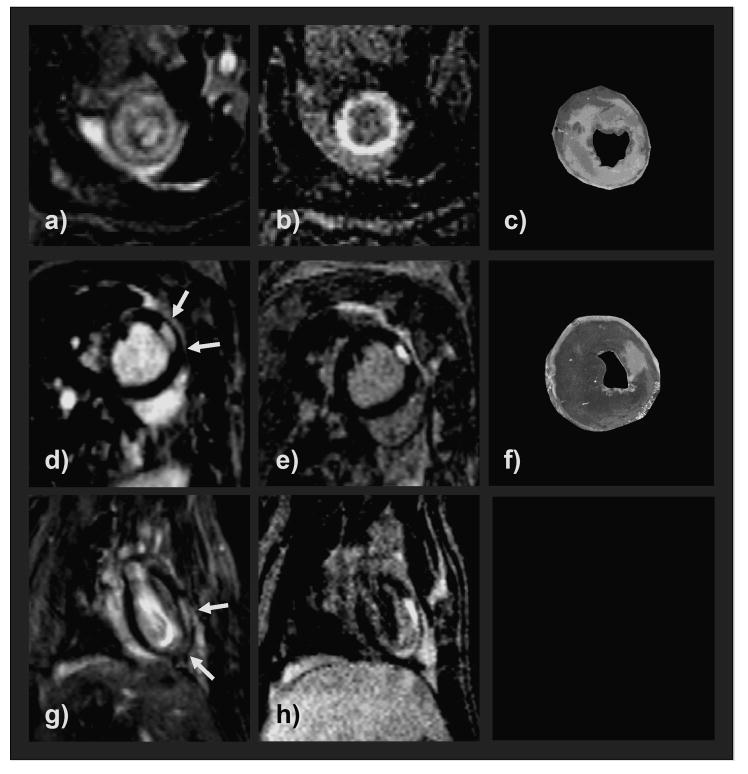
Representative CMR images in the left column (a, d, g) demonstrating infarcted areas (white arrows) in 3 different rats obtained with the T1-CD sequence. Images in the second column (b, e, h) are the corresponding IR images scanned in the same orientation. CMR images showed a very good correlation with the TTC-stained slices (light areas represent infarction) (c, f). The blood pool of the 60° T1-CF sequence appears very bright compared to the IR-sequence images due to the strong inflow-effect.
CNR and SNR
The implemented IR sequence effectively suppressed normal myocardium at an inversion time of ∼500–550 ms (Figs. 2 and 3) while the signal intensity of infarcted myocardium was greatly elevated due to the contrast agent uptake. Consequently, the IR sequence showed a significantly larger SNR for infarcted myocardium and lower SNR for normal myocardium than the T1-CF sequence (Table 1, n = 9). Accordingly, the relative SNR and the CNR for infarcted compared with normal myocardium was significantly greater for the IR sequence. Because of the high intensity of the blood in the strongly inflow dependent T1-CF sequence the CNR of infarcted myocardium and the blood pool were also greater for the IR sequence.
Figure 2.
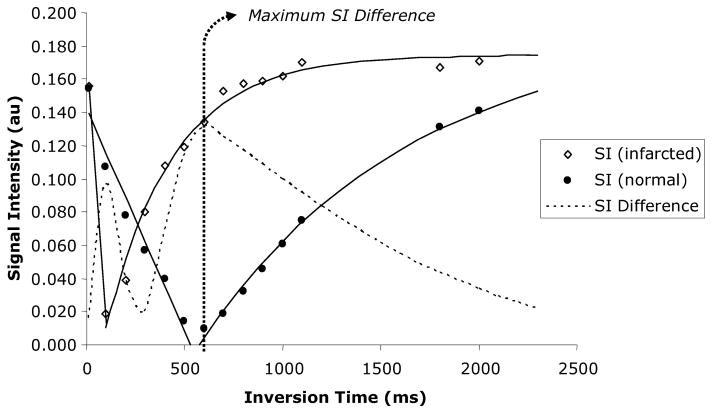
Representative signal intensities vs. inversion times for normal and infarcted myocardium measured in one rat after application of the inversion pulse. Both the normal and infarcted myocardium reach a point where signal intensities are effectively nulled, followed by a steady recovery of signal with increasing inversion time. The dotted line represents the difference in signal intensity between normal and infarcted myocardium, reaching a maximum when the normal myocardium is ‘nulled’ at an inversion time of approximately 550 ms.
Figure 3.
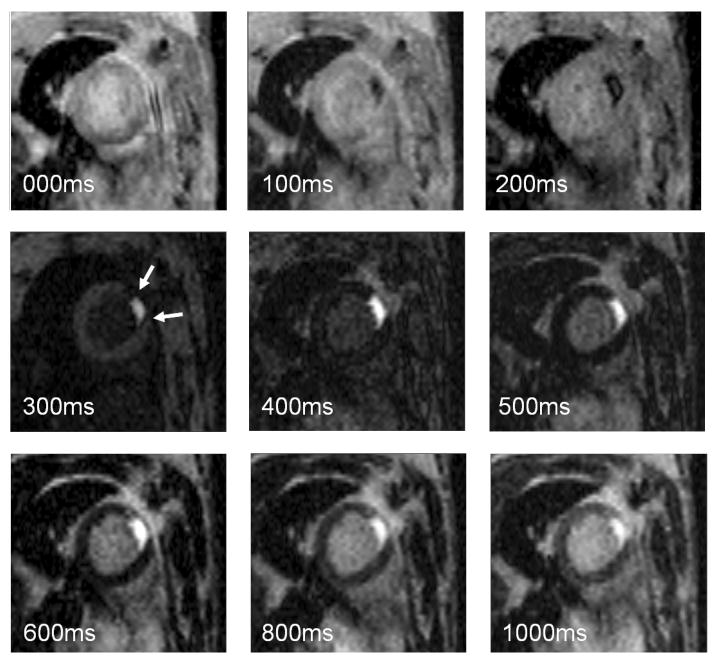
The panel contains images of varying signal intensity corresponding to increasing inversion times as depicted in Figure 2. At very short inversion times the signal intensity of the infarcted area (arrows) goes through the zero crossing, followed by a gradual recovery. The greatest signal difference is seen at an inversion time of 500–600 ms, where the signal of normal myocardium is fully suppressed, while the signal of the infarcted area has already recovered. Further increasing the inversion time allows for progressive recovery of the magnetization, decreasing the effect of the inversion pulse on image contrast.
Table 1.
SNR, CNR and Relative SNR of the infarcted and normal myocardium as well as the LV blood pool for the two pulse sequences
| Image sequence | ||
|---|---|---|
| Imaging parameter | T1-CF | IR |
| Signal-to-noise ratio | ||
| Infarcted myocardium | 17.2 ± 6.5 | 29.2 ± 6.4* |
| Normal myocardium | 8.1 ± 3.5 | 4.6 ± 2.9* |
| Blood pool | 29.0 ± 7.8 | 10.7 ± 3.6† |
| Contrast-to-noise ratio | ||
| Infarcted compared with normal myocardium | 9.1 ± 4.5 | 24.6 ± 6.2† |
| Infarcted compared with blood pool | 11.8 ± 6.1 | 18.5 ± 4.9* |
| Blood pool compared with normal myocardium | 20.9 ± 7.4 | 6.1 ± 2.9† |
| Relative SNR (%) | ||
| Infarcted compared with normal myocardium | 123.6 ± 52.7 | 666.1 ± 320† |
| Blood pool compared with normal myocardium | 305.2 ± 155.9 | 167.0 ±116 |
p< .05 vs. 60° T1-CF,
p< .001 vs. 60° T1-CF.
Infarction size assessment
The linear regression analysis as well as the Bland-Altman analysis showed excellent linear correlation and agreement between the two techniques and for both of the techniques compared to TTC (Figs. 4 and 5), n = 10). Both sequences tended to overestimate infarction size, with the T1-CF sequence yielding a slightly closer correlation and agreement to TTC than the IR sequence (R = 0.985 vs. R = 0.976, and 0.022 ± 2.035% mean of differences vs. 0.402 ± 2.622%). Figure 5 shows examples of short and long axis MRI images of three different rats. The infarcted area, as present on the TTC slices (Figs. 5c and 5f), is clearly visible on the contrast agent enhanced images of both sequences (Figs. 5a, 5b, 5d, 5e, 5g, and 5h).
Figure 4.
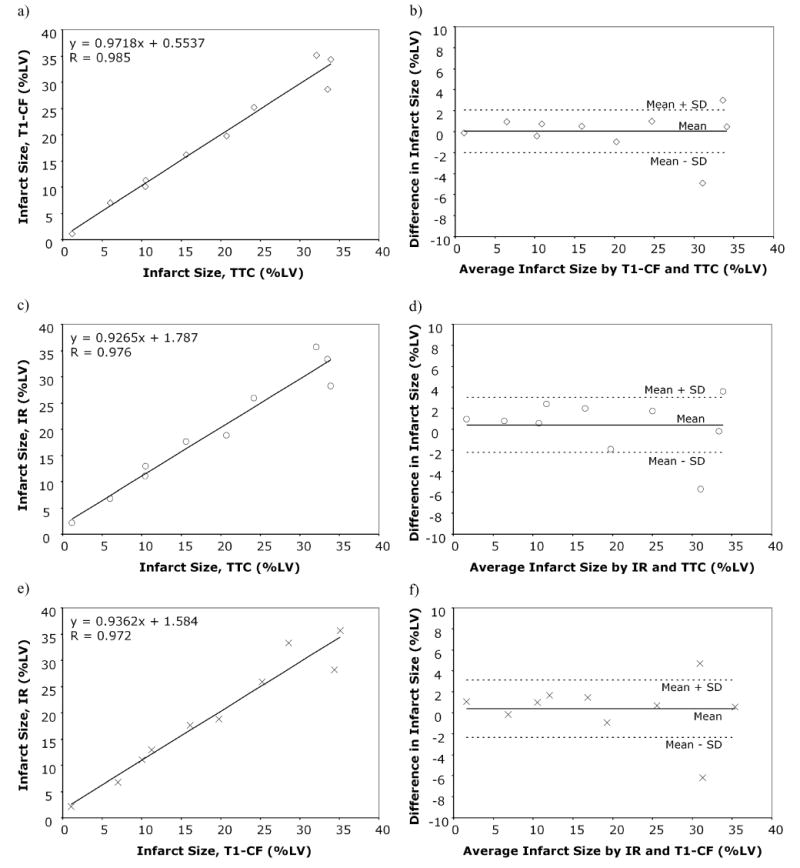
Linear regression plots (left column, a, c, e) and Bland-Altman plots (right column, b, d, f) comparing infarction size as assessed by 60° T1-CF sequence and TTC (a–b); the IR-sequence and TTC (c–d); and the 60° T1-CF and the IR-sequence (e–f). Both 60° T1-CF and IR-sequence show excellent correlation and very close agreement with TTC.
Discussion
This is the first study describing the implementation of an IR pulse sequence widely used in clinical CMR for post-infarction viability assessment in rats on a high field scanner. We compared this sequence with a heavily T1-weighted cine FLASH (T1-CF) sequence, which allows viability assessment and global functional analysis simultaneously. While the IR sequence revealed superior relative SNR and CNR, both sequences were equally capable of distinguishing viable from nonviable tissue as compared to the gold standard, TTC staining.
The use of the T1-weighted cine FLASH sequence for assessment of MI and global function was first described by Epstein et al (16). The authors concluded that this sequence yields accurate results for both purposes (5). We corroborated these findings, showing excellent correlation and agreement of this sequence with TTC for infarction size assessment. The slight overestimation of infarction size could be explained by partial volume effects, which at the current resolution cannot be ruled out (8). In addition, we performed for the first time a head to head comparison of the T1-CF sequence with the standard cine sequence. This was done to exclude any effect of the altered image contrast on assessment of global functional parameters. Given the excellent agreement between both sequences, the T1-CF sequence seemed to be best suited for infarction size assessment and assessment of global myocardial function as well as LV mass from the same acquisition. The depiction of both viable and non-viable tissue, together with the ability for concomitant functional assessment makes this technique especially attractive for simultaneous assessment of regional myocardial function.
The IR-sequence implemented on our system achieved adequate suppression of normal myocardium as compared to infarcted myocardium. The delay time between each inversion pulse and subsequent excitation pulse was therefore considered to be suitably long. However, in an ideal setting one should wait at least 4 × T1 for optimal tissue suppression. This is a prerequisite which in clinical settings at 1.5T in patients with high heart rates can only be achieved by skipping one heart beat between inversion pulses (17). Since the T1 of normal myocardium is extremely long at 4.7T (∼1300 ms) one needs to wait significantly longer. With animals having heart rates >300 bpm, one has to skip at least 2 × T1 to avoid complete saturation of magnetization, which results in an inefficiency of the inversion pulse sequence. Despite an optimal anesthetic protocol (1.5% isoflurane and heating) and continuous adjusting of the delay time, the chance of cardiac motion artifacts increases with the number of RR intervals skipped and overall imaging time. Compared to the T1-CF sequence, the imaging time with the IR sequence was almost four times longer (∼10 min vs. ∼2 min). A comprehensive imaging protocol would also require the acquisition of a cine sequence for assessment of global function, which would require additional scanning time. Thus, the protocol could become prohibitively long, especially for rats with large infarcts.
The advantage of the IR-sequence as compared to the T1-weighted cine sequence is the significant increase in relative SNR and CNR of the infarcted and non-infarcted myocardium. This effect has been previously described and is one of the obvious advantages of the sequence (10). The poor SNR of the blood pool, low CNR of the normal myocardium, and blood pool can easily be explained by the fact that a necrosis specific contrast agent was used. We felt that this was the most balanced approach to overcome the limitations of a pulse sequence comparison which is highly dependent on the gadolinium concentration in the infarcted area. Using a necrosis-specific contrast agent, the given concentration of gadolinium in the lesion can be assumed to remain stable during the scanning procedure. However, imaging had to be started after clearing of the contrast agent from the blood pool to take full advantage of the contrast agent's properties. This would subsequently lead to reduced signal of the blood pool. On the other hand, the high signal of the blood pool in the cine sequence is inflow dependent and, thus, remained unaltered. While the infarcted area was better delineated compared to the blood pool on the IR-images, the endocardial border was more easily distinguished on the cine sequence. It is noteworthy that these differences would be less apparent with the use of standard extracellular contrast agent (eg, Gd-DTPA), where at the time of scanning, there is contrast agent in the blood pool and normal myocardium, leading to elevated signal intensities in the blood pool and the myocardium on both sequences.
Both sequences tended to overestimate infarction size—with the IR-sequence yielding slightly greater values—but still showed an excellent agreement and correlation with TTC. Two factors may explain the greater infarction size estimates of the IR sequence vs. the T1-CF sequence: (1) because of using an identical thresholding method and the stronger T1 weighting, the infarcted area might have been overestimated, and (2) the IR-sequence was more prone to motion artifacts and blurring due to the significantly longer acquisition time and additional signal averaging.
Conclusion
We described the successful implementation of a gradient-echo inversion recovery sequence on a high field small animal scanner. The same excellent CNR and (relative) SNR of infarcted vs. normal myocardium, as noted on clinical 1.5 T scanners, was achieved with the presented technique. However, the sequence was not superior for post-infarction viability imaging to a previously described approach using a heavily T1 weighted cine (T1-CF) sequence—which enables the assessment of global and regional myocardial function from the same acquisition (5). Given the long intervals needed to allow for T1 relaxation between inversion pulses at higher field strength, the IR-sequence acquisition time becomes unacceptably long. This effect is even greater if a non-necrosis-specific contrast agent is used, and the imaging time after contrast agent administration becomes a critical issue (18). The heavily T1-weighted image might therefore be used to obtain both viability and functional data in a much shorter time. With the increasing use of rodent models in cardiovascular research, the use of a gradient-echo IR-sequence might still be attractive when imaging disorders that exhibit more diffuse or scattered patterns of enhancement, which are more difficult to detect, eg, myocarditis or cardiac sarcoidosis (19).
The study raises the question of whether the findings of this study can be extended to clinical viability imaging at 3T. Even though patient's heart rates are lower and the extracellular contrast agent used will lead to a shorter T1 not only in the infarcted but also in the normal region, one might still have to account for the increased T1 of the myocardium. The potential application of a strongly T1-weighted FLASH sequence (high flip angle), similar to a previously proposed approach using MTC with cine imaging for simultaneous viability and functional assessment at 1.5T (20), warrants further investigation.
Acknowledgments
This study was supported by a postdoctoral fellowship grant from the American Heart Association to D. Thomas.
The authors wish to thank Schering AG, Berlin, Germany for kindly providing the investigational drug Gadophrin-3.
References
- 1.Jia LG, Donnet C, Bogaev RC, Blatt RJ, McKinney CE, Day KH, Berr SS, Jones LR, Moorman JR, Sweadner KJ, Tucker AL. Hypertrophy, increased ejection fraction, and reduced Na-K-ATPase activity in phospholemman-deficient mice. Am J Physiol Heart Circ Physiol. 2005;288:H1982–8. doi: 10.1152/ajpheart.00142.2004. [DOI] [PubMed] [Google Scholar]
- 2.Nahrendorf M, Hiller KH, Hu K, Ertl G, Haase A, Bauer WR. Cardiac magnetic resonance imaging in small animal models of human heart failure. Medical Image Analysis. 2003;7:369–75. doi: 10.1016/s1361-8415(03)00011-2. [DOI] [PubMed] [Google Scholar]
- 3.Nahrendorf M, Spindler M, Hu K, Bauer L, Ritter O, Nordbeck P, Quaschning T, Hiller KH, Wallis J, Ertl G, Bauer WR, Neubauer S. Creatine kinase knockout mice show left ventricular hypertrophy and dilatation, but unaltered remodeling post-myocardial infarction. Cardiovasc Res. 2005;65:419–27. doi: 10.1016/j.cardiores.2004.10.006. [DOI] [PubMed] [Google Scholar]
- 4.Grothues F, Smith GC, Moon JC, Bellenger NG, Collins P, Klein HU, Pennell DJ. Comparison of interstudy reproducibility of cardiovascular magnetic resonance with two-dimensional echocardiography in normal subjects and in patients with heart failure or left ventricular hypertrophy. Am J Cardiol. 2002;90:29–34. doi: 10.1016/s0002-9149(02)02381-0. [DOI] [PubMed] [Google Scholar]
- 5.Yang Z, Berr SS, Gilson WD, Toufektsian MC, French BA. Simultaneous evaluation of infarct size and cardiac function in intact mice by contrast-enhanced cardiac magnetic resonance imaging reveals contractile dysfunction in noninfarcted regions early after myocardial infarction. Circulation. 2004;109:1161–7. doi: 10.1161/01.CIR.0000118495.88442.32. [DOI] [PubMed] [Google Scholar]
- 6.Nahrendorf M, Wiesmann F, Hiller KH, Hu K, Waller C, Ruff J, Neubauer S, Haase A, Ertl G, Bauer WR. Serial cine-magnetic resonance imaging of left ventricular remodeling after myocardial infarction in rats. J Magn Reson Imaging. 2001;14:547–55. doi: 10.1002/jmri.1218. [DOI] [PubMed] [Google Scholar]
- 7.Kim RJ, Fieno DS, Parrish TB, Harris K, Chen EL, Simonetti O, Bundy J, Finn JP, Klocke FJ, Judd RM. Relationship of MRI delayed contrast enhancement to irreversible injury, infarct age, and contractile function. Circulation. 1999;100:1992–2002. doi: 10.1161/01.cir.100.19.1992. [DOI] [PubMed] [Google Scholar]
- 8.Kim RJ, Wu E, Rafael A, Chen EL, Parker MA, Simonetti O, Klocke FJ, Bonow RO, Judd RM. The use of contrast-enhanced magnetic resonance imaging to identify reversible myocardial dysfunction. N Engl J Med. 2000;343:1445–53. doi: 10.1056/NEJM200011163432003. [DOI] [PubMed] [Google Scholar]
- 9.Simonetti OP, Kim RJ, Fieno DS, Hillenbrand HB, Wu E, Bundy JM, Finn JP, Judd RM. An improved MR imaging technique for the visualization of myocardial infarction. Radiology. 2001;218:215–23. doi: 10.1148/radiology.218.1.r01ja50215. [DOI] [PubMed] [Google Scholar]
- 10.Chapon C, Lemaire L, Franconi F, Marescaux L, Legras P, Denizot B, Le Jeune JJ. Assessment of myocardial viability in rats: evaluation of a new method using superparamagnetic iron oxide nanoparticles and Gd-DOTA at high magnetic field. Magn Reson Med. 2004;52:932–6. doi: 10.1002/mrm.20210. [DOI] [PubMed] [Google Scholar]
- 11.Saeed M, Wendland MF, Bremerich GL, Weinmann HJ, Higgins CB. Assessment of myocardial viability using standard extracellular and necrosis specific MR contrast media. Acad Radiol. 2002;9 Suppl 1:S84–7. doi: 10.1016/s1076-6332(03)80406-3. [DOI] [PubMed] [Google Scholar]
- 12.Barkhausen J, Ebert W, Debatin JF, Weinmann HJ. Imaging of myocardial infarction: comparison of magnevist and gadophrin-3 in rabbits. J Am Coll Cardiol. 2002;39:1392–8. doi: 10.1016/s0735-1097(02)01777-1. [DOI] [PubMed] [Google Scholar]
- 13.Schalla S, Wendland MF, Higgins CB, Ebert W, Saeed M. Accentuation of high susceptibility of hypertrophied myocardium to ischemia: complementary assessment of Gadophrin-enhancement and left ventricular function with MRI. Magn Reson Med. 2004;51:552–8. doi: 10.1002/mrm.20018. [DOI] [PubMed] [Google Scholar]
- 14.Epstein FH, Yang Z, Gilson WD, Berr SS, Kramer CM, French BA. MR tagging early after myocardial infarction in mice demonstrates contractile dysfunction in adjacent and remote regions. Magn Reson Med. 2002;48:399–403. doi: 10.1002/mrm.10210. [DOI] [PubMed] [Google Scholar]
- 15.Kim RJ, Shah DJ, Judd RM. How we perform delayed enhancement imaging. J Cardiovasc Magn Reson. 2003;5:505–14. doi: 10.1081/jcmr-120022267. [DOI] [PubMed] [Google Scholar]
- 16.Oshinski JN, Yang Z, Jones JR, Mata JF, French BA. Imaging time after Gd-DTPA injection is critical in using delayed enhancement to determine infarct size accurately with magnetic resonance imaging. Circulation. 2001;104:2838–42. doi: 10.1161/hc4801.100351. [DOI] [PubMed] [Google Scholar]
- 17.Mahrholdt H, Goedecke C, Wagner A, Meinhardt G, Athanasiadis A, Vogelsberg H, Fritz P, Klingel K, Kandolf R, Sechtem U. Cardiovascular magnetic resonance assessment of human myocarditis: a comparison to histology and molecular pathology. Circulation. 2004;109:1250–8. doi: 10.1161/01.CIR.0000118493.13323.81. [DOI] [PubMed] [Google Scholar]
- 18.Weiss CR, Aletras AH, London JF, Taylor JL, Epstein FH, Wassmuth R, Ballaban RS, Arai AE. Stunned, infarcted, and normal myocardium in dogs: simultaneous differentiation by using gadolinium-enhanced cine MR imaging with magnetization transfer contrast. Radiology. 2003;226:723–30. doi: 10.1148/radiol.2263012196. [DOI] [PubMed] [Google Scholar]