

Abstract
Background
Although adult antisocial personality disorder is generally preceded by a pattern of childhood/adolescent conduct problems, only a subset of those who manifest these developmental precursors go on exhibit significant antisocial behavior in adulthood. To date, however, researchers have yet to resolve the origins of either stability or change in antisocial behavior from childhood/adolescence to adulthood.
Method
The present study sought to fill this gap in the literature, making use of a sample of 626 twin pairs from the ongoing Minnesota Twin Family Study (MTFS). Participants were assessed three times between late adolescence and early adulthood. We made use of biometric Cholesky decomposition and latent growth curve modeling techniques, which allow researchers to disambiguate processes of stability and change and evaluate their respective etiologies (i.e. genetic or environmental).
Results
Our results revealed that genetic forces were largely responsible for the stability of adult symptoms of antisocial behavior (AAB) from late adolescence through mid-adulthood, while non-shared environmental influences were primarily responsible for change. Importantly, however, although some of the latter represented systematic and long-lasting influence, much of this non-shared environmental variance appeared transient and idiosyncratic.
Conclusions
Such findings highlight the enduring impact of genetic influences on AAB, and offer insights into the nature of non-shared environmental influences on development.
Introduction
Antisocial personality disorder (APD) is defined as a pattern of maladaptive behavior characterized by deception and violation of the personal and property rights of others. These behaviors are linked to a number of negative life outcomes, including low academic and professional achievement, substance dependence, and incarceration/legal problems (Moffitt, 2003). Each person who quits school for a life of crime is estimated to cost society between $1.7 million and $2.3 million (Snyder & Sickmund, 1999).
Understanding the origins of adult criminal behaviors is thus a crucial task for social scientists. To date, researchers have produced convincing evidence that the pathway to these behaviors begins in childhood, with conduct problems, attention difficulties, high rates of aggressive behaviors, and a persistent pattern of deviant and illegal activity (Moffitt, 1993, 2003). However, only a subset of the children manifesting these behaviors go on exhibit significant antisocial behavior in adulthood (Rutter, 2003). Indeed, neither the origins of stability nor the origins of change from childhood/adolescence to adulthood have yet been resolved. Researchers have thus begun to focus their attentions on understanding the mechanisms underlying these developmental processes.
One useful methodology for such an exploration is that of twin studies. Because the comparison of monozygotic (MZ) or identical and dizygotic (DZ) or fraternal twins allows researchers to parse the genetic and environmental contributions to a given disorder across multiple assessments, twin designs offer a great deal of utility for understanding the origins of stability and change. And while identifying the sources of stability and change as ‘genetic’ or ‘environmental’ does not constitute a full explanation of their etiologies, it does yield valuable information that can be used to guide the direction of future research.
Taking advantage of this design, a handful of previous studies (Lyons et al. 1995; van Beijsterveldt et al. 2001; Jacobson et al. 2002; Eley et al. 2003; van der Valk et al. 2003; Bartels et al. 2004; Haberstick et al. 2005) have examined the sources of stability in antisocial/ externalizing behavior over time, with notably consistent findings. As an example, Eley et al. (2003) examined Child Behavior Checklist (CBCL) Aggression and Delinquency scales in roughly 1200 twin pairs at ages 8–9 and then again at 13–14. They found that genetic forces accounted for most of the covariance between time 1 and time 2, indicating a substantial genetic contribution to stability. Shared environmental forces (i.e. those environmental factors common to siblings that act to increase their similarity) also contributed to stability, particularly for the Delinquency scale. By contrast, non-shared environmental influences (i.e. those environmental factors unique to each twin that act to decrease sibling similarity) were primarily age/assessment-specific. Studies examining (retrospective) reports of antisocial behavior from adolescence to adulthood (Lyons et al. 1995; Jacobson et al. 2002) similarly highlighted genetic contributions to stability and non-shared environmental contributions to change (although Jacobson et al. (2002) also found evidence of some genetic influences unique to adulthood).
Although these studies make important contributions to the literature, certain questions remain unanswered. First, it is unclear whether genetic influences underlie stability during the transition from adolescence into adulthood, as the few existing studies in this age range (Lyons et al. 1995; Jacobson et al. 2002) have been hampered by an exclusive reliance on retrospective data. The current study thus extends earlier work using a prospective longitudinal design.
Second, and perhaps more importantly, the origins of change in antisocial behavior over time remain speculative. Specifically, although their findings of assessment-specific non-shared environmental influences are clearly suggestive of non-shared environmental contributions to change, none of the studies explicitly modeled change in antisocial behavior. Change was instead conceptualized only as those influences that were assessment-specific. Although not an unreasonable indicator of change, this conceptualization is less straightforward with regard to non-shared environmental influences modeled at the phenotypic level, as these also include measurement error. Thus, it remains unclear whether the non-shared environment meaningfully contributes to lasting change in antisocial behavior.
Given this, the present study aimed to examine the sources of both stability and change in antisocial behavior symptoms from three assessments conducted in late adolescence through early adulthood. To do so, we made use of two biometric modeling techniques. We first examined genetic and environmental contributions to stability and change using a common Cholesky decomposition model. As the full Cholesky is an ‘unstructured’ model (i.e. all paths are estimated), it allowed us to examine the etiology of stability and change in antisocial behavior in its most general form. To more precisely evaluate change, however, we also made use of a biometric latent growth curve model (Neale & McArdle, 2000). The latter model allowed us to disambiguate non-shared environmental contributions to change into those that are systematic and have a lasting impact (i.e. the latent linear slope) and those that are unsystematic and assessment-specific (i.e. residual variances, which also contain measurement error). In this way, biometric modeling enabled us to more specifically examine the origins of stability and change in antisocial behavior from late adolescence to early adulthood.
Method
Participants
The sample was drawn from participants in the ongoing Minnesota Twin Family Study (MTFS). Detailed information regarding the design, recruitment procedures, participation rates and zygosity determination of the MTFS has been provided elsewhere (Iacono et al. 1999). The current sample consisted of 626 same-sex, reared-together twin pairs: 289 male (nMZ=188, nDZ=101) and 337 female (nMZ= 223, nDZ=114) pairs. Opposite-sex pairs were not assessed. These participants were roughly 17 years old at the time of their intake visit. Twins were assessed again approximately 3 and 7 years following their intake assessment (although the actual assessment interval varied between 2.7 and 5 years for the first follow-up assessment and between 5.6 and 11.3 years for the second follow-up assessment). A total of 478 (83%) male and 621 (92%) female twins completed the diagnostic portion of the first follow-up assessment, while 495 (86%) male and 531 (79%; the second female follow-up assessment is not complete as of yet) female twins completed the second follow-up assessment. A total of 466 pairs (74% of the intake sample) completed all three assessments to date.
Measures
During their intake and follow-up visits, all participants were assessed in-person for DSM-III-R mental disorders (DSM-III-R was current at the onset of the study) by trained bachelor- and masters-level interviewers. Each twin within a pair was interviewed by a different interviewer. Because the present study centers on late adolescence through early adulthood, adult antisocial behavior (AAB) was operationalized as a tally of the adult symptoms (DSM-III-R Criterion C) of APD. AAB was assessed by the Structured Clinical Interview for DSM-IV Axis II Personality Disorders (SCID-II; Spitzer et al. 1987). Although AAB is not a DSM diagnosis, if either three or four symptoms are used to define a ‘diagnosis’, the kappa reliability exceeds 0.78. The MTFS version of this instrument contained supplementary probes and questions to ensure complete coverage of each symptom.
At intake, the reporting period was the twin's lifetime. At later assessments, symptom onset and offset were also assessed. Follow-up symptoms counts thus consisted of symptoms present only since the participant's previous MTFS assessment. However, for 82 males and 18 females, we were missing information on symptom onset and offset. For these cases, follow-up symptom counts were lifetime totals (of note, retaining these cases acted primarily to increase statistical power but did not appreciably alter the results). Following the interview, a clinical case conference was held in which the evidence for every symptom was discussed by at least two advanced clinical psychology doctoral students (neither of whom conducted the clinical interview). Only symptoms that were judged to be clinically significant in both severity and frequency were considered present. As actual diagnoses were not used, duration rules were excluded. Computer algorithms were used to sum the number of symptoms.
Analyses
Structural equation modeling of twin data is based on the difference in the proportion of genes shared between MZ twins, who share 100% of their genetic material, and DZ twins, who share an average of 50% of their segregating genetic material. MZ and DZ twin correlations are compared to estimate the relative contributions of additive genetic effects (a2), shared environmental effects (c2), and non-shared environmental effects plus measurement error (e2) to the variance within observed behaviors or characteristics (i.e. phenotypes). Crucial to this methodology is the Equal Environments Assumption (EEA), which assumes that MZ pairs are no more likely to share the environmental factors that are etiologically relevant to the phenotype under study than are DZ pairs. Any differences in the MZ and DZ correlations are thus assumed to be due to differences in their genetic similarity.
Within a triangular, or Cholesky decomposition, model (see Fig. 1) the genetic and environmental paths (e.g. a11, a21, a31, a22, a32, a33) effectively function as regression terms, such that a33 comprises only the genetic effects remaining after that accounted for by earlier paths is removed. Accordingly, the covariance paths across assessments index ‘stability’. For example, a21 and a31 capture genetic contributions to AAB at times 2 and 3 that are present at time 1. By contrast, the variance paths at times 2 (e.g. a22) and 3 (e.g. a33) index change in its most general form, as they capture genetic and environmental influences not present during previous assessments.
Fig. 1.
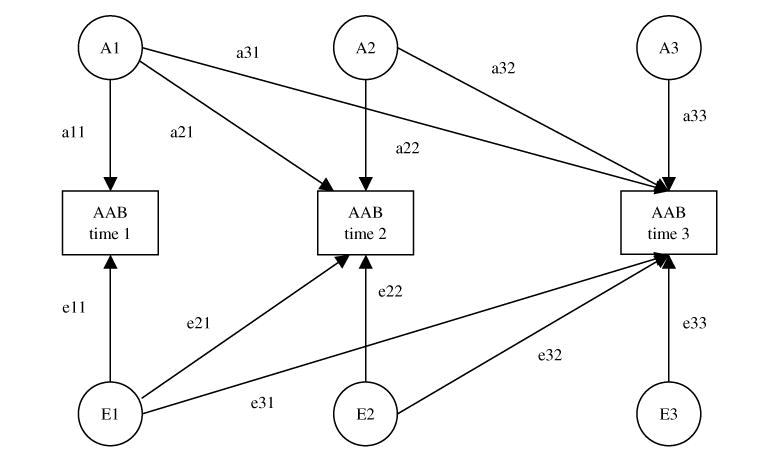
Path diagram of a Cholesky decomposition model. The variance in liability to adult antisocial behavior (AAB) symptoms at each assessment is parsed into that which is due to additive genetic effects (A1, A2 and A3), shared environmental effects, and non-shared environmental effects (E1, E2 and E3). Although they are used in the model, shared environmental effects (C) are not represented here for ease of presentation. Similarly, this path diagram represents only one twin in a pair (results are identical for the co-twin). Paths, which are squared to estimate the proportion of variance accounted for, are represented by lowercase letters followed by two numerals (e.g. a11, a21 and a31).
To more precisely evaluate change, however, we also made use of a biometric latent growth curve model (Neale & McArdle, 2000). Of note, because assessment intervals varied across pairs, we altered the Neale and McArdle (2000) model to include the age of each twin pair as a definition variable, a procedure implemented in more recent versions of this model (McArdle & Hamagami, 2003; Reynolds et al. 2005). The full biometric growth model is depicted in Fig. 2. In this model, the variance in AAB at any given assessment was decomposed into three portions, all of which were then further decomposed into their additive genetic, shared environmental, and non-shared environmental components. We first examined genetic and environmental contributions to the latent intercept (i.e. ai, ci, ei), which comprises the variance in AAB that is stable across assessments. As indicated by the intercept factor loadings (all of which are fixed to 1), this factor contributes equally to AAB at all three assessments.
Fig. 2.
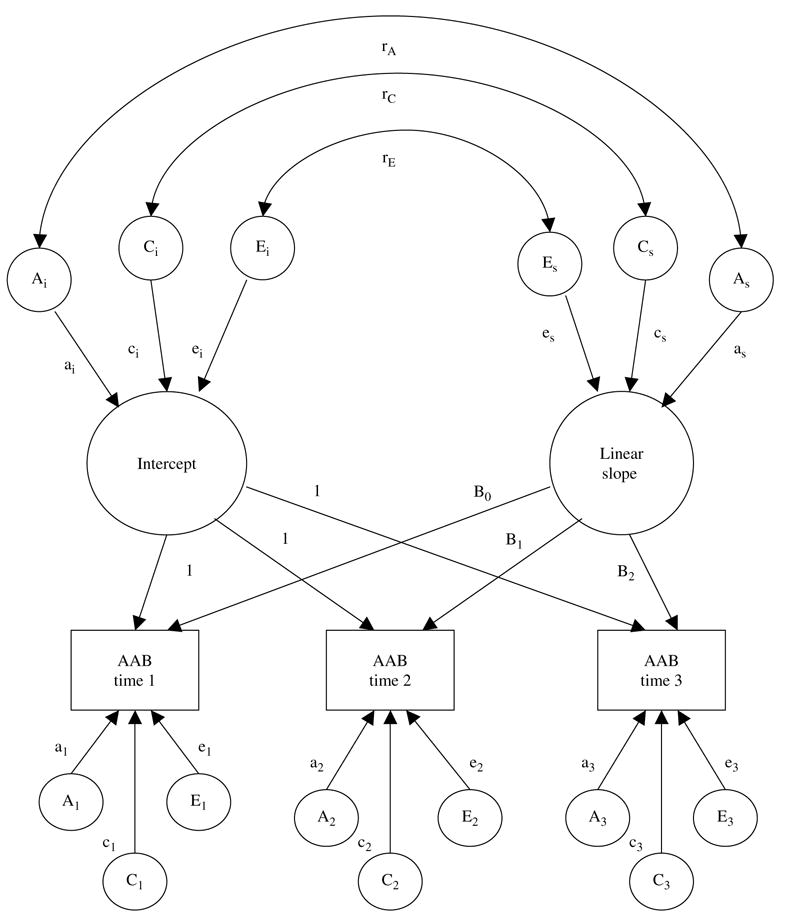
Path diagram of latent growth curve model of adult antisocial behavior (AAB) symptoms. For ease of presentation, this path diagram represents only one twin in a pair (results are identical for the co-twin). Variances in the intercept and linear slope factors are parsed into that which is due to additive genetic effects (A), shared environmental effects (C), and non-shared environmental effects (E). Paths are represented by lowercase letters followed by subscripted letters corresponding to their respective factor (e.g. ai, as). Genetic and environmental correlations between the factors are presented at the top of the diagram (e.g. rA, rC, rE). The assessment-specific residual paths loads directly onto AAB at each assessment, and are indicated by a lowercase letter followed by a single subscripted numeral (e.g. a1). Factor loadings for the intercept are fixed prior to analysis. Centered age basis coefficients for the linear portion of the model (e.g. B0, B1, B2) are calculated separately for each twin pair.
We next examined genetic and environmental contributions to change. The latent linear slope (i.e. as, cs, es) captures systematic change in AAB over time1,† Age basis coefficients, calculated separately for each twin pair, comprised the slope's factor loadings (i.e. B0, B1 and B2). Consistent with prior work (Reynolds et al. 2005), the age basis coefficients were centered prior to analysis (i.e. observed age minus 17). Importantly, because the slope is modeled as a latent factor, non-shared environmental influences are not confounded with measurement error (error is instead encapsulated within the non-shared environmental residuals). We finally examined the residual genetic and environmental variances, or the unsystematic variance remaining at each assessment after accounting for the effects of the latent intercept and slope (i.e. a1, c1, e1 at time 1, a2, c2, e2 at time 2, a3, c3, e3 at time 3). In this way, non-shared environmental contributions to change were disambiguated into systematic influences with lasting impact (i.e. the latent linear slope) and unsystematic, assessment-specific influences (i.e. residuals that include measurement error), thereby allowing us to more precisely understand the mechanisms underlying change in AAB over time.
Because of missing data, we made use of Full-Information Maximum-Likelihood raw data techniques (FIML) for both the Cholesky and the latent growth curve model, which produce less biased and more efficient and consistent estimates than techniques such as pairwise or listwise deletion in the face of missing data (Little & Rubin, 1987). To adjust for positive skew in the data while still allowing for changes in the mean and variance with age, the measures were log-transformed prior to model fitting. Following this procedure, there was only a small amount of skew remaining for men (standardized skewness following transformation: 0.98, 0.34 and 0.22 at times 1, 2 and 3 respectively). Data remained somewhat more skewed for women (1.98, 1.08 and 0.65 at times 1, 2 and 3 respectively). Mx (Neale, 1997) was used to fit models to the transformed raw data. When fitting models to raw data, variances, covariances and means of those data are freely estimated by minimizing minus twice the log-likelihood (−2 ln L). This comparison provides a likelihood-ratio χ2 of goodness of fit for the model, which is then converted to the Akaike information criterion (AIC; Akaike, 1987) (AIC=χ2−2df), the traditional fit index of behavioral genetics research. The AIC measures model fit relative to parsimony to determine the best-fitting model among nested models. Better-fitting models have more negative values.
The moderating effects of gender were also examined in these analyses, as it is well known that men generally display a higher frequency of antisocial behavior than do women (Hewitt et al. 1997; Moffitt, 1993, 2003). Both the Cholesky decomposition model and the latent growth model were thus fit allowing for sex differences in parameter estimates and constraining parameter estimates to be equal across sex. In all models, however, estimated means/factor loadings were allowed to differ by sex.
Results
Participants displayed moderate rank-order stability in their AAB symptom counts over time. In men, AAB at time 1 was correlated 0.54 and 0.33 with AAB at times 2 and 3. In women, AAB at time 1 was correlated 0.45 and 0.38 with AAB at times 2 and 3. AAB at time 2 was similarly correlated 0.54 and 0.48 with AAB at time 3 in men and women respectively (all correlations were significant at p<0.001). To index the severity of AAB symptomatology and its development over time, mean symptom counts were next computed separately by sex and age (see Table 1). Across all assessments, independent-samples t tests indicated that mean AAB symptom counts differed significantly by sex (p<0.01), with men having higher levels of AAB than women. Furthermore, paired-sample t tests indicated that AAB increased from time 1 to time 2 in both men and women and either decreased or remained constant from time 2 to time 3. Collectively, such findings indicate that although AAB displayed moderate rank-order stability, the mean number of symptoms changed over time.
Table 1.
Adult antisocial behavior (AAB) symptom count data across assessments
| AAB symptom count | ||||||
|---|---|---|---|---|---|---|
| Assessment | Mean age | Mean | S.D. | Min | Max | n |
| Men | ||||||
| 1 | 17.49 | 0.81* | 1.23 | 0 | 6 | 577 |
| 2 | 20.67 | 1.14* | 1.28 | 0 | 7 | 478 |
| 3 | 24.34 | 1.04* | 1.10 | 0 | 7 | 495 |
| Women | ||||||
| 1 | 17.46 | 0.41* | 0.95 | 0 | 7 | 670 |
| 2 | 20.67 | 0.52* | 0.84 | 0 | 5 | 621 |
| 3 | 25.00 | 0.51 | 0.67 | 0 | 6 | 531 |
Mean levels of adult AAB symptoms are presented. AAB symptom counts could conceivably range from 0 to 10.
Significant difference in AAB between consecutive assessments at p<0.05.
Multivariate modeling
Cholesky decomposition model
We initially estimated variances, covariances and means for the raw data to get a baseline index of fit (−2 ln L=3533.22, df=3259). The model was fit both allowing for sex differences (−2 ln L=3607.42, df=3325, AIC=−57.80) and constraining parameter estimates to be equal across sex (−2 ln L=3687.04, df=3343, AIC=−14.18). The best-fitting model, as indicated by the most negative AIC value, was the sex-differences model (as presented in Fig. 3). Genetic (A), shared (C) and non-shared (E) environmental contributions can be obtained by squaring their path coefficients.
Fig. 3.
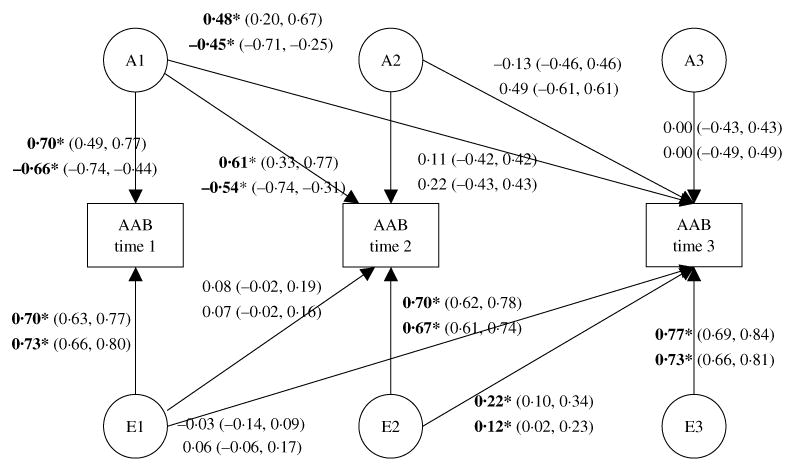
Standardized path diagram of the sex-differences Cholesky decomposition model of adult antisocial behavior (AAB) symptoms. Standardized path estimates of the genetic and environmental contributions to AAB symptoms over time are illustrated. Estimates for men are presented above, while those for women are presented below. Each are followed by their 95% confidence intervals. The standardized shared environmental paths are estimated in the model (men/women: c11=−0.14/−0.20, c21=−0.35/−0.45, c31=−0.31/−0.10, c22=0.04/0.00, c32=−0.13/0.00, c33=0.00/0.00) but are not represented in the figure, for ease of presentation (none of the paths was statistically significant). Paths that are significant at p<0.05 are bolded and indicated by an asterisk. Paths are squared to estimate the proportion of variance accounted for.
For both men and women, all significant genetic influences on AAB originated from a single genetic factor (A1), such that the genetic influences present at times 2 and 3 were already operating at time 1. Moreover, these genetic contributions to AAB at times 2 and 3 were moderate to large, contributing between 20% and 37% of the variance. The remaining genetic parameters were generally small and consistently non-significant. There was also evidence of a small non-shared environmental contribution (5% for men and 1% for women) to the stability of AAB from time 2 to time 3. In general, however, non-shared environmental influences were predominantly assessment-specific, uniquely contributing between 49% and 59% of the variance in AAB at each assessment for both men and women. Shared environmental influences did not make any significant contributions to AAB in either gender at any assessment. Such findings serve to highlight genetic contributions to the stability of AAB from late adolescence through early adulthood, while implicating non-shared environmental influences as the most salient contributor to change in AAB over the same period.
Latent growth curve model
Because we included age as a definition variable in the growth model, it is not nested in either the baseline or the Cholesky model. Growth model fit indices thus cannot be directly compared with those of the other models, only to each other. The growth curve model was fit both allowing for sex differences in parameter estimates (−2 ln L=3207.12, df=3033) and constraining parameter estimates to be equal across sex (−2 ln L=3279.60, df=3051, AIC=36.48). The positive AIC indicates that the sex-differences model fit better.
As shown in Table 2, the intercept factor was influenced primarily by genetic forces for both men and women. The shared and the non-shared environment contributed far less, and none of these contributions was significantly different from zero. Such findings are notably consistent with those of the Cholesky model and reinforce our conclusion that the stability of AAB over time is primarily a function of enduring genetic influences.
Table 2.
Sex-differences latent growth curve model results for adult antisocial behavior (AAB) symptoms
| Unstandardized variance components | ||||
|---|---|---|---|---|
| A | C | E | Factors | |
| Men | ||||
| Factors | ||||
| Intercept (e.g. ai) | 0.163 (84%)* | 0.000 (0%) | 0.031 (16%) | — |
| (0.081–0.222) | (0.000–0.077) | |||
| Linear slope (e.g. as)∼ | 0.0004 (18%) | 0.0001 (6%) | 0.0018 (76%)* | — |
| (0.000–0.002) | (0.000–0.001) | (0.0001–0.0035) | ||
| Genetic/environmental correlations (e.g. rA) | −1.0 | 1.0 | −0.54 | |
| Residuals | ||||
| Time 1 (e.g. a1) | 0.009 (3%) | 0.000 (0%) | 0.107 (35%)* | 62% |
| (0.000–0.055) | (0.065–0.151) | |||
| Time 2 (e.g. a2) | 0.011 (3%) | 0.023 (7%) | 0.128 (40%)* | 50% |
| (0.000–0.068) | (0.000–0.061) | (0.099–0.162) | ||
| Time 3 (e.g. a3) | 0.000 (0%) | 0.008 (4%) | 0.073 (36%)* | 60% |
| (0.000–0.037) | (0.033–0.118) | |||
| Women | ||||
| Factors | ||||
| Intercept (e.g. ai) | 0.088 (77%)* | 0.005 (5%) | 0.021 (18%) | — |
| (0.030–0.121) | (0.000–0.057) | (0.000–0.045) | ||
| Linear slope (e.g. as)∼ | 0.0006 (38%) | 0.0002 (11%) | 0.0008 (51%) | — |
| (0.000–0.001) | (0.000–0.001) | (0.000–0.002) | ||
| Genetic/environmental correlations (e.g. rA) | −0.46 | −1.0 | −0.65 | |
| Residuals | ||||
| Time 1 (e.g. a1) | 0.000 (0%) | 0.000 (0%) | 0.076 (41%)* | 59% |
| (0.056–0.098) | ||||
| Time 2 (e.g. a2) | 0.000 (0%) | 0.024 (12%) | 0.084 (41%)* | 47% |
| (0.000–0.041) | (0.069–0.102) | |||
| Time 3 (e.g. a3) | 0.000 (0%) | 0.000 (0%) | 0.058 (45%)* | 55% |
| (0.032–0.084) | ||||
A, C and E represent genetic, shared and non-shared environmental influences respectively. The intercept factor is composed of the variance in AAB that is common or stable across time. The slope factor captures systematic, linear change in AAB over time. Unstandardized estimates are presented, followed by the proportion of variance accounted for (the latter is in parentheses). Both factors were decomposed into their genetic and environmental components, and therefore each row sums to 100% of the variance within that factor. Genetic and environmental correlations between factors are also indicated (of note, these are presented for informational purposes but are not particularly meaningful in the present study, as influences on the slope (i.e. E) and intercept (i.e. A) seemed to be fundamentally distinct). The residual estimates index the variance remaining in AAB at each assessment after that contributed by the factors is accounted for; accordingly, the variance contributed by the factors is necessary for the rows to sum to 100%. For example, the factors (both the intercept and the slope) contributed 62% of the total variance in men's AAB at time 1, while the residuals contributed 38% (i.e. 3% of which is genetic and 35% of which is non-shared environmental in origin). For those estimates greater than zero, 95% confidence intervals are presented below the variance estimates in parentheses (note that these cannot be smaller than zero, as variances are necessarily positive). Statistically significant variance components (p<0.05) are bolded and indicated with an asterisk. We also explicitly evaluated the significance of the linear slope overall. A tilda (∼) indicates that the slope contributes a significant proportion of variance (p≤0.05) to the growth model (i.e. constraining all slope parameters to be zero resulted in a significant decrease in fit).
Also consistent with Cholesky results was the finding that change in AAB, as indexed by the slope and the residuals, was primarily influenced by non-shared environmental forces, particularly in men. Genetic and shared environmental contributions to the slope and the residuals were small and non-significant for men and women. By contrast, non-shared environmental contributions to change were almost uniformly significant (the only exception being non-shared environmental influences on the slope in women).
An important interpretive consideration, however, concerns the nature of that change. Is change in AAB (and thus non-shared environmental influences) systematic and long-lasting or unsystematic and transient? Our results are consistent with both, but clearly favor the latter. Non-shared environmental residuals accounted for 35–45% of the total variance in AAB at any given assessment2. By contrast, a visual comparison3 of the unstandardized intercept and slope estimates makes clear that the total magnitude of variance modeled within the slope (0.0023 in men and 0.0016 in women)4 was small (albeit significant) relative to that contributed by the intercept (0.194 in men and 0.114 in women). Such findings collectively suggest that although the majority of the non-shared environmental contribution to change in AAB is transient and unsystematic, there are some non-shared environmental effects that exert systematic and long-lasting influence, particularly in men.
Discussion
The purpose of the current study was to examine the etiology of stability and change in AAB from late adolescence through early adulthood. To do so, we made use of two biometric models: a Cholesky model and a latent growth curve model. The results suggest two primary conclusions. First, the stability of AAB over time appears to be primarily a function of enduring genetic influences. Indeed, all significant genetic influences on AAB in early adulthood were already operating in late adolescence. Second, non-shared environmental influences are almost solely responsible for change in AAB over the same period. However, although some non-shared environmental effects exert systematic and long-lasting influence, much of this variance appears to be transient and idiosyncratic.
These results are generally consistent with the literature. Previous studies (van Beijsterveldt et al. 2001; Eley et al. 2003; van der Valk et al. 2003; Haberstick et al. 2005) have found that genetic influences were primarily responsible for the stability in externalizing/delinquency, while non-shared environmental forces were assessment-specific (and thus contributed to change). There are differences, however. Two research groups have found that shared environmental influences also contribute to the stability of rule-breaking (Eley et al. 2003; van der Valk et al. 2003). One possible explanation relates to the ages of the samples. The Eley et al. 2003 and van der Valk et al. 2003 samples were collected in childhood/early adolescence while the current study samples were collected from late adolescence through early adulthood. This age difference is not trivial, as studies have indicated that estimates of genetic influence on multiple phenotypes appear to increase with age, shared environmental estimates simultaneously decrease with age (McGue et al. 1993; Lyons et al. 1995), a phenomenon that may arise because individuals exert an increasingly greater impact (while their rearing environment has increasingly less impact) on the environments they experience (Scarr & McCartney, 1983). Thus, the aforementioned differences between studies may be developmentally and theoretically meaningful.
Second, we found that the mean level of AAB increased from time 1 (roughly age 17) to time 2 (roughly age 20), after which it either stabilized or decreased. Other phenotypic growth curve studies, by contrast, have found evidence of a somewhat earlier decrease in delinquency, one that begins in late adolescence (Windle, 2000). This distinction may be linked to our use of a more severe and adult-oriented measure of antisocial behavior (i.e. the symptoms of adult APD), symptoms that are more likely to be expressed by antisocial individuals in adulthood than in adolescence. Prior studies (Windle, 2000), by contrast, have made use of more adolescent-driven phenotypes, namely delinquency or conduct disorder.
There are several limitations to bear in mind when interpreting the results of the present study. Although we rely on the EEA for interpretation of the results, it was not directly evaluated here as such analyses are beyond the scope of the present study. However, the EEA has been repeatedly tested and supported for numerous phenotypes (Scarr & Carter-Saltzman, 1979; Morris-Yates et al. 1990; Kendler et al. 1993; Hettema et al. 1995), including antisocial behavior and conduct disorder (Rowe, 1983; Cronk et al. 2002; Jacobson et al. 2002).
Next, although our decision to use age-basis factor loadings in our growth model was advantageous in that it allowed us to easily accommodate variation in assessment intervals, there are limitations to the design. In particular, the slope will be steeper for twins with longer assessment intervals as compared to those with shorter assessment intervals, thereby complicating interpretation of shared environmental parameters (i.e. influences that increase twin similarity regardless of zygosity, such as age at assessment). However, as our results yielded few non-zero shared environmental parameters, and none that were statistically significant, this complication does not appear to dramatically impact our primary findings. Future research should seek to replicate the current findings making use of other developmental models, such as genetic transmission models.
In addition, although the sex-differences model fit better than the no-sex-differences model for both models, few differences in standardized parameter estimates were observed. In other words, roughly the same proportion of variance was attributable to genetic and environmental influences in both men and women. The improved fit of the sex-differences model is thus thought to primarily reflect gender differences in unstandardized or absolute variances (i.e. there was more variability in AAB among men than women; see Table 1). Moreover, our findings are consistent with those of twin studies in adolescence and adulthood (although not childhood) that included opposite-sex pairs (Jacobson et al. 2002). As this latter design is particularly well-suited to examine possible sex differences, it increases confidence in these conclusions. Future studies should model sex as a definition variable to more fully explore possible distinctions.
Evidence to date suggests that childhood- and adolescent-onset antisocial behavior may differ etiologically (Moffitt, 2003; Burt et al., unpublished observations). Unfortunately, data regarding early-onset were not available for the present study. One possible complication of this is that, because those with AAB symptoms at time 1 are likely to include both childhood-onset and adolescent-onset cases, it may be that the childhood-onset antisocial individuals are driving the stability of AAB, whereas the adolescent-limited cases are driving change. It is worth noting, however, that for those men in the top decile of AAB at time 3 (i.e. roughly age 24; those most likely to have life-course persistent AAB), symptoms increased from time 1 to time 2 (1.92 to 3.03; p<0.000), indicating that change was not restricted only to those with adolescent-limited AAB. However, future studies of stability and change in antisocial behavior should incorporate age of onset more directly into their analyses.
Finally, we were not able to directly examine the possibility of non-linear etiological shifts at the factor level. Growth curve modeling requires one more time of measurement than estimated random effects parameters. With three assessments, therefore, we were only able to estimate an intercept and a linear slope. This is troublesome because of the clear non-linear pattern in AAB over time (see Table 1). Two aspects of our findings, however, temper our concern. First, the growth curve modeling results are strikingly similar to the Cholesky results, suggesting that constraining the slope to be linear had a minimal effect on our findings. Second, examinations of the genetic and shared environmental residuals provide a proxy for non-linear influences (these effects have unique influences at each age, thereby indirectly allowing for non-linearity). None of the genetic and shared environmental residual parameters approached significance (and most were estimated to be zero), arguing against meaningful non-linear etiological shifts in AAB over time. However, future analyses with four time points are necessary to more fully explore this possibility.
Despite these limitations, the current findings have two important implications. First, our growth curve modeling results indicated that genetic forces were predominantly responsible for the stability of AAB from late adolescence up to mid-adulthood. Such findings highlight the importance of genetic influences on AAB, and suggest that these genetic influences are expressed prior to adulthood, at least as early as late adolescence. Future research should seek to determine the age at which genes for AAB are first activated.
Second, although the non-shared environment was once touted as the primary source of environmental effects (Plomin & Daniels, 1987), recent work has suggested that it plays a far less prominent role (Turkheimer & Waldron, 2000; Burt et al. in press). Indeed, researchers are now suggesting that, contrary to earlier predictions, much of the non-shared environment is in fact measurement error and/or idiosyncratic, transient environmental effects (Rutter et al. 1999; Turkheimer & Waldron, 2000), particularly in low-risk, unselected populations (Asbury et al. 2003; Burt et al. in press). The current results generally support this more recent conceptualization, as much of the non-shared environment was found within the unsystematic residuals.
However, our results also offer support for a more limited role for the non-shared environment, at least for those in late adolescence/ adulthood. We found that although there was only a small amount of systematic change present, much of this change was non-shared environmental in origin. Our findings are thus thought to provide evidence that the non-shared environment plays a systematic role, albeit a small one, in the development of AAB from late adolescence through adulthood. Although the current study cannot provide clues as to the specific nature of these influences, they could take the form of direct non-shared environmental influences, such as peers or spouses (Manke et al. 1995; Krueger et al. 1998), or may reflect twin-specific gene–environment interactions (Purcell, 2002), in which environmental influences activate or suppress genetic predispositions towards AAB. Future research should seek to further clarify the role of the non-shared environment on behavioral outcomes.
Acknowledgments
This research was funded by USPHS Grants DA05147, DA13240 and AA09367.
Footnotes
The notes are found on p. 37.
Identification of a quadratic parameter, in addition to the intercept, slope and residual variances requires at least four assessments. As the current sample includes only three assessments, our growth model is necessarily constrained to include only a linear slope.
Because proportions of standardized residual variance are computed using the factor loadings, they are dependent upon the ages of any specific twin pair, and thus cannot technically be calculated. We thus presented estimates calculated using the average age at assessment as the slope's factor loadings. Accordingly, these residual estimates should be considered only approximate.
The negative associations between factors preclude a precise estimation of the proportion of variance uniquely contributed by the intercept and slope factors, as proportions are necessarily computed out of 100%.
Although the overall slope is significant in women, the genetic and environmental contributions to the slope are not individually significant. Constraining both the genetic and shared environmental variance components to zero is similarly non-significant (p>0.20). However, additionally constraining the non-shared environmental paths to zero is significant (p=0.02), suggesting that non-shared environmental forces may make some contribution to systematic change in female APD.
DECLARATION OF INTEREST
None.
References
- Akaike H. Factor analysis and AIC. Psychometrika. 1987;52:317–332. [Google Scholar]
- Asbury K, Dunn JF, Pike A, Plomin R. Nonshared environmental influences on individual differences in early behavioral development: a monozygotic twin differences study. Child Development. 2003;74:933–943. doi: 10.1111/1467-8624.00577. [DOI] [PubMed] [Google Scholar]
- Bartels M, van den Oord EJCG, Hudziak JJ, Rietvald MJH, van Beijsterveldt CEM, Boomsma DI. Genetic and environmental mechanisms underlying stability and change in problem behaviors at ages 3, 7, 10, and 12. Developmental Psychology. 2004;40:852–867. doi: 10.1037/0012-1649.40.5.852. [DOI] [PubMed] [Google Scholar]
- Burt SA, McGue M, Iacono WG, Krueger RF. Developmental Psychology. Differential parent–child relationships and adolescent externalizing symptoms: cross-lagged analyses within a discordant twin design. (in press) [DOI] [PMC free article] [PubMed] [Google Scholar]
- Cronk NJ, Slutske W, Madden PAF, Bucholz KK, Reich W, Heath AC. Emotional and behavioral problems among female twins: an evaluation of the equal environments assumption. Journal of the American Academy of Child and Adolescent Psychiatry. 2002;41:829–837. doi: 10.1097/00004583-200207000-00016. [DOI] [PubMed] [Google Scholar]
- Eley TC, Lichtenstein T, Moffitt TE. A longitudinal behavioral genetic analysis of the etiology of aggressive and non-aggressive antisocial behavior. Development and Psychopathology. 2003;15:383–402. doi: 10.1017/s095457940300021x. [DOI] [PubMed] [Google Scholar]
- Haberstick BC, Schmitz S, Young SE, Hewitt JK. Contributions of genes and environments to stability and change in externalizing and internalizing problems during elementary and middle school. Behavior Genetics. 2005;35:381–396. doi: 10.1007/s10519-004-1747-5. [DOI] [PubMed] [Google Scholar]
- Hettema JM, Neale MC, Kendler KS. Physical similarity and the equal environments assumption. Behavior Genetics. 1995;25:327–335. doi: 10.1007/BF02197281. [DOI] [PubMed] [Google Scholar]
- Hewitt JK, Silberg JL, Rutter M, Simonoff E, Meyer JM, Maes H, Pickles A, Neale MC, Loeber R, Erickson M, Kendler KS, Heath AC, Truett KR, Reynolds C, Eaves LJ. Genetics and developmental psychopathology: 1. Phenotypic assessment in the Virginia twin study of adolescent behavioral development. Journal of Child Psychology and Psychiatry. 1997;38:943–963. doi: 10.1111/j.1469-7610.1997.tb01613.x. [DOI] [PubMed] [Google Scholar]
- Iacono WG, Carlson SR, Taylor J, Elkins IJ, McGue M. Behavioral disinhibition and the development of substance-use disorders: findings from the Minnesota Twin Family Study. Development and Psychopathology. 1999;11:869–900. doi: 10.1017/s0954579499002369. [DOI] [PubMed] [Google Scholar]
- Jacobson KC, Prescott CA, Kendler KS. Sex differences in the genetic and environmental influences on the development of antisocial behavior. Development and Psychopathology. 2002;14:395–416. doi: 10.1017/s0954579402002110. [DOI] [PubMed] [Google Scholar]
- Kendler KS, Neale MC, Kessler RC, Heath AC, Eaves LJ. The test of the equal-environment assumption in twin studies of psychiatric illness. Behavior Genetics. 1993;23:21–27. doi: 10.1007/BF01067551. [DOI] [PubMed] [Google Scholar]
- Krueger RF, Moffitt TE, Caspi A, Bleske A, Silva PA. Assortative mating for antisocial behavior: developmental and methodological implications. Behavior Genetics. 1998;28:173–186. doi: 10.1023/a:1021419013124. [DOI] [PubMed] [Google Scholar]
- Little RJA, Rubin DB. Statistical Analysis with Missing Data. Wiley; New York: 1987. [Google Scholar]
- Lyons MJ, True WR, Eisne SA, Goldberg J, Meyer JM, Faraone SV, Eaves LJ, Tsuang MT. Differential heritability of adult and juvenile antisocial traits. Archives of General Psychiatry. 1995;52:906–915. doi: 10.1001/archpsyc.1995.03950230020005. [DOI] [PubMed] [Google Scholar]
- Manke B, McGuire S, Reiss D, Hetherington EM, Plomin R. Genetic contributions to adolescents' extrafamilial social interactions: teachers, best friends, and peers. Social Development. 1995;4:238–256. [Google Scholar]
- McArdle JJ, Hamagami F. Structural equation models for evaluating dynamic concepts within longitudinal twin analyses. Behavior Genetics. 2003;33:137–159. doi: 10.1023/a:1022553901851. [DOI] [PubMed] [Google Scholar]
- McGue MK, Bouchard TJ, Jr, Iacono WG, Lykken DT. Behavior genetics of cognitive ability: a life-span perspective. In: Plomin R, McClearn GE, editors. Nature, Nurture, and Psychology. American Psychological Association; Washington, DC: 1993. pp. 59–76. [Google Scholar]
- Moffitt TE. Adolescence-limited and life-course-persistent antisocial behavior: a developmental taxonomy. Psychological Review. 1993;100:674–701. [PubMed] [Google Scholar]
- Moffitt TE. Life-course persistent and adolescence-limited antisocial behavior: a 10-year research review and a research agenda. In: Lahey B, Moffitt TE, Caspi A, editors. The Causes of Conduct Disorder and Serious Juvenile Delinquency. Guilford Press; New York: 2003. pp. 49–75. [Google Scholar]
- Morris-Yates A, Andrews G, Howie P, Henderson S. Twins: a test of the equal environments assumption. Acta Psychiatrica Scandinavia. 1990;81:322–326. doi: 10.1111/j.1600-0447.1990.tb05457.x. [DOI] [PubMed] [Google Scholar]
- Neale MC. Mx: Statistical Modeling. 4. Department of Psychiatry, Medical College of Virginia; Richmond, VA: 1997. [Google Scholar]
- Neale MC, McArdle JJ. Structured latent growth curves for twin data. Twin Research. 2000;3:165–177. doi: 10.1375/136905200320565454. [DOI] [PubMed] [Google Scholar]
- Plomin R, Daniels D. Why are children in the same family so different from one another? Behavioral and Brain Sciences. 1987;10:1–60. [Google Scholar]
- Purcell S. Variance components model for gene–environment interaction in twin analysis. Twin Research. 2002;5:554–571. doi: 10.1375/136905202762342026. [DOI] [PubMed] [Google Scholar]
- Reynolds CA, Finkel D, McArdle JJ, Gatz M, Berg S, Pederson NL. Quantitative genetic analysis of latent growth curve models of cognitive abilities in adulthood. Developmental Psychology. 2005;41:3–16. doi: 10.1037/0012-1649.41.1.3. [DOI] [PubMed] [Google Scholar]
- Rowe DC. Biometrical genetic models of self-reported delinquent behavior: a twin study. Behavior Genetics. 1983;13:473–489. doi: 10.1007/BF01065923. [DOI] [PubMed] [Google Scholar]
- Rutter M. Crucial paths from risk indicator to causal mechanism. In: Lahey B, Moffitt TE, Caspi A, editors. The Causes of Conduct Disorder and Serious Juvenile Delinquency. Guilford Press; New York: 2003. pp. 3–24. [Google Scholar]
- Rutter M, Silberg J, O'Connor TJ, Simonoff E. Genetics and child psychiatry. I. Advances in quantitative and molecular genetics. Journal of Child Psychology and Psychiatry. 1999;40:3–18. [PubMed] [Google Scholar]
- Scarr S, Carter-Saltzman L. Twin method: defense of a critical assumption. Behavior Genetics. 1979;9:527–542. doi: 10.1007/BF01067349. [DOI] [PubMed] [Google Scholar]
- Scarr S, McCartney K. How people make their own environments: a theory of genotype–environment effects. Child Development. 1983;54:424–435. doi: 10.1111/j.1467-8624.1983.tb03884.x. [DOI] [PubMed] [Google Scholar]
- Snyder HN, Sickmund M. Juvenile Offenders and Victims: 1999 National Report. Office of Juvenile Justice and Delinquency Prevention; Washington, DC: 1999. [Google Scholar]
- Spitzer RL, Williams JBW, Gibbon M, First MB. Structured Clinical Interview for DSM-III-R Personality Disorders. New York State Psychiatric Institute, Biometrics Research Division; New York: 1987. [Google Scholar]
- Turkheimer E, Waldron M. Nonshared environment: a theoretical, methodological, and quantitative review. Psychological Bulletin. 2000;126:78–108. doi: 10.1037/0033-2909.126.1.78. [DOI] [PubMed] [Google Scholar]
- van Beijsterveldt CEM, van Baal GCM, Molenaar PCM, Boomsma DI, de Geus EJC. Stability of genetic and environmental influences on P300 amplitude: a longitudinal study of adolescent twins. Behavior Genetics. 2001;31:533–543. doi: 10.1023/a:1013389226795. [DOI] [PubMed] [Google Scholar]
- van der Valk JC, van den Oord EJCG, Verhulst FC, Boomsma DI. Genetic and environmental contributions to stability and change in children's internalizing and externalizing problems. Journal of the American Academy of Child and Adolescent Psychiatry. 2003;42:1212–1220. doi: 10.1097/00004583-200310000-00012. [DOI] [PubMed] [Google Scholar]
- Windle M. A latent growth curve model of delinquent activity among adolescents. Applied Developmental Science. 2000;4:193–207. [Google Scholar]