Abstract
Neurons in area MT, a motion-sensitive area of extrastriate cortex, respond to a step of target velocity with a transient-sustained firing pattern. The transition from a high initial firing rate to a lower sustained rate occurs over a time course of 20 – 80 ms and is considered a form of short-term adaptation. In the present paper, we compared the tuning of the adaptation to the neuron’s tuning to direction and speed. The tuning of adaptation was measured with a condition/test paradigm in which a testing motion of the preferred direction and speed of the neuron under study was preceded by a conditioning motion: the direction and speed of the conditioning motion were varied systematically. The response to the test motion depended strongly on the direction of the conditioning motion. It was suppressed in almost all neurons by conditioning motion in the same direction and could be either suppressed or enhanced by conditioning motion in the opposite direction. Even in neurons that showed suppression for target motion in the nonpreferred direction, the adaptation and response direction tuning were the same. The speed tuning of adaptation was linked much less tightly to the speed tuning of the response of the neuron under study. For just more than 50% of neurons, the preferred speed of adaptation was more than 1 log unit different from the preferred response speed. Many neurons responded best when slow motions were followed by faster motions (acceleration) or vice versa (deceleration), suggesting that MT neurons may encode information about the change of target velocity over time. Finally, adaptation by conditioning motions of different directions, but not different speeds, altered the latency of the response to the test motion. The adaptation of latency recovered with shorter intervals between the conditioning and test motions than did the adaptation of response size, suggesting that latency and amplitude adaptation are mediated by separate mechanisms. Taken together with the companion paper, our data suggest that short-term motion adaptation in MT is a consequence of the neural circuit in MT and is not mediated by either input-specific mechanisms or intrinsic mechanisms related to the spiking of individual neurons. The circuit responsible for adaptation is tuned for both speed and direction and has the same direction tuning as the circuit responsible for the initial response of MT neurons.
INTRODUCTION
Macaque visual area MT contains neurons that respond selectively to the direction, speed and spatial position of a moving stimulus (Dubner and Zeki 1971; Maunsell and Van Essen 1983). The response of many MT neurons to motion is characterized by a high transient firing rate that settles rapidly to a lower firing rate and continues at the lower level for the duration of stimulus motion. The transition from transient to sustained firing has been shown to be a form of short-term adaptation that operates over a time course of 20 – 80 ms (Lisberger and Movshon 1999; Priebe et al. 2002). Three classes of mechanisms might mediate adaptation: input-specific mechanisms such as adaptation in the input areas or synaptic depression in the input synapses; intrinsic cellular mechanisms in MT neurons such as spike frequency adaptation; or circuit properties. In the first paper of this series (Priebe et al. 2002), we provided evidence indicating that adaptation observed in MT is not due to a similar adaptation in the inputs to MT from primary visual cortex (V1). We also ruled out a significant contribution of activity-dependent mechanisms related to spiking in the MT neuron. Because neither input-based mechanisms nor intrinsic mechanisms can account easily for adaptation in MT, adaptation is probably due to interactions between neurons within the intra-cortical circuit in MT. The goal of the present study was to provide constraints on the circuit organization that would lead to short-term adaptation.
Two fundamentally different models of intra-cortical interactions have been proposed to account for a wide range of neural response processes: untuned models in which interactions between neurons do not depend on the neurons’ preferences for a stimulus (Douglas and Martin 1991; Douglas et al. 1995; Heeger et al. 1996; Wörgötter and Koch 1991), and local models in which the interactions between neurons depend critically on the neurons’ tuning properties (Anderson et al. 2000, 2001; Kayser et al. 2001; Troyer et al. 1998). To distinguish which of these two models accounts for the short-term adaptation of MT neurons, we measured the tuning of adaptation using a condition/test paradigm. We demonstrate that the direction selectivity of adaptation is similar to the direction tuning of the recorded neuron, while the speed tuning of adaptation does not necessarily match the speed tuning of the neuron. However, adaptation was tuned for both direction and speed, indicating that it results from specific connections between neurons with narrow and defined tuning and not from connections between neurons with widely varying tuning.
METHODS
Physiological preparation
Extracellular single-unit microelectrode recordings were made in area MT of anesthetized, paralyzed macaque monkeys (Macaca fascicularis). Details of the anesthesia, surgical preparation, stimulus presentation, and recording have been explained elsewhere (Priebe et al. 2002). The locations of unit recordings in MT were confirmed by histological examination of the brain after the experiment, using methods described in Lisberger and Movshon (1999). The units included in this paper are from 35 electrode penetrations at different sites in 10 monkeys. All methods had received prior approval by the Institutional Animal Care and Use Committee at University of California, San Francisco.
Data analysis
Because of the different goals of the experiments, data analysis differed from that in the companion paper (Priebe et al. 2002). As before, we aligned the neuronal responses to multiple repetitions of the same stimulus at the onset of target motion and computed the average firing rate as a function of time in bins that were 1-ms wide. We then removed the baseline firing by subtracting the mean firing for a stationary stimulus from each bin. For conditioning/test target motions, we isolated the response to the test motion by computing the difference firing rate: response to the conditioning/test stimulus minus the response to the conditioning motion alone. For the average response to each target motion, we then determined the 32-ms interval that had the peak response and computed the mean response amplitude and standard error for this interval. For most stimuli, the 32 ms with the peak firing was also the first 32 ms of the response.
After the initial analysis, we made graphs designed to evaluate separately the tuning of the response of the neuron for speed and direction and the tuning of the adaptation for the same parameters. We evaluated response tuning in the traditional way by plotting the firing rate in the response to single target motions as a function of direction or speed and fitting with functions defined below. For the adaptation tuning, we plotted the response to each isolated test motion as a function of the direction or speed of the preceding conditioning motion and again fitted with functions defined in the following text.
Gaussian functions were fitted to the response and adaptation direction tuning of the neuron’s response and the direction tuning of adaptation using a least squares minimization algorithm in the Statistics Toolkit of Matlab version 5.3 (Mathworks)
| (1) |
where θ indicates the direction of the texture, a is the amplitude of the response, b is the preferred direction, c is the width of tuning, and d is the background firing rate. Ninety-five percent confidence intervals for the best-fitting parameter values were obtained by computing the Jacobian, a matrix that defines how changes in the parameter estimates affect the predictions of the model (Sokal and Rohlf 1995). The response and adaptation speed tuning of each neuron were estimated by fitting the data with the function
| (2) |
where Rmax is the maximal firing rate, μs is the optimal speed, s is the speed of the stimulus, σs is the tuning width, ζ is the skew of the neuron, and Rback is the background firing rate of the neuron.
For both direction and speed tuning, we evaluated the significance of the difference between response and adaptation tuning using a nested hypothesis technique (Miller 1981). First, we fitted the data for response and adaptation turning separately without constraints on the parameters. Then we fitted both with the constraint that parameters were the same in both conditions. For speed tuning, μs was constrained to be the same for both fits. For direction tuning, b was constrained to be the same for both fits. We then compared the χ2 of the constrained fit with the χ2 of the fits in which μs or b was allowed vary between the two conditions. If the likelihood ratio test indicated that χ2 was significantly smaller for the unconstrained fit (number of degrees of freedom = 1), then we concluded that the tuning of the adaptation was different from the response tuning of the neuron.
RESULTS
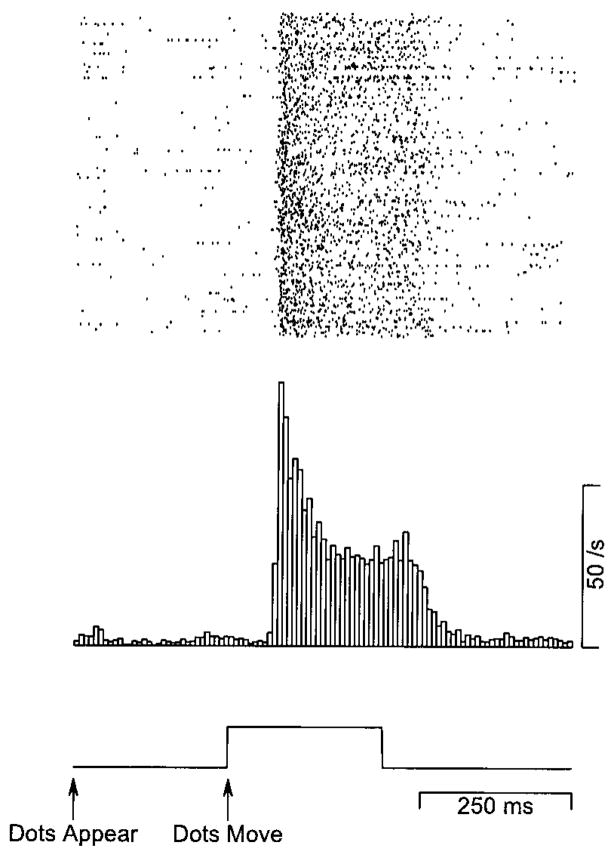
The response of many neurons in area MT to steps of target speed contains a short period of high firing followed by a period of lower sustained firing. For example, the neuron illustrated in Fig. 1 fired at a rate that peaked at 80 spikes/s for a brief period of time after the motion of the texture began and then settled within 50–100 ms to a lower sustained firing rate of about 40 spikes/s. Inspection of the rasters at the top of Fig. 1 shows that the transient reflects the consistent presence of several spikes at the onset of the response and not simply the temporal synchrony of the first spike in the response.
FIG. 1.
The response of a typical MT neuron to a step of stimulus velocity. The raster shows the response of an example MT neuron to 265 repetitions of the same stimulus. The histogram shows the time course of the average response of the neuron with a binwidth of 8 ms. The trace below the histogram shows the time course of stimulus speed.
Use of a condition/test paradigm has demonstrated that the transition from transient to sustained response results from short-term adaptation that recovers over a time course of about 125–250 ms (Lisberger and Movshon 1999; Priebe et al. 2002). To assess the direction and speed tuning of adaptation, we adapted the condition/test paradigm used in these prior studies. The test motion consisted of a 64-ms pulse of stimulus motion of the direction and speed that drove the largest response of the neuron. The conditioning motion was a similar pulse presented in the same spatial location as the test motion but of a direction or speed that was varied systematically.
In principle, the tuning of adaptation could take three forms. In the first form, the neuron’s adaptation tuning is the same as the response tuning so that the response to test motion is reduced most when the response to the conditioning motion alone is the largest and is not reduced at all when the conditioning motion alone causes no response in the neuron. In the second form, the adaptation is present but is not tuned so that conditioning motion of any direction or speed causes the neuron to have a reduced response to subsequent test motion. In the third form, adaptation is tuned, but the tuning is different from the response tuning of the neuron. We test these three possibilities below for the direction and speed tuning of adaptation in MT neurons. Each of these different forms of adaptation tuning puts constraints on the type of the cortical circuit underlying adaptation. If adaptation is tuned, then the connectivity of local circuits in area MT must be based on the tuning of the neurons. If adaptation is untuned, then the connectivity in the circuit is not constrained by the tuning properties of the neurons.
Direction tuning of adaptation
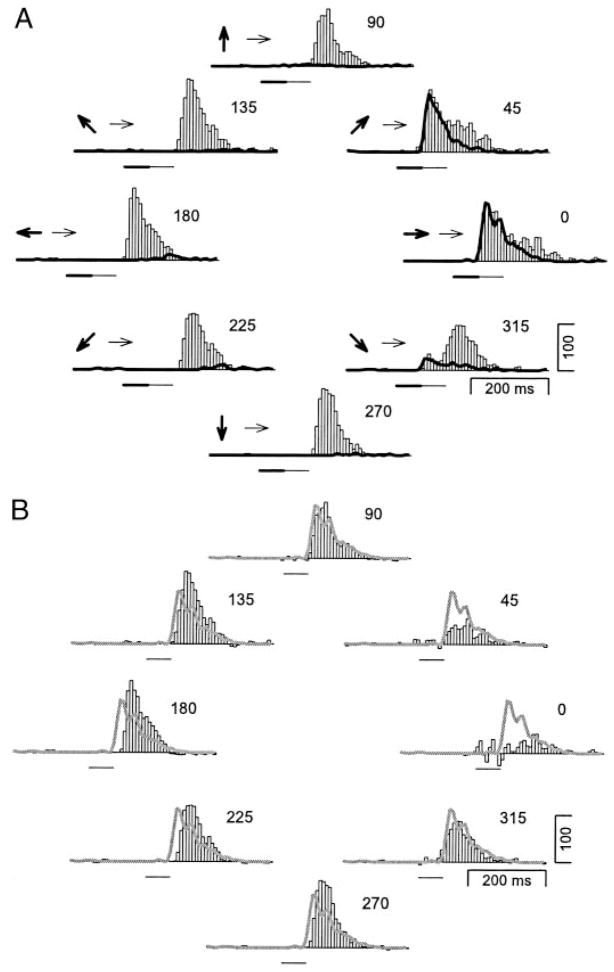
The direction selectivity of adaptation was measured in 96 neurons in macaque area MT by varying the direction of the conditioning motion, while the test motion was always in the neuron’s preferred direction. An example of a typical response profile of one neuron is shown in Fig. 2A. The histograms were rotated so that the direction to which the neuron responded best is shown as the rightward direction, a convention used throughout this paper. Each histogram shows the response of the neuron to conditioning motion in one of eight directions (shown by bold arrows) followed by motion in the test direction (shown by fine arrows). In each histogram, the bold lines show the response to the conditioning motion presented alone, revealing the neuron’s response was highly tuned for direction. The neuron responded well to conditioning motion in the 0 and 45° directions, slightly to conditioning motion in the 315° direction, and showed only a small rebound response at the end of conditioning motion in the other directions.
FIG. 2.
Adaptation direction tuning of a typical MT neuron. A: each histogram shows the response of a neuron to conditioning/test motion. The thin arrows indicate the direction of the test motion, which was always rightward. The bold arrows indicate the direction of the conditioning motion, which was varied systematically. The direction is also indicated by the placement of the histogram in the figure and the numbers at the top right of each histogram. The bold and fine horizontal lines beneath each histogram indicate the time and duration of the conditioning and test motions, respectively. The bold trace superimposed on each histogram indicates the response of the neuron to each conditioning motion alone. B: each histogram shows the result of subtracting the response of the neuron to conditioning motion from the responses to both conditioning and test motion. The organization of the figure is the same as in A. The thick gray trace on each histogram shows the response of the neuron to the test motion alone.
Three effects of conditioning motion in different directions were revealed by comparison of the response to the test motion alone (continuous gray trace in Fig. 2B) with the response to the test motion after conditioning motion, isolated by subtracting the response to the conditioning motion from the response to condition/test motion (histograms in Fig. 2B). First, the conditioning motions that evoked large responses in the neuron (0 and 45° conditioning motions) caused large reductions of the response to the subsequent test motion. Second, when the conditioning motion was opposite the test motion, the response to the test motion was enhanced relative to the response to the test motion alone. As the direction of the conditioning motion approached the test direction, its effect on the response to subsequent test motion changed smoothly from enhancement for conditioning motion in the 180° direction to suppression for conditioning motion in the 0° direction. Third, conditioning motions that caused an enhancement of the response to subsequent test motion also caused an increase in the latency of response.
To quantify the direction tuning of adaptation, we measured the amplitude of the isolated response to the test motion for each direction of conditioning motion. To ensure that our measures of response amplitude were not affected by the latency effects mentioned in the previous paragraph, we measured the peak 32 ms of firing rate for each response during a fixed 100-ms window after the previously determined response latency for each neuron. Thus we adjusted the exact time of the measurement to compute the peak firing of each response but restricted the peak to occur in a consistent wider interval across trials. To compare neurons with different firing rates, we normalized the amplitude of the response to the test motion after conditioning motion by dividing by the response amplitude to test motion alone.
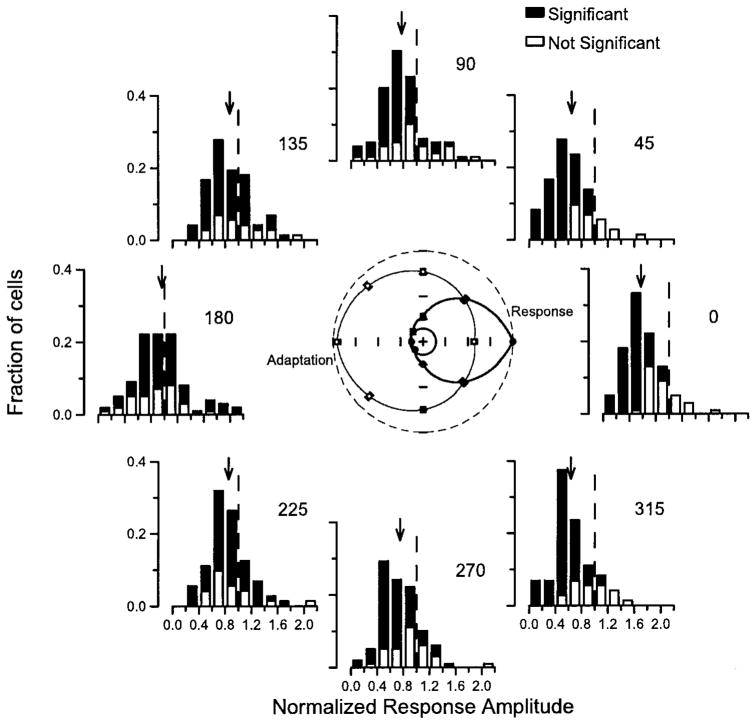
To compare the adaptation and response direction tuning, we then used three approaches. In the first approach, we constructed histograms of the normalized response amplitude for all of the neurons in our sample population as a function of the direction of conditioning motion after rotating the adaptation tuning so that the preferred response direction was to the right (Fig. 3). When the conditioning motion was in the same direction as the test motion (Fig. 3, 0°), almost all the neurons showed some suppression, and the mean test response amplitude was 57% of response to test motion alone. Although a few neurons were unaffected by conditioning motion in their preferred direction, most showed clear adaptation. At the other extreme, conditioning motion in the anti-preferred direction (Fig. 3, 180°) caused little change in response to the test stimulus on average, but many individual neurons showed large amounts of suppression or enhancement. As the direction of conditioning motion moved around the circle of histograms in Fig. 3 from the anti-preferred direction (180°) to the preferred direction (0°), the distribution of the adaptation in the population of MT neurons changed gradually from balanced enhancement and suppression of the response to the test motion to primarily suppression. The Rayleigh test for circular uniformity revealed that 68% of the neurons we recorded had statistically significant direction tuning to their adaptation (P < 0.05, filled bars in Fig. 3). Some of the neurons with significant adaptation direction tuning still plotted with normalized response amplitudes near 1.0 in some of the histograms in Fig. 3; this is expected because the existence of significant tuning indicates zero adaptation for some directions and large adaptation for others.
FIG. 3.
Summary of the direction tuning of adaptation for our sample of MT neurons. Each histogram of the figure shows the distribution of the normalized response amplitude for conditioning motion in a given direction. For each neuron, the test direction is plotted to the right. The position of the histograms in the plot and the numbers at the top right of each histogram indicate the angle between the direction of conditioning motion and preferred response direction. Filled and open histogram bars indicate data from neurons that did or did not show significant modulation of the adaptation by to the direction of the conditioning motion. The arrows point to the mean amplitude of response to the test stimulus for each conditioning direction. The vertical dashed lines indicate a normalized response of 1.0, which is the value expected in the absence of adaptation. In the polar plot in the center of the figure, the filled symbols show the mean normalized response to single stimuli in each direction, and the open symbols plot the mean response to test motion following conditioning motions in each direction. The dashed circle shows a normalized response of 1.0.
The second approach we used to compare response and adaptation direction tuning was to average across the population, after rotating both the response and adaptation tuning curves for each neuron so that the preferred response direction was rightward (Fig. 3, polar graph). The resulting averages of the response (filled symbols) and adaptation (open symbols) direction tuning confirm that the average response to a test stimulus was smallest when the conditioning motion moved in the preferred response direction. The bandwidth of the population response tuning was narrower than that of the adaptation tuning: the widths of the average tuning at half height were 53 and 81°, respectively.
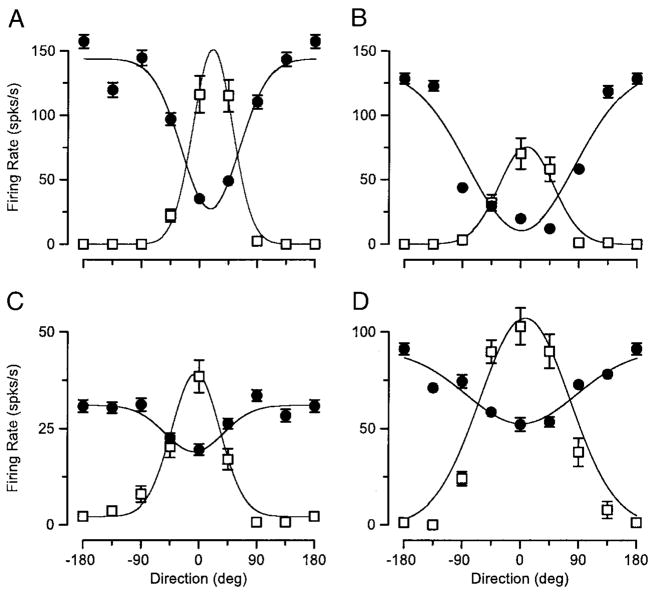
The third approach we used to compare the response tuning and adaptation tuning was to fit the responses of each individual neuron with Gaussian functions (Fig. 4). In each of the four example neurons in Fig. 4, the response direction tuning (□) and the adaptation direction turning (●) were fitted by functions with very similar centers but different polarities. The adaptation tuning curves were inverted because the graph shows the amplitude of the response to the test motion after conditioning motion in different directions, and adaptation caused suppression when conditioning and test motions were both in the direction of the test motion (0°), which was close to the neuron’s preferred direction. Figure 4, C and D, shows examples where the effect of conditioning motion was suppressive only, whereas A and B show examples where adaptation was enhancing or suppressive for conditioning motion in the anti-preferred or preferred direction of the neuron under study. However, even for the neurons that showed purely suppressive adaptation, the adaptation was largest for conditioning motion in the same direction as the test direction and smallest for conditioning motion opposite the test direction.
FIG. 4.
Comparison of response and adaptation tuning in 4 example MT neurons. Each graph plots firing rate as a function of direction. □, the responses to single presentations of motion in the direction indicated by the abscissa. ■ and ●, the responses to test motion at 0° after conditioning motion in the direction indicated by the abscissa. —, the Gaussian functions that provided the best fit to the response and adaptation tuning. Error bars for each data point indicate SE.
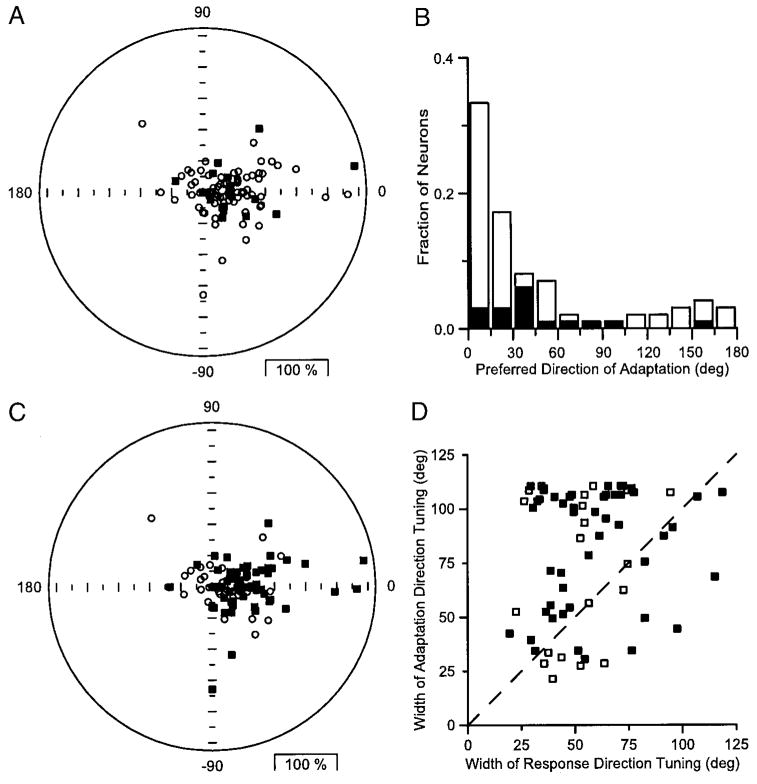
We then used the parameters of the Gaussian functions fitted to the response and adaptation tuning as indices of the preferred directions and tuning widths for comparison of these two forms of direction tuning. For example, Fig. 5, A and C, has polar plots where each symbol plots the response of one neuron: the same points appear in each plot, but the meaning of the symbols is different. Each symbol represents the end of a vector where the length and angle of the vector give the size of the adaptation and the difference between the response and adaptation preferred directions, respectively. Although some neurons plotted with an angle of zero, indicating that the response and adaptation preferred directions were the same, many plotted at nonzero angles. Use of the nested-hypothesis technique described in METHODS revealed that the adaptation and response preferred directions were significantly different in only 17 of the 96 neurons we studied (filled symbols in Fig. 5A). A plot of the distribution of the preferred direction of adaptation relative to the preferred response direction (Fig. 5B) reveals that the majority of neurons (73%, 70 of 96) showed preferred adaptation directions within 45° of the direction of the test. The distribution shows a small cluster of neurons near 30–45° that had significantly different preferred directions for response and adaptation tuning (■). Thus most but not all MT neurons have the same preferred direction for both adaptation and response.
FIG. 5.
Comparison of the response and adaptation direction tuning across the population of neurons. A and C: polar plots where each point represents the response of one neuron and is plotted at the end of a vector. The length of the vector indicates the amplitude of adaptation, normalized by the response to the test motion alone, and the angle indicates the preferred direction of adaptation. The same data are plotted in each graph, but the meaning of the symbols differed. In A, ■ and ○, neurons in which the preferred direction of adaptation and response tuning were and were not significantly different using the nested hypothesis technique. In C, ■ and ○, neurons for which the directional amplitude of adaptation was and was not significant, using Raleigh’s test (P < 0.05). B: histogram showing the distribution of preferred adaptation directions for the full sample of neurons. The direction of the test motion was rotated to be 0° for all neurons. ■ and □, neurons in which the preferred direction of adaptation and response tuning were and were not significantly different, using the nested hypothesis technique. D: comparison of the fit values of the SD of the adaptation tuning curves plotted as a function of that for the response tuning curves. - - -, slope of 1; obtained if the response and adaptation tuning had the same tuning widths. The ■ and □, neurons with and without statistically significant adaptation tuning, as assessed by Raleigh’s test.
Figure 5C plots the same data as A, but now ■ represents neurons with statistically significant direction tuning of adaptation based on the Rayleigh test described in the preceding text. All of the neurons with significant adaptation direction tuning had preferred directions of adaptation within 90° of the direction of the test motion. In contrast, the 26 neurons that lacked statistically significant adaptation direction tuning (Fig. 5C, □) had small amounts of adaptation and were distributed fairly uniformly in all directions around the polar plot. Comparison of the width of adaptation and response tuning (Fig. 5D) reveals that the SD of the fitted Gaussian is larger for the adaptation tuning in 78% (51/65) of the neurons with statistically significant adaptation (Fig. 5D, ■). Note that the use of a Gaussian function to fit data on a circular abscissa limits the SD of the Gaussian to 110°. The points in Fig. 5D seem to be constrained by this limit for the width of the adaptation tuning (y axis), but not for the width of the response tuning (x axis), consistent with the finding that adaptation tuning is wider than response tuning.
One shortcut taken during data collection raises an issue that needs to be addressed. In most neurons, the preferred direction of the neuron as determined by the Gaussian functions fitted to the response direction tuning was slightly different from the test direction actually used in the experiments. Because the criterion to pick the direction of test motion was simply the direction that elicited the best response, and no fits were done while the experiment was being performed, this difference could be as large as 22.5°. Even if adaptation and response tuning actually had the same preferred direction, it is not clear a priori whether adaptation tuning using our approach should be maximal for conditioning motion in the direction of test motion or in the preferred response direction of the neuron. We evaluated this concern by measuring the correlation of two residuals: the differences between the direction of test motion and the preferred response direction of each neuron and the preferred directions of adaptation and response tuning. We found no significant relationship [principal components analysis, (Sokal and Rohlf 1995), P = 0.57], implying that this potential concern did not have a serious impact on our results. Principal components analysis was used because its results do not depend on whether both residuals were dependent variables: standard linear regression would not be valid.
Speed tuning of adaptation
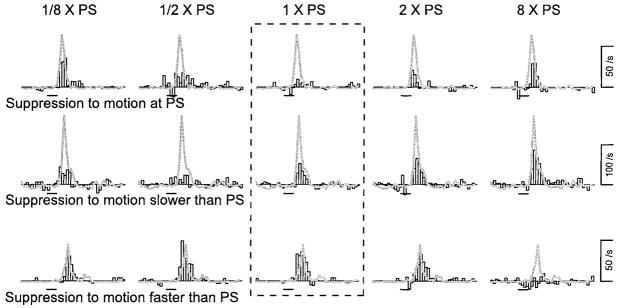
The speed selectivity of adaptation was measured in 88 neurons in area MT, using the same protocol and data analysis used to measure the direction tuning of adaptation, except that the directions of conditioning and test motion were fixed and identical, while the speed of the conditioning motion varied. Figure 6 shows three examples of the effect of varying the speed of conditioning motion on the isolated response to test motion assessed, as before, by subtracting the response to the conditioning motion from that to conditioning/test motion. The neuron in the top row shows a similar trend to that observed for direction tuning: the adaptation and response tuning were similar. The response to test motion was suppressed most when the conditioning motion was at the same speed, which was near the preferred speed (PS) of the neuron (1 × PS). When the conditioning speed was higher or lower than the preferred speed of the neuron, the response to the test speed was suppressed less than when the conditioning motion moved at the neuron’s preferred speed.
FIG. 6.
The speed tuning of adaptation in 3 example neurons. Each row shows the responses of a different neuron. Each histogram plots the different firing rate that isolates the response to test motion delivered after different conditioning motions. The solid gray traces superimposed on the histograms show the responses to test motion without preceding conditioning motion. The fractions given above each column indicate the speed of conditioning motion as a multiple of the preferred response speed of the neuron. The dashed rectangle surrounds the histograms that show the adaptation produced by conditioning motion of the same speed and direction as the test motion. The horizontal bars beneath each histogram indicate the time of the test motion. The duration of motion was 64 ms for both the conditioning and test motion. The binwidth of the histograms was 16 ms.
The other two neurons illustrated in Fig. 6 showed adaptation tuning that was quite different from their response tuning. For the neuron in the second row, the response to test motion at the neuron’s preferred speed was suppressed most when conditioning motion was slower than the preferred speed and was suppressed only slightly when the conditioning speed was eight times faster than the preferred speed. The neuron in the bottom row showed the opposite trend: conditioning motion faster than the test motion reduced the response to the test motion, whereas motion slower than the test speed did not have an obvious effect on the response to the test motion. Surprisingly, when conditioning and test motion were at the same speed, little adaptation was found. If we are correct that the adaptation probed by our condition/test experiments underlies the transition from transient to sustained firing of MT neurons, then the neuron illustrated in the bottom row should show transient responses to steps of target speed only when the speed is well above preferred speed. In fact, this neuron did not show transient responses over the range of speeds that evoked large responses, but its response was so weak at eight times preferred speed that it was not possible to assess the presence of a transient response.
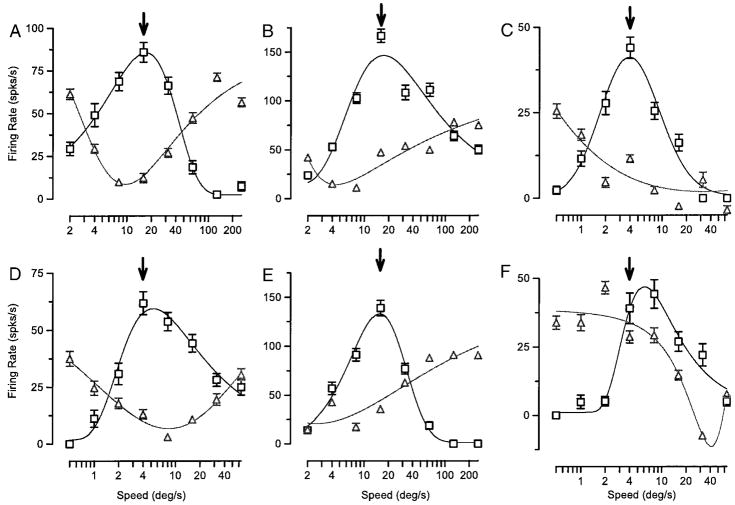
In our population of neurons, the speed tuning of adaptation could be either the same as or different from the response speed tuning. Figure 7 shows quantitative assessments of the response and adaptation speed tuning for 6 example neurons from our sample of 88 neurons. The two neurons in the top left column (Fig. 7, A and D) had adaptation (triangles) and response (squares) speed tuning that preferred very similar speeds. The continuous curves, obtained by fitting the respective tunings using Eq. 2, generally provided an excellent description of the data. The two neurons in the middle column (Fig. 7, B and E) showed adaptation tuning with preferred speeds much lower than those for the response speed tuning. The two neurons in the right column (Fig. 7, C and F) show opposite examples where the largest adaptation was induced by conditioning motion at speeds greater than the test speed. For the neurons in the right and middle columns of Fig. 7, the responses to test motion near preferred speed were suppressed most by conditioning motion that, presented alone, did not elicit large responses.
FIG. 7.
Quantitative comparison of response and adaptation speed tuning for 6 example neurons for the speed conditioning/test experiment. Empty square, the response tuning of the neuron to single presentations of motion for each speed; empty triangle, the response of the neurons to the test motion plotted as a function of the speed of the preceding conditioning motion. Arrows, the speed of the test motion. Black and gray curves, the functions that fitted the response and adaptation speed tuning best, derived from Eq. 2. Error bars for each data point indicate the SE.
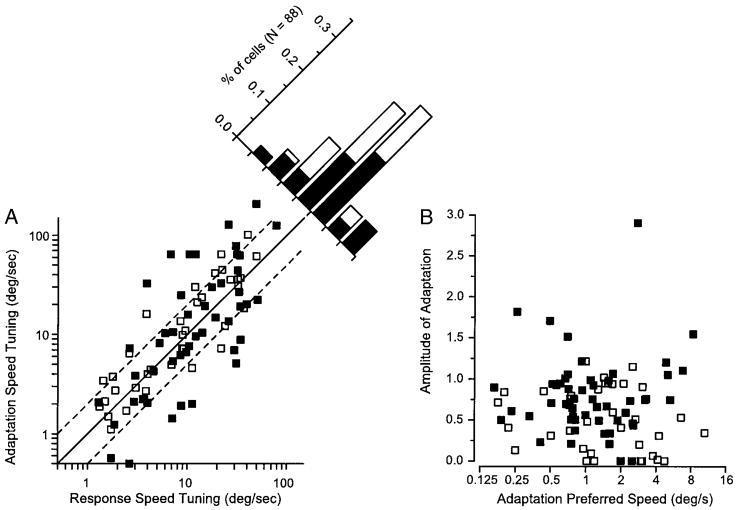
To quantify the differences between the response speed tuning and the adaptation speed tuning, we used the parameters of the equations that fitted the response and adaptation tuning curves (Eq. 2). In particular, Fig. 8 compares the values μs: the peak speed of the response tuning and the conditioning speed that elicited the greatest suppression for the adaptation tuning. Across the population there was a positive relationship between the preferred speeds of adaptation and response: principal components analysis (used for reasons given in the preceding text) yielded a regression slope of 1.13. For 49% (43/88) of the neurons, the preferred speed of the adaptation was within 1 log unit of the preferred speed of the neuron to single presentations of motion (Fig. 8A, points between the oblique dashed lines). However, the slim majority of neurons showed adaptation speed tuning that was different from their response speed tuning by more than a log unit and therefore lay outside the region defined by the oblique dashed lines. Figure 8A shows that the distribution of the ratio of the preferred adaptation and response speeds was broad and skewed slightly toward adaptation preferred speeds that were greater than response preferred speeds.
FIG. 8.
Quantitative comparison of the response preferred speed and adaptation preferred speed. A: each square shows data from 1 neuron and plots the preferred speed of adaptation vs. the preferred speed of the neuron for single presentations of motion. The filled and open squares indicate fits for which the preferred speed of the adaptation tuning was or was not significantly different from the preferred speed of the response tuning, respectively. The solid line indicates a slope of 1, while the 2 dashed lines would have slopes of 2 and 0.5 in linear coordinates. The histogram in the top right corner indicates the distribution of the ratios of response preferred speed to adaptation preferred speed. The filled and open bars indicate neurons whose adaptation preferred speed were and were not statistically different from the response preferred speed. B: each square again shows data from 1 neuron. The y axis plots the amplitude of adaptation, defined as the fitted value of Rmax in Eq. 2 divided by the response of the neuron to the test motion alone. The x axis plots the preferred speed of adaptation. Filled and open squares indicate fits for which the amplitude of adaptation was and was not statistically significant by the criterion that the 95% confidence intervals for Rmax were above 0 spikes/s.
The analysis in Fig. 8 excludes two possible explanations for a difference between response and adaptation preferred speeds. First, Fig. 8B shows that the amplitude of the adaptation, measured by the modulation of firing due to the speed of the conditioning motion, Rmax in Eq. 2, was not related to the ratio of preferred adaptation to response speeds. Thus the neurons with weak adaptation were not the ones that had adaptation tuning different from response tuning. Second, statistical testing excluded the possibility that neurons with adaptation tuning different from response tuning had poor fits due to variable data. The nested hypothesis statistical testing approach (see METHODS) revealed that the difference in adaptation and response tuning were highly significant (P < 0.05) in many of the neurons in which preferred speed for response and adaptation differed by more than a log unit (filled symbols in Fig. 8).
There are two additional reasons why the preferred speed of adaptation might be slightly faster than the test speed. First, the initial transient firing of MT neurons is tuned to speeds faster than the later sustained firing (Lisberger and Movshon 1999). We used a test speed derived from the sustained response and not the transient response. Second, the speed tuning of MT neurons in area MT depends on the duration of the stimulus presentation to a greater extent than predicted from the speed tuning of the transient response. When the duration of a stimulus is reduced, the speeds that elicit responses are faster than when the stimulus duration is long (unpublished observations). However, the effect of stimulus duration on speed tuning is generally observed only for stimulus durations less than 48 ms (unpublished data), while our stimuli were 64 ms or longer. Further, neither of the latter two reasons would account for neurons in which adaptation was tuned for slower speeds than the response.
Relationship between speed tuning of adaptation and sensitivity to target acceleration
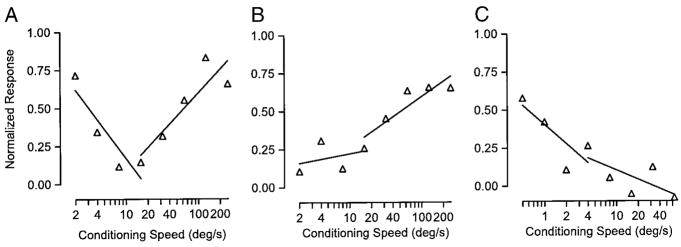
Because the response of many MT neurons to a given stimulus depends on the recent history of the speed of motion, these neurons may be sensitive to target acceleration over a range of target speeds. For example, a neuron would provide information about stimulus deceleration if it responds best when faster motion precedes its preferred speed. In our condition/test experiments with different speeds of conditioning motion, there was acceleration or deceleration in the stimulus when the conditioning motion was slower or faster than the test motion. To evaluate this issue for our sample of neurons, we conducted linear regression on the adaptation tuning data, grouping the points separately for conditioning speeds above and below the test speed. Many neurons (e.g., Fig. 9A) did not respond consistently to acceleration or deceleration but were suppressed the least when the target was either accelerating or decelerating away from preferred speed. However, there was a considerable sample of neurons like those in Fig. 9, B and C, which gave the best responses for acceleration (B) or deceleration (C), respectively.
FIG. 9.
Examples of MT neurons with adaptation tuning that could encode target acceleration. Three different neurons that have different sensitivities to changes in stimulus speed. Symbols indicate the normalized response to test motion as a function of the speed of the preceding conditioning motion. The lines in each graph show the result of linear regression of normalized response on the log of conditioning speed, where the 2 lines were obtained separately for conditioning speeds either lower or higher than the test speed. A: the slopes of lines for slower and faster speeds were −0.18 and 0.15. B: the slopes of the lines were 0.03 and 0.10. C: the slopes of the lines were −0.13 and −0.06.
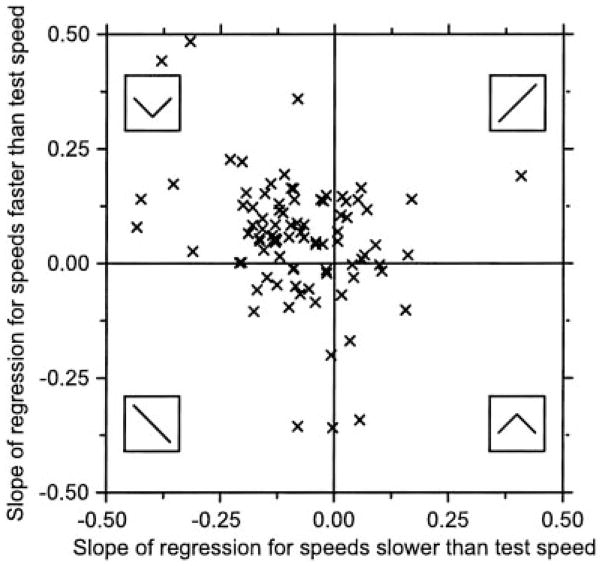
We summarized the response of our population in these terms by plotting the slope of the regression lines for conditioning speeds faster than test speeds as a function of those for conditioning speeds slower than test speeds (Fig. 10). The majority of the neurons in our population (47/88) are located in the top left quadrant, indicating that they were the most suppressed by target motion that was constant at preferred speed and least suppressed by motion with either large accelerations or decelerations, like the example shown in Fig. 9A. A small number of neurons are plotted in the bottom right quadrant (8/88), indicating that they responded best when the target moved at the test speed, without acceleration or deceleration. The remaining neurons plotted in either the top right quadrant (16/88) or the bottom left quadrant (17/88), indicating that they responded best when the target was accelerating or decelerating, respectively.
FIG. 10.
Group data indicating the distribution of MT neurons in a space that parameterizes their potential to encode target acceleration. Each symbol plots the response of 1 neuron and shows the slope of the regression line for speeds slower than test speed vs. that for speeds higher than the test speed. Insets: the form of the adaptation speed tuning regression for each of the 4 possible combinations of positive and negative slopes.
Adaptation of the latency of responses to test motion
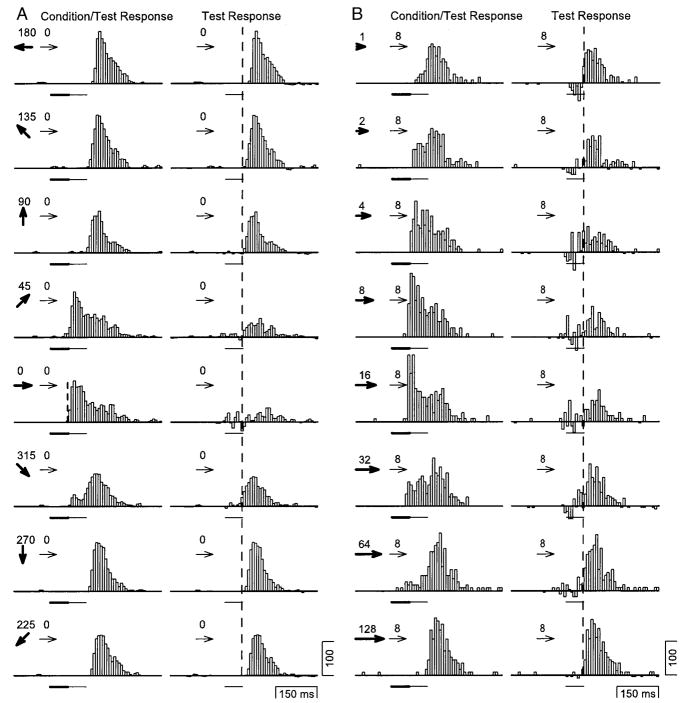
Conditioning motion caused a shift in the latency of the response to test motion that depended on the direction of the conditioning motion (Fig. 11A) but not on its speed (Fig. 11B). As before, we isolated the response to the test motions (Fig. 11, A and B, right) by subtracting the response to the conditioning motion from the response to the conditioning/test motion (i.e., Fig. 11, A and B, left). Inspection of the isolated responses to test motion in the right column of Fig. 11A reveals that the latency varied as a function of the direction of conditioning motion. For conditioning motion near the direction of the test motion, the latency was unaffected and the attenuated response of the neuron started near the vertical dashed line in the right column, which is positioned at the same latency as the response to test motion in the left column (5th histogram down). However, when the direction of the conditioning motion was more than 90° different from the test motion, the latency grew gradually, reaching a maximum for conditioning motion in the opposite direction from test motion. In contrast, conditioning motion at different speeds in the same direction as the test motion altered the amplitude, but not the latency of the response to test motion (Fig. 11B). For this neuron, adaptation was most effective when the conditioning speed was the same as the test speed (8°/s), whereas conditioning motion with much higher or lower speeds altered neither the amplitude nor the latency of the response to test motion.
FIG. 11.
The effect of adaptation on the latency of the response to test motion for conditioning motions of different directions (A) or speeds (B). In each panel, the left column of histograms shows the responses to conditioning/test stimuli and the right column shows the isolated responses to the test motion alone. The bold and thin horizontal lines under the histograms indicate the time and duration of the conditioning and test motion, respectively. The vertical dashed line in the right column indicates the latency of the response to test motion without preceding conditioning motion. In A, the bold and thin arrows, and the numbers next to them, indicate the directions of the conditioning motion and test motions. In B, the numbers next to the bold and thin arrows indicate the speeds of the conditioning and test motion. Both the conditioning and test motion were 64 ms in duration. The bin size for all histograms was 8 ms.
To quantify the effect of direction of conditioning motion on latency, we estimated the latency of the response to test motion by eye for each difference histogram of each neuron. For the neuron illustrated in Fig. 11A, the latency of response depended strongly on the direction of the conditioning motion when the interval between the end of conditioning motion and the start of test motion (CTI) was 0 ms (Fig. 12A, □), and the effect was maximal when the conditioning motion was in the direction opposite the test direction. As the CTI was increased to 32 and 64 ms, the effects of adaptation on latency decreased and then disappeared. Although the effects of the conditioning motion on latency were basically nonexistent when CTI was 64 ms, there was still a large effect of the direction of conditioning motion on the amplitude of the neuron’s response to test motion as seen for the same neuron in Fig. 2 of our companion paper (Priebe et al. 2002). The same effect was found in averages of the latency of the response to test motion for the 49 neurons in our population that provided good enough data so that we were able to measure the latency (Fig. 12B). Motion in the direction opposite the test motion always induced an increase in the latency of response, and the effect of conditioning motion on response latency decreased as a function of CTI. Finally, the amplitude of adaptation (a in Eq. 1) had no relationship to the size of the shift in latency caused by conditioning motion in the direction opposite the test motion (Fig. 12C). Similar analysis failed to reveal any effect of the speed of the conditioning motion on the latency of the response to test motion (data not shown).
FIG. 12.
The time course of recovery of adaptation of the latency of responses to test motion. A: each symbol plots the latency of the isolated response to test motion as a function of the direction of the preceding conditioning motion. □, ○, and △, data for conditioning/test intervals of 0, 32, and 64 ms, respectively. Data represent the analysis of the neuron illustrated in Fig. 14A. B: averages across the sample population, plotted exactly as in A. Error bars show SDs. C: the shift in latency for conditioning motion in the nonpreferred response direction is plotted as a function of the amplitude of adaptation, estimated as the amplitude of the Gaussian function fitted to the adaptation direction tuning. Each symbol shows the response of a different neuron.
DISCUSSION
The responses of many MT neurons to motion are characterized by a short transient response followed by a continuous sustained response. The transition from transient to sustained response is a manifestation of a form of short-term adaptation that is related to the motion of the stimulus and that operates on a time scale of 30–100 ms (Lisberger and Movshon 1999). This is the second of a pair of companion papers in which we report experiments designed to use extracellular recording of single units to place constraints on the adaptation mechanism underlying the transient responses of MT neurons. We set out to consider three classes of mechanisms that might be responsible for adaptation. 1) Input-specific mechanisms: adaptation in MT simply could be inherited from adaptation already present in the firing of its inputs or could be created by short-term depression in the synapses that transmit those inputs to MT. 2) Intrinsic spiking mechanisms of individual neurons: many excitatory cortical neurons exhibit spike frequency adaptation for a step of input current so that the response consists of a transient that decays to a lower sustained firing rate. 3) Circuit properties: adaptation might result from processing within MT or as feedback from areas that are higher in the hierarchy of visual motion processing. In the companion paper (Priebe et al. 2002), and also in the present paper, we have provided evidence that opposes the predictions of input-specific mechanisms of adaptation or mechanisms based on the intrinsic activity of the neuron. Thus our evidence supports the hypothesis that circuit properties in MT are responsible for the adaptation. Further, the specific tuning of the adaptation mechanism provides some constraints on the organization of the local adaptation circuitry.
Circuit mechanisms of adaptation must, of course, be mediated by cellular mechanisms, principally synaptic transmission. But, we wish to draw two distinctions. First, adaptation based on circuit mechanisms results from neurons other than the one that is being adapted. Second, the properties of adaptation based on circuit mechanisms, especially its spatial, directional, and speed tuning, result from the properties of the neurons that provide the adapting inputs. For the example of adaptation we have been studying, we are suggesting that the neurons providing the adapting inputs reside in MT, and our data outline what their response properties must be.
Mechanisms of adaptation
It is not possible to prove the mechanism of adaptation using extracellular recording of action potentials so that constraints are provided primarily by exclusion: by the accumulation of evidence that is inconsistent with certain mechanisms. Thus we come to the conclusion that circuit organization is responsible for short-term adaptation in MT by providing evidence that is difficult to explain based on the other alternatives, which are input-specific mechanisms and intrinsic spiking mechanisms.
Input-specific mechanisms are rendered unlikely by the observation in the present paper of examples in which the speed tuning of adaptation is different from the response tuning. If the adaptation was provided by input-specific mechanisms, then the simplest prediction is that adaptation tuning and response tuning would be the same unless the mechanism of adaptation includes some extreme nonlinearities. This conclusion builds on the data in the companion paper (Priebe et al. 2002), which argued against input-specific mechanisms on the basis that adaptation was on a spatial scale the size of an MT cell. If adaptation were provided by input-specific mechanisms operating on inputs from the primary visual cortex, then we would expect the spatial scale of adaptation to correspond with the smaller size of the input receptive fields from areas such as the primary visual cortex.
Three findings add to the evidence from our earlier study (Priebe et al. 2002) that an intrinsic spike-based mechanism for adaptation such as spike-rate adaptation (Connors and Gutnick 1990; McCormick et al. 1985) cannot account for the observed adaptation. First, the adaptation direction tuning is broader than the response direction tuning. Further, we found a number of examples of conditioning motion that caused adaptation without creating any response at all. Second, the adaptation mechanism not only reduced the responses of many neurons but could also increase the responses of the neurons to test motion. Enhancement of the neural responses to test motions would be difficult to attribute to an intrinsic spiking mechanism of adaptation when the background firing rate of neurons is low or zero as is the case for many MT neurons. Third, we observed that the preferred speed of adaptation could be different from the preferred speed of the neuron to single presentations of motion. A difference between the tuning curves for adaptation and response could be accounted for only by a highly nonlinear relationship between the amount of activity in a neuron and the amount of adaptation it causes. If the relationship was monotonic, then an intrinsic activity-based mechanism would elicit the most suppression for the conditioning motions that most excited the neuron and the tuning curves of adaptation and response would be very similar as they are for direction. Intracellular recordings would be required evaluate the possibility that adaptation is controlled by the subthreshold voltage and conductances of the neuron rather than by the supra-threshold activity that we actually measure. To account for our data, however, adaptation based on subthreshold events in neurons would require an unlikely scenario in which the sub-threshold events were strongly tuned, but with preferred speeds different from those manifest in the supra-threshold spiking activity.
As an explanation that is compatible with all of our data, we propose that short-term adaptation in MT neurons is based on the organization of the local neural circuit in area MT. Further, by revealing the tuning properties of adaptation, our data suggest a hypothesis about the organization of the neural circuits in MT that create adaptation. Because adaptation is tuned for speed, direction, and spatial position, we know that the adapting inputs come from specific neurons rather than from all neurons without regard for their tuning (Carandini et al. 1997; Heeger et al. 1996; Simoncelli and Heeger 1998). Because the spatial and direction tuning of adaptation is the same as that of the response to single test motions, we suggest that adaptation arises from a local circuit comprising neurons with similar direction and spatial tuning. However, because the preferred speed of the neuron was not tightly linked to the adaptation speed tuning, we conclude that the circuit is composed of neurons with varied speed tuning but with unity of direction and spatial tuning.
Multiple mechanisms of adaptation?
Our data demonstrate three different expressions of adaptation: suppression of the response to test motion, enhancement of the response to test motion, and changes in the latency of the response to test motion. The shifts in latency were strongest in the direction opposite the test direction, but the presence of latency shifts was not tightly linked to the changes in response amplitude induced by adaptation. Latency effects recovered much more quickly than did amplitude effects as the interval between conditioning and test motions was increased and as the direction of the conditioning motion because closer to the preferred response direction of the neuron. On the basis that they operate over different time courses, we propose that the latency and amplitude effects are manifestations of different mechanisms. However, our data do not provide a strong basis for deciding whether the suppression and enhancement of responses to test motion are the result of a single mechanism or two mechanisms with opposite direction tuning. We favor the former possibility because of the consistent out-of-phase relation between the preferred response and adaptation directions.
Links to previous studies
Other groups have examined the source of short-term adaptation in V1 and have found some similarities and some differences with our findings in MT (Kulikowski et al. 1979; Nelson 1991a–c). V1 neurons respond with a transient period of high firing that decreases to a lower sustained response when stimulated with a flashed bar (Kulikowski et al. 1979). Using a condition/test paradigm similar to ours, Nelson (1991a) showed that the response to a test bar of the preferred orientation was suppressed by a conditioning bar flashed in the same orientation, while conditioning bars flashed in the orthogonal orientation had little effect on the response to the test bar. Nelson also injected a GABAA antagonist into V1 and found that some adaptation remained in the absence of inhibitory circuitry. He concluded that adaptation was presynaptic in origin and synapse-specific because it did not depend on inhibition induced by GABAA channels, GABAB channels would be too slow to account for the fast adaptation of responses, and the input neurons from the LGN did not show the same adaptation. Although the adaptation we have studied is superficially similar to fast contrast adaptation in V1, our results suggest that it is mediated by a different mechanism and almost certainly not by a synapse-specific mechanism.
Britten and Heuer (1999) used a paired-stimulus paradigm to measure the interaction between two stimuli that moved simultaneously in different directions at different loci within a single MT neuron’s receptive field (Britten and Heuer 1999). MT neurons’ responses to the paired stimuli were predicted well by an average, rather than a sum, of the response to each stimulus alone, even for the case where one stimulus was in the preferred and the other in the nonpreferred direction of the neuron under study. If averaging was responsible for the short-term adaptation reported here, then we would have predicted results for our experiments that would be completely different from the ones we obtained. Averaging should cause the test response after conditioning motion in the null direction to reduce the response to subsequent test motion; further conditioning motion in the preferred direction should lead to no change in the response to the test motion. An important difference between our paradigm and that of Britten and Heuer (1999) is that their stimuli were spatially separate but temporally synchronous; our stimuli were spatially overlapping but temporally sequential. Spatial and temporal interactions may be mediated by different adaptation mechanisms or may activate the same mechanism in different ways. We also note that the effect of conditioning motion on the latency of response to test motion may be a residual from fast-acting inhibition responsible for the averaging observed by Britten and Heuer (1999).
Function of adaptation
Psychophysics has long used adaptation as a method to discern how the different components of sensory processing are linked. By adapting to a single stimulus and measuring the effects of the adaptation on the processing of other stimuli, it has been possible to estimate the overlap between functional information processing channels (Levinson and Sekuler 1975, 1976). Recently people have begun to appreciate that adaptation may have an important role in information processing (Brenner et al. 2000; Fairhall et al. 2001). For example, Muller and colleagues (1999) have shown that rapid adaptation by V1 neurons to the orientation of a bar can decrease the correlation in the spike timing of multiple neurons tuned to different orientations but responding to the same stimulus. A reduction in correlation between neurons creates more efficient information processing by reducing the redundancy in the firing of neurons within a population, making it possible to transmit more information per spike (Muller et al. 1999).
Adaptation also allows sensory systems to respond to changes in the environment rather than to the absolute amplitudes of sensory input like contrast for V1 neurons or speed for MT neurons. Some behaviors require information about the change in a stimulus over time. For example, ocular smooth pursuit attempts to match the velocity of the eye with the velocity of targets in world, and models of pursuit indicate that target velocity and acceleration are needed to produce realistic pursuit behavior. Sensing the velocity and acceleration of a target requires information not only about the movement of a target but also about how the movement of the target changes in time. The diversity of adaptation speed tuning found in our data are consistent with the view that many neurons in MT have the potential to provide information about the acceleration, as well as the direction and speed of target motion (Lisberger and Movshon 1999).
Acknowledgments
We are grateful to S. Ruffner for creating the target presentation software and to C. Cassanello, M. Churchland, and L. Osborne for participating in the experiments. We are indebted to K. MacLeod and E. Montgomery for assistance with animal preparation and maintenance. We appreciate the help in performing initial experiments from T. Movshon, W. Bair, and J. Cavanaugh. We also thank J. Hanover for helpful discussions and comments and T. Movshon, K. Miller, M. Stryker, and J. Korenbrot for comments on an earlier version of the paper.
This research was supported by the Howard Hughes Medical Institute and by National Eye Institute Grants R01-EY-03878 and T32-EY-07120.
References
- Anderson JS, Carandini M, Ferster D. Orientation tuning of input conductance, excitation, and inhibition in cat primary visual cortex. J Neurophysiol. 2000;84:909–926. doi: 10.1152/jn.2000.84.2.909. [DOI] [PubMed] [Google Scholar]
- Anderson JS, Lampl I, Gillespie DC, Ferster D. Membrane potential and conductance changes underlying length tuning of cells in cat primary visual cortex. J Neurosci. 2001;21:2104–2112. doi: 10.1523/JNEUROSCI.21-06-02104.2001. [DOI] [PMC free article] [PubMed] [Google Scholar]
- Brenner N, Bialek W, van Steveninck RD. Adaptive rescaling maximizes information transmission. Neuron. 2000;26:695–702. doi: 10.1016/s0896-6273(00)81205-2. [DOI] [PubMed] [Google Scholar]
- Britten KH, Heuer HW. Spatial summation in the receptive fields of MT neurons. J Neurosci. 1999;19:5074–5084. doi: 10.1523/JNEUROSCI.19-12-05074.1999. [DOI] [PMC free article] [PubMed] [Google Scholar]
- Carandini M, Heeger DJ, Movshon JA. Linearity and normalization in simple cells of the macaque primary visual cortex. J Neurosci. 1997;17:8621–8644. doi: 10.1523/JNEUROSCI.17-21-08621.1997. [DOI] [PMC free article] [PubMed] [Google Scholar]
- Connors BW, Gutnick MJ. Intrinsic firing patterns of diverse neocortical neurons. Trends Neurosci. 1990;13:99–104. doi: 10.1016/0166-2236(90)90185-d. [DOI] [PubMed] [Google Scholar]
- Douglas RJ, Martin KA. A functional microcircuit for cat visual cortex. J Physiol (Lond) 1991;440:735–769. doi: 10.1113/jphysiol.1991.sp018733. [DOI] [PMC free article] [PubMed] [Google Scholar]
- Douglas RJ, Koch C, Mahowald M, Martin KAC, Suarez HH. Recurrent excitation in neocortical circuits. Science. 1995;269:981–985. doi: 10.1126/science.7638624. [DOI] [PubMed] [Google Scholar]
- Dubner R, Zeki SM. Response properties and receptive fields of cells in an anatomically defined region of the superior temporal sulcus in the monkey. Brain Res. 1971;35:528–532. doi: 10.1016/0006-8993(71)90494-x. [DOI] [PubMed] [Google Scholar]
- Fairhall AL, Lewen GD, Bialek W, van Steveninck RRD. Efficiency and ambiguity in an adaptive neural code. Nature. 2001;412:787–792. doi: 10.1038/35090500. [DOI] [PubMed] [Google Scholar]
- Heeger DJ, Simoncelli EP, Movshon JA. Computational models of cortical visual processing. Proc Natl Acad Sci USA. 1996;93:623– 627. doi: 10.1073/pnas.93.2.623. [DOI] [PMC free article] [PubMed] [Google Scholar]
- Kayser A, Priebe NJ, Miller KD. Contrast-dependent. nonlinearities arise locally in a model of contrast-invariant orientation tuning. J Neurophysiol. 2001;85:2130–2149. doi: 10.1152/jn.2001.85.5.2130. [DOI] [PubMed] [Google Scholar]
- Kulikowski JJ, Bishop PO, Kato H. Sustained and transient responses by cat striate cells to stationary flashing light and dark bars. Brain Res. 1979;170:362–367. doi: 10.1016/0006-8993(79)90115-x. [DOI] [PubMed] [Google Scholar]
- Levinson E, Sekuler R. The independence of channels in human vision selective for direction of movement. J Physiol (Lond) 1975;250:347–366. doi: 10.1113/jphysiol.1975.sp011058. [DOI] [PMC free article] [PubMed] [Google Scholar]
- Levinson E, Sekuler R. Adaptation alters perceived direction of motion. Vision Res. 1976;16:779–781. doi: 10.1016/0042-6989(76)90189-9. [DOI] [PubMed] [Google Scholar]
- Lisberger S, Movshon J. Visual motion analysis for pursuit eye movements in area MT of macaque monkeys. J Neurosci. 1999;19:2224–2246. doi: 10.1523/JNEUROSCI.19-06-02224.1999. [DOI] [PMC free article] [PubMed] [Google Scholar]
- Maunsell JHR, Van Essen DC. Functional properties of neurons in middle temporal visual area of the macaque monkey. I. Selectivity for stimulus direction, speed, and orientation. J Neurophysiol. 1983;49:1127–1147. doi: 10.1152/jn.1983.49.5.1127. [DOI] [PubMed] [Google Scholar]
- McCormick DA, Connors BW, Lighthall JW, Prince DA. Comparative electrophysiology of pyramidal and sparsely spiny stellate neurons of the neocortex. J Neurophysiol. 1985;54:782– 806. doi: 10.1152/jn.1985.54.4.782. [DOI] [PubMed] [Google Scholar]
- Miller RG. Simultaneous Statistical Inference. 2. New York: Springer-Verlag; 1981. [Google Scholar]
- Muller JR, Metha AB, Krauskopf J, Lennie P. Rapid adaptation in visual cortex to the structure of images. Science. 1999;285:1405–1408. doi: 10.1126/science.285.5432.1405. [DOI] [PubMed] [Google Scholar]
- Nelson SB. Temporal interactions in the cat visual system. I. Orientation-selective suppression in the visual cortex. J Neurosci. 1991a;11:344–356. doi: 10.1523/JNEUROSCI.11-02-00344.1991. [DOI] [PMC free article] [PubMed] [Google Scholar]
- Nelson SB. Temporal interactions in the cat visual system. II. Suppressive and facilitatory effects in the lateral geniculate nucleus. J Neurosci. 1991b;11:357–368. doi: 10.1523/JNEUROSCI.11-02-00357.1991. [DOI] [PMC free article] [PubMed] [Google Scholar]
- Nelson SB. Temporal interactions in the cat visual system. III. Pharmacological studies of cortical suppression suggest a presynaptic mechanism. J Neurosci. 1991c;11:369–380. doi: 10.1523/JNEUROSCI.11-02-00369.1991. [DOI] [PMC free article] [PubMed] [Google Scholar]
- Priebe NP, Churchland MM, Lisberger SG. Constraints on the source of short-term, motion adaptation in macaque area MT. I. The role of input and intrinsic mechanisms. J Neurophysiol. 2002;88:354–369. doi: 10.1152/.00852.2002. [DOI] [PMC free article] [PubMed] [Google Scholar]
- Simoncelli EP, Heeger DJ. A model of neuronal responses in visual area MT. Vision Res. 1998;38:743–761. doi: 10.1016/s0042-6989(97)00183-1. [DOI] [PubMed] [Google Scholar]
- Sokal RR, Rohlf FJ. Biometry: The Principles and Practice of Statistics in Biological Research. 3. New York: W. H. Freeman; 1995. [Google Scholar]
- Troyer TW, Krukowski AE, Priebe NJ, Miller KD. Contrast-invariant orientation tuning in cat visual cortex: thalamocortical input tuning and correlation-based intracortical connectivity. J Neurosci. 1998;18:5908–5927. doi: 10.1523/JNEUROSCI.18-15-05908.1998. [DOI] [PMC free article] [PubMed] [Google Scholar]
- Wörgötter F, Koch C. A detailed model of the primary visual pathway in the cat: comparison of afferent excitatory and intracortical inhibitory connection schemes for orientation selectivity. J Neurosci. 1991;11:1959–1979. doi: 10.1523/JNEUROSCI.11-07-01959.1991. [DOI] [PMC free article] [PubMed] [Google Scholar]


