

Abstract
In postembryonic zebrafish, rod photoreceptors are continuously generated from progenitors in the inner nuclear layer, which are derived from radial Müller glia that express the transcription factor pax6. We used BrdU incorporation, in combination with in situ hybridization for cell-specific transcription factors, to establish the patterns of gene expression during rod lineage maturation in the embryonic zebrafish. Downregulation of pax6 expression was accompanied by sporadic upregulation of expression of the transcription factors NeuroD/nrd, rx1, crx, and Nr2e3/pnr. As cells of the rod lineage entered the outer nuclear layer, they became homogeneous, coordinately expressing NeuroD, rx1, crx, and Nr2e3. Postmitotic, maturing rods also expressed nrl, rod opsin, and rod transducin/gnat1. The presence of rx1 within the rod lineage and in maturing rods indicates that rx1 is not cone-specific, as previously reported, and suggests a high degree of molecular similarity between rod and cone progenitor populations in the zebrafish.
Keywords: zebrafish, retina, development, rod lineage, retinal homeobox
INTRODUCTION
There are seven cell classes in the highly conserved vertebrate retina, six of which are neuronal and one that is glial (Morrow et al., 1999). These functionally distinct cells are generated from a superficially homogeneous retinal neuroepithelium, following a stereotypical spatiotemporal sequence of cell-specific terminal mitoses (Altshuler et al., 1991; Hu and Easter, 1999). The end result is the stratified arrangement of three cellular (nuclear) layers and two synaptic (plexiform) layers.
The teleost retina offers opportunities to selectively examine the generation of specific populations of retinal cells (Stenkamp, 2007). Retinal neurogenesis in the embryonic zebrafish occurs rapidly, but the generation of each retinal layer is sequential and non-overlapping (Hu and Easter, 1999). In the goldfish, rod photoreceptors are the last of the retinal neuronal cell types to undergo terminal mitosis (Raymond et al., 1995; Hitchcock et al., 2004), providing a temporal window during which rod photoreceptor neurogenesis can be selectively studied. This finding may hold true for other teleost fish such as the zebrafish. Finally, the fish retina continues to grow postembryonically, in part through the addition of concentric annuli of new retinal neurons from retinal progenitors of the circumferential germinal zone (cgz), and in part through the continued insertion of rods into the outer nuclear layer (onl) of the mature retina (Stenkamp, 2007). In larval and adult fish, the sources of these new rods are rod progenitors in the inner nuclear layer (inl), which proliferate, differentiate, and migrate to their final destination in the onl (Otteson and Hitchcock, 2003). Once in the onl, these progenitor cells are referred to as rod precursors. Rod precursors undergo a terminal mitosis, generating new rod photoreceptors (Johns and Fernald, 1981) that then express rod opsin (Knight and Raymond, 1990; Stenkamp et al., 1997).
The rod lineage is characterized by stereotyped spatial patterns of cell migration, changes in nuclear morphology, and the expression of specific transcription factors (Otteson and Hitchcock, 2003). There is excellent evidence that the cells residing at the apex of the postembryonic rod lineage of zebrafish correspond to Müller glia that express the paired homeodomain transcription factor pax6 (Bernardos et al., 2007). The larval and adult cgz generates these pax6+ cells, and seeds them into the inl, along with postmitotic neurons. As the rod lineage matures, pax6 expression is lost and other transcription factors are expressed, most notably the basic helix-loop-helix gene NeuroD/nrd (Ochocinska and Hitchcock, 2007), the cone-rod homeobox gene crx (Bernardos et al., 2007), and the orphan nuclear receptor Nr2e3 (Morris et al., 2008).
The origin and lineage of rods in embryonic teleost retina is not as well understood. Although rods are born after embryonic cone photoreceptors, they differentiate rapidly in the ventral retina and rod opsin is expressed prior to any cone opsin (Raymond et al., 1995; Stenkamp et al., 1996). Opsin-positive rods are found in embryonic retina prior to the time that glial markers detect the presence of Müller cells, so a lineage relationship is still in question. In addition, there is no cgz in the embryonic retina from which the rod lineage could be “seeded;” rather, the entire embryonic retina consists of progenitor cells. A subset of these may migrate to the inl, remain in a progenitor state and become established as rod/glial progenitors, but this has not been demonstrated. Finally, the expression pattern of genes involved in the development of the embryonic zebrafish rod lineage has remained virtually unexplored, with the exception of NeuroD expression in rod progenitors of the embryonic inl (Ochocinska and Hitchcock, 2007).
In addition to pax6, NeuroD, crx, and Nr2e3, other genes can be considered candidates for involvement in the embryonic rod lineage, based upon their roles in rod development in other model organisms. These candidates include the neural retinal leucine zipper (nrl), and the retinal homeobox (rx) genes. Expression of nrl is required for rod differentiation in mammals (Mears et al., 2001; Daniele et al., 2005; Akimoto et al., 2006), but expression of the zebrafish nrl ortholog in embryonic retina has not been demonstrated. The rx genes encode transcription factors of the paired-like homeodomain class of proteins (Mathers et al., 1997), which play multiple roles in eye and retinal development. The early expression of human RX is important for the proper formation of the developing human eye field; mutations within the homeodomain of the human RX gene lead to microphthalmia or anophthalmia (Voronina et al., 2004), and the mouse Rx knockout is eyeless (Mathers et al., 1997). Functional RX is required for the formation of retinal progenitor cells in mice (Zhang et al., 2000). The mouse Rx protein has been shown to interact with Crx to promote photoreceptor specific gene expression (Kimura et al., 2000). The human QRX (Q50-type retinal homeobox) gene is expressed in mature embryonic photoreceptors, and defects in this gene may be related to retinal degenerative disease (Wang et al., 2004).
In the zebrafish, there are three rx genes, all of which play a functional role in the developing optic primordia (Chuang et al., 1999). Unlike rx3, the zebrafish rx1 and rx2 genes are expressed in retinal progenitors and in cone photoreceptors (Chuang et al., 1999). The functional knockdown of rx1 in developing zebrafish results in lamination defects and a reduction in photoreceptors (Rojas-Muñoz et al., 2005; Nelson and Stenkamp, unpublished data). The targeted knockdown of rx2 expression resulted in a modest reduction in cells of the onl (Rojas-Munoz et al., 2005) compared with rx1, which suggests that rx1 may play a more dominant role in the development of photoreceptors in the zebrafish. However, despite the documented expression of rx1 in cone photoreceptors, it is not known if rx1 is expressed in rod progenitors or embryonic rod photoreceptors.
The purposes of this study are to identify the rod lineage of the embryonic zebrafish retina, determine the expression patterns of genes involved in rod lineage maturation, and to position the rx1 gene within this lineage.
RESULTS
BrdU Labeling Pattern and Proliferation Kinetics
Our goal was to use incorporation of an S-phase marker, BrdU, to identify cells of the embryonic rod lineage as distinct from other retinal cell types. In general, rod production is delayed as compared to cones (Blaxter and Staines, 1970; Carter-Dawson and LaVail, 1979; Young, 1985; Knight and Raymond, 1990), although in the zebrafish, the first rod opsin+ rods are visible by 48 hr post-fertilization (hpf) (Raymond et al., 1995), and the wave of cone production is not complete until approximately 54 hpf (Hu and Easter, 1999; Ochocinska and Hitchcock, 2007), predicting some overlap in embryonic rod and cone neurogenesis. Therefore, we tested several cell labeling schemes to determine if selective labeling of the rod lineage was possible. Embryos were injected with 0.5 or 1.5 nL of 10 mM BrdU at 55 or 60 hpf, and were fixed at 72, 75, 77, 80, or 101 hpf for BrdU indirect immunofluorescence. Sections through the eye typically revealed BrdU labeling in regions corresponding to the newly-formed cgz, as well as scattered cells in the onl and in the inl (Fig. 1A). In some cases, radial arrays of BrdU+ cells spanning the inl and onl were revealed (Fig. 1A). We counted the average numbers of BrdU+ cells in each retinal layer, excluding the cgz (as identified as the terminus of the inner plexiform layer at each margin), to establish kinetic parameters of the various labeling schemes. Higher doses of BrdU resulted in more extensive labeling (Fig. 2A), and this labeling was detectable up to 24 hr after the injection, suggesting cumulative availability of BrdU from the injection site in the yolk. In addition, the high doses resulted in significantly higher (P < 0.01) numbers of BrdU+ cells in the onl at later survival times (Fig. 2A), consistent with movement of rod lineage cells from the inl to the onl (Julian et al., 1998). This shift in labeling was not seen following injection of low doses, suggesting possible dilution of label over the time of the experiment (Fig. 2A) and therefore a pulse-label rather than a cumulative label.
Fig. 1.
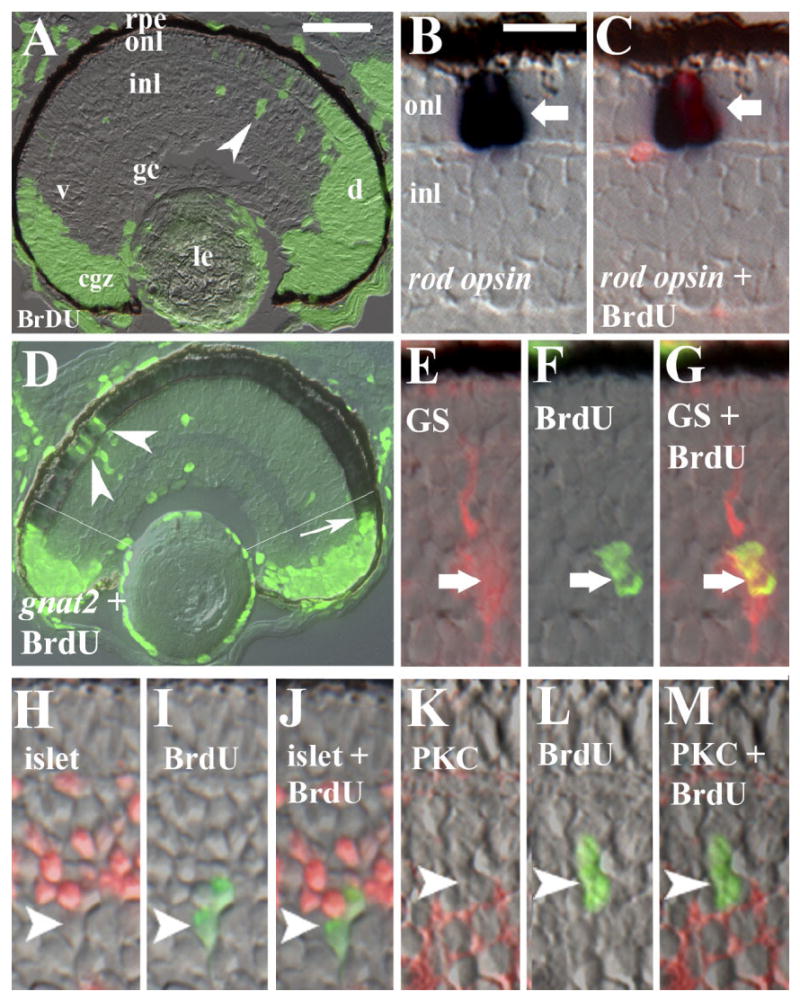
BrdU incorporation within the rod lineage in embryonic zebrafish. Embryos were injected with BrdU at 60 hpf and fixed at 75 hpf. A: Retinal cryosection showing distribution of BrdU in the circumferential germinal zone (cgz) and in radial arrays of cells (arrowhead) spanning the inner (inl) and outer nuclear layers (onl) in central retina; le, lens; rpe, retinal pigmented epithelium; gc, ganglion cell layer; v, ventral; d, dorsal. B,C: BrdU and rod opsin; Nomarski optics (B) merged with epifluorescent image (C); arrow indicates colabeled cell. D: BrdU and gnat2 colabeling showing BrdU-labeled cones in retinal periphery (arrow) and cells in the central onl labeled only for BrdU (arrowheads). Regions to the periphery of the thin white lines (located approximately 6 onl cell diameters from the unlaminated cgz) were excluded from subsequent analyses related to the rod lineage. E–G: BrdU and anti-GS; arrow indicates colabeled cell. H–J: BrdU and islet1; no colabeling was observed (arrowhead indicates singly-labeled cell). K–M: Section doubly-labeled for BrdU and PKC; no colabeling was observed (arrowhead indicates singly-labeled cell). Scale bar in A (applies to A, D) = 40 μm, in B (applies to B,C,E-M) = 10 μm.
Fig. 2.
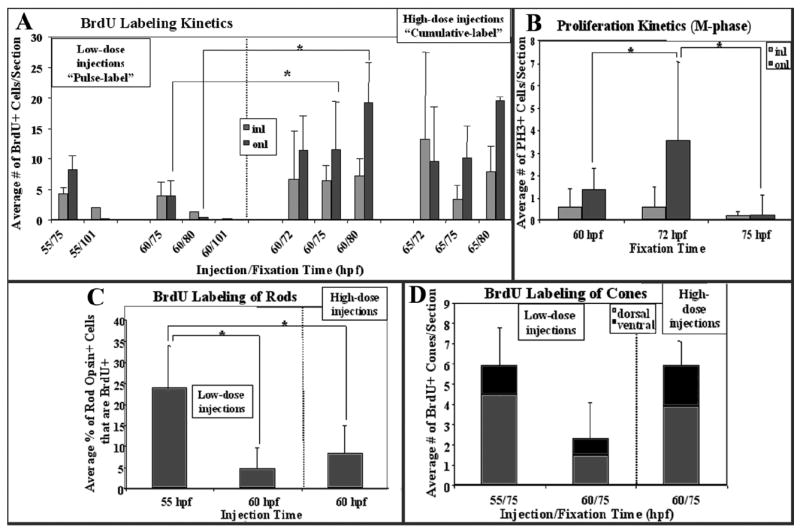
BrdU labeling kinetics, proliferation kinetics, and rod and cone colabeling in zebrafish embryos. A: Embryos were injected with BrdU and fixed at the indicated times, with low or high doses of BrdU, and sections stained for BrdU indirect immunofluorescence were analyzed for numbers of BrdU+ cells in the inner (inl) and outer nuclear layers (onl). *Significant difference (ANOVA + Fisher’s post-hoc; P < 0.01). B: Sections were stained for PH3 indirect immunofluorescence, and numbers of PH3+ cells in the inl and onl were counted. *Significant difference (ANOVA + Fisher’s post-hoc; P < 0.01). C: Embryos were injected with BrdU at the indicated times, with low or high doses of BrdU, and sections stained for BrdU in combination with in situ hybridization for rod opsin were analyzed for proportion of rod opsin+ cells colabeled with BrdU. *Significant difference (Kolmogorov-Smirnov; P < 0.01). D: Embryos were injected with BrdU and fixed at the indicated times, with low or high doses of BrdU, and sections were stained for BrdU and zpr-1 indirect immunofluorescence, or for BrdU in combination with in situ hybridization for gnat2, then analyzed for numbers of colabeled cones in dorsal and ventral retina.
The proliferation kinetics observed by BrdU incorporation over a 60- to 75-hpf time-course were verified by indirect immunofluorescence detection of phosphorylated histone 3 (PH3), a marker of M-phase. At 60, 72, and 75 hpf, PH3+ cells were rarely found in the inl and this frequency did not change significantly over time, suggesting a very low rate of proliferation in this layer (Fig. 2B). In embryos injected with BrdU at 60 hpf and fixed at 75 hpf (low or high doses), no BrdU+/PH3+ were observed in the inl (data not shown; 49 sections derived from 18 embryos). Mitotic cells were more common in the onl, with a significantly larger number found in embryos fixed at 72 hpf than at 60 or 75 hpf (Fig. 2B; P < 0.01). In BrdU-injected embryos, all of the PH3+ cells of the onl were also BrdU+ (data not shown). These data demonstrate that BrdU incorporation faithfully reports the spatiotemporal features of proliferative activity in the embryonic zebrafish retina.
Cell-Specificity of BrdU Labeling
We next confirmed that our labeling schemes could identify BrdU+, rod opsin+ cells. Sections from several of the different labeling schemes were processed for rod opsin in situ hybridization followed by BrdU indirect immunofluorescence; in nearly all cases, we could identify colabeled cells in the onl (Fig. 1B,C). Some BrdU+ cells in the onl were rod opsin-negative, consistent with an identity as either rod precursors or newly-generated cones (see below), and some rod opsin-positive cells in the onl were BrdU-negative, consistent with a birth date prior to the BrdU injection time (Fig. 2C). In embryos injected at 55 hpf, and in one embryo injected at 60 hpf, there were clusters of doubly-labeled cells near the optic nerve head (image not shown), a region of high rod abundance in embryonic retina (Raymond et al., 1995), and therefore a large proportion of rod opsin+ cells were also BrdU+ (Fig. 2C) in these sections. In the remaining embryos injected at 60 hpf, low doses of BrdU labeled fewer rods than the high doses of BrdU (Fig. 2C), consistent with our conclusions from the analysis of proliferation kinetics (Fig. 2A). Parallel experiments performed with a cRNA probe for rod transducin alpha subunit (gnat1) gave similar results (data not shown).
To determine to what extent our various labeling schemes identified newly-generated cones rather than rods, sections were processed for indirect immunofluorescence using the cone marker zpr-1 (Larison and Bremiller, 1990), or for in situ hybridization with a probe for cone transducin alpha subunit (gnat2), in combination with BrdU indirect immunofluorescence. Statistically indistinguishable numbers of BrdU+ cells were labeled by either zpr-1 or gnat2, suggesting that the blue and UV cone populations represent a minor fraction of total cones being generated at this developmental time (see Raymond et al., 1995). The BrdU+ cones were restricted to regions near the cgz (Fig. 1D). High numbers of BrdU+ cones were found in embryos injected at 55 hpf (Fig. 2D), accounting for a major fraction of the BrdU+ cells in the onl (Fig 2A,D), and these colabeled cones were not restricted to the region near the cgz. Therefore, although the use of BrdU incorporation at 55 hpf resulted in higher rates of rod labeling (Fig. 2C), it also resulted in low confidence that BrdU+ cells in the onl were of the rod lineage. The proportion of BrdU+ cones (zpr-1+ or gnat2+) was substantially lower following BrdU injection at 60 hpf, using either the “pulse” (low dose) or “cumulative” (high dose) labeling scheme (Fig. 2D). For example, cumulative labeling beginning at 60 hpf resulted in a range of two to four colabeled cells near each margin (Fig. 2D), accounting for approximately half of the BrdU+ cells in the onl. Therefore, by injecting BrdU at 60 hpf rather than 55 hpf, and by eliminating from further analysis the retinal region six cell diameters from the border of the cgz (as shown in Fig. 1E, following cumulative labeling), or within three cell diameters in the case of pulse labeling, we could be confident that the BrdU+ cells in the onl were indeed related to the production of rods and not cones. Accordingly, all subsequent analyses, unless otherwise indicated, are restricted to these parameters.
There is evidence that the pax6+ stem cells at the apex of the rod lineage in post-embryonic teleosts (Hitchcock et al., 1996) are Müller glia (Bernardos et al., 2007). Therefore, we performed dual immunolabeling experiments using the Müller glial marker anti-glutamine synthetase (GS; Linser and Moscona, 1979) in combination with BrdU in embryonic zebrafish. We identified multiple cases of colabeling in embryos injected at 55 hpf as well as at 60 hpf; these cells were located within the proximal (vitreal) half of the inl (Fig. 1E–G). In embryos injected at 55 hpf, over half (56%) of the BrdU+ cells in this location were GS+, but this ratio declined in embryos injected at 60 hpf (3–12%), even when the cumulative labeling scheme was utilized. Therefore, the embryonic Müller cell population may slow or cease proliferation over the 55–75 hpf time-course. In support of the latter interpretation, we have never observed the presence of the M-phase marker PH3 in GS+ Müller glia in embryos fixed at 60, 72, or 75 hpf (data not shown; 36 sections derived from 8 –12 embryos at each time point). The use of other Müller glia markers, anti-GFAP and zrf1, gave the same result (data not shown). These findings are consistent with a lineage relationship between Müller glia and rod photoreceptors at the developmental time when production of both cell classes commences; however, it is unclear whether this embryonic glial population participates in the production of new rods.
To establish that the BrdU+ cells in the inl were exclusively related to the rod lineage (and/or to Müller glia), but did not label other, late-born neurons, we performed additional colabeling experiments with the retinal neuronal markers anti-protein kinase C (PKC), which labels rod bipolar neurons (Koulen et al., 1997), and anti-islet1, which labels ganglion cells and amacrine cells (Masland and Tauchi, 1986), using embryos injected at both 55 hpf and at 60 hpf. In none of our labeling schemes were we able to locate doubly-labeled cells (Fig. 1H–M; 2 embryos and 14 sections for anti-islet 1; 3 embryos and 17 sections for anti-PKC), allowing us to be confident that, following any of our labeling schemes, the BrdU+ cells of the inl corresponded to cells of the rod/Müller glial lineage(s) rather than to postmitotic retinal neurons.
Transcription Factor Expression in the Rod Lineage
Several transcription factors have already been associated with the rod lineage of teleost fish, most notably pax6, NeuroD/nrd, Nr2e3, and crx, primarily in postembryonic retinas. We wished to determine the relative expression domains of these transcription factors in the rod lineage of embryonic retina, and to establish whether the rx1 and nrl genes were also in this lineage.
Pax6 is expressed by retinal progenitors, ganglion cells, and amacrine cells, and in adult goldfish and juvenile zebrafish, pax6 has been established as a putative marker for the apex of the rod lineage (Hitchcock et al., 1996; Otteson et al., 2001). To determine whether this is also the case in the embryonic zebrafish, we performed pax6 in situ hybridizations followed by BrdU indirect immunofluorescence on sections derived from BrdU-injected embryos. We regularly (1 cell per section on average; 12 sections) observed colabeled cells in the inl (Fig. 3A,B). These cells were typically located just within the proximal half of the inl, near the outer limit of the pax6 expression domain. These findings suggest that pax6 is expressed in a small population of cells of the rod lineage in the embryonic zebrafish.
Fig. 3.
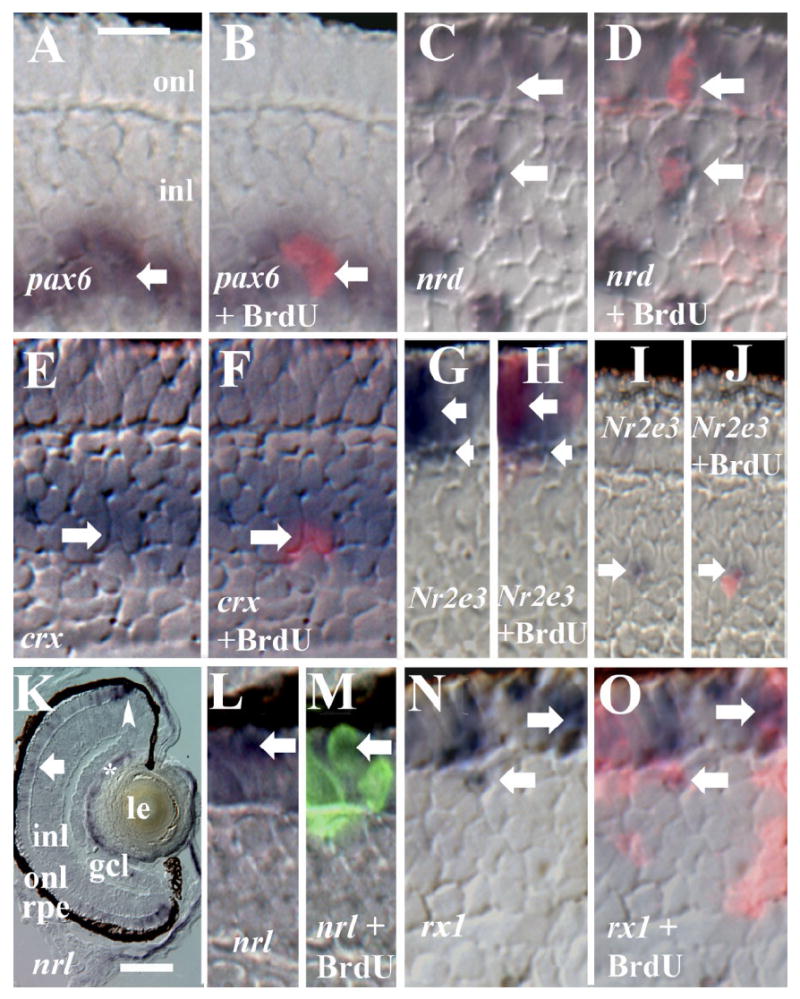
Gene expression in cells of the BrdU+ rod lineage. All embryos were injected with BrdU at 60 hpf and fixed at 75 or 80 hpf. A,B: BrdU and pax6; Nomarski optics (A) merged with epifluorescence image (B); arrow indicates colabeled cell. C,D: BrdU and NeuroD; Nomarski optics (C), merged with epifluorescence image (D); two colabeled cells are indicated by arrows. E,F: BrdU and crx; Nomarski optics (E), merged with epifluorescence image (F); arrow indicates colabeled cell. G–J: BrdU and Nr2e3; Nomarski optics (G,I), merged with epifluorescence images (H,J); colabeled cells are indicated by arrows. K: Retinal expression pattern of nrl; both rod (arrow) and cone progenitors (arrowhead) are labeled, as well as cells of the lens (*). L,M: BrdU and nrl; Nomarski optics (L), merged with epifluorescence image (M); arrow indicates colabeled cell. N,O: BrdU and rx1; Nomarski optics (N), merged with epifluorescence image (O); colabeled cells are indicated by arrows. rpe, retinal pigmented epithelium; onl, outer nuclear layer; inl, inner nuclear layer; gcl, ganglion cell layer; le, lens. Scale bar in A (applies to all except K) = 10 μm, in K = 40 μm.
NeuroD is expressed by cells of the rod lineage in the inl and onl, and by newly-generated cone photoreceptors (Hitchcock et al., 2004; Ochocinska and Hitchcock, 2007). However, the BrdU labeling scheme used (exposure at 55 hpf) did not exclusively detect rods as the BrdU+ cells of the onl (as noted by the authors; and see Fig. 2), and so we performed colabeling experiments using embryos injected at 60 hpf. In these experiments, we frequently (2–3 cells per section on average; 32 sections) observed colabeled cells in the inl (Fig. 3C,D), consistent with Ochocinska and Hitchcock (2007). The location of these cells was variable. A large number of NeuroD+ cells in the inl were not BrdU+, and likely correspond to amacrine cells (Ochocinska and Hitchcock, 2007). We also observed colabeled cells in the onl, in regions that we had confirmed did not contain BrdU+ cones (Fig. 3C,D). These findings extend the results of Ochocinska and Hitchcock, indicating that NeuroD is expressed by cells of the rod lineage in the onl as well as in the inl. All cells of the onl that were BrdU+ were also NeuroD+. Because our labeling scheme provided sufficient BrdU to label the entire rod lineage, up through rod opsin expression, this NeuroD labeling pattern indicates that rod precursors and maturing rods are NeuroD+.
The cone-rod homeobox (crx) gene is expressed by differentiating cones in the zebrafish (Liu et al., 2001) embryo, and is co-expressed with NeuroD in this cell population (Ochocinska and Hitchcock, 2007). The crx gene is also expressed in the rod lineage of juvenile zebrafish (Bernardos et al., 2007). We wished to determine the expression pattern of crx in the embryonic rod lineage. In embryos injected with BrdU at 55 or 60 hpf, we frequently observed crx+/BrdU+ cells in the onl and in the middle region of the inl (Fig. 3E,F). In fact, all of the BrdU+ cells of the onl were also crx+ and most of the BrdU+ cells of the inl were also crx+ (3–4 cells per section on average; 9 sections). This raises the possibility that crx and NeuroD cooperate during the migration and maturation of cells of the rod lineage. We note that Ochocinska and Hitchcock (2007) were unable to colocalize NeuroD with crx in the inl. This issue is addressed in the Relationship of rx1 to Other Transcription Factors of the Rod Lineage section, in the Results section. A large number of crx+ cells in the inl were not BrdU+, however, indicating, that, like pax6 and NeuroD, crx is not an exclusive marker of the rod lineage.
The expression of crx mRNA was rather diffuse, and so we confirmed these findings through antibody staining using a crx-specific antibody in combination with anti-BrdU. Colabeled cells were found in both the inl and onl (Fig. 4A–C). Expression of crx/crx was extensive within the inl (Shen and Raymond, 2004), raising the possibility that many of the crx+ cells were postmitotic neurons. We verified that at least some crx+ cells are actively proliferative through colabeling studies using the crx antibody in combination with a monoclonal anti-phosphoprotein antibody, MPM-2. In embryos examined at 72 hpf, we found examples of crx+/MPM-2+ cells in the inl (Fig. 4D–F), and in the onl (not shown). This is an important finding as is the first demonstration (in undamaged retina) that mitotic cells, likely part of the rod photoreceptor lineage, can express a “photoreceptor-specific” transcription factor.
Fig. 4.
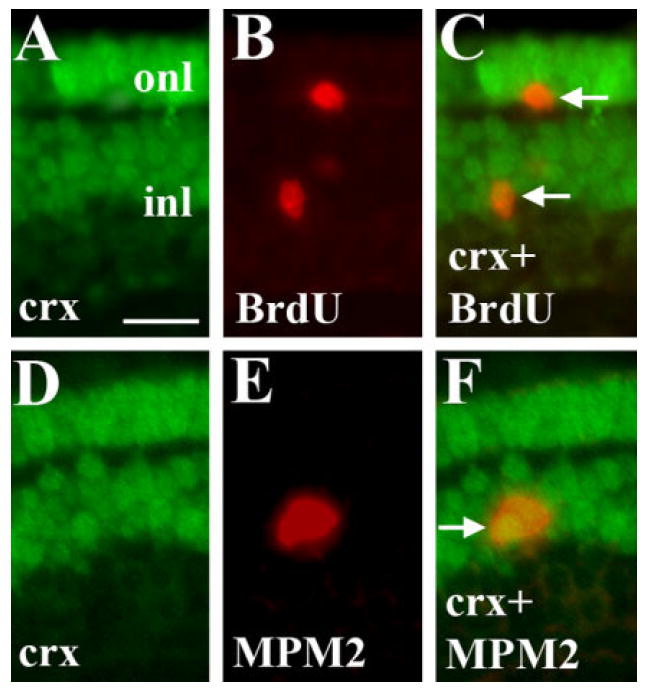
Crx protein expression in mitotic cells of the BrdU+ rod lineage. A–C: Embryo was injected with BrdU at 60 hpf and fixed at 75 hpf, and processed for indirect immunofluorescence with anti-crx (A) and anti-BrdU (B). C shows merged image and colabeled cells (arrows). D–F: Embryo fixed at 72 hpf and processed for indirect immunofluorescence with anti-crx (D) and MPM-2 (mitotic cells; E). F shows merged image and colabeled cells (arrow). Scale bar in A (applies to all) = 10 μm.
Photoreceptor cell-specific nuclear receptor (pnr), also known as Nr2e3, is an orphan nuclear receptor known to activate rod-specific genes and repress cone-specific genes in mouse (Chen et al., 2005). In the zebrafish, Nr2e3 is expressed throughout the onl (Kitambi and Hauptmann, 2007), but then becomes restricted to rod photoreceptors (Chen et al., 2005), and is upregulated in a zebrafish model for rod degeneration and replacement (Morris et al., 2008). Our preliminary experiments revealed Nr2e3 expression in scattered cells in the inl (similar to that seen by Morris et al. (2008) in a zebrafish model for rod pathology and regeneration), and so we pursued colabeling experiments with BrdU. In embryos injected with BrdU at 60 hpf, we regularly observed Nr2e3+/BrdU+ cells in the onl (Fig. 3G,H), consistent with the identity of these cells as new rods, but also occasionally observed Nr2e3+/BrdU+ cells in the outermost or innermost regions of the inl (Fig. 3I,J). However, some Nr2e3+ cells in the inl were not colabeled, indicating that Nr2e3 expression in the inl may not be exclusive to the rod lineage in wild-type embryonic retina.
The neural retina leucine zipper (nrl) gene is required for rod photoreceptor differentiation in mammals (Mears et al., 2001; Daniele et al., 2005; Akimoto et al., 2006); the Nrl protein interacts synergistically with Crx at the rod opsin promoter (Mitton et al., 2000; Liu et al., 2001). A putative, and phylogenetically distant, ortholog of nrl has been identified in zebrafish, and this gene is expressed in the developing lens and the adult onl (Coolen et al., 2005). However, a screen for expressed sequence tags from adult zebrafish retina failed to find this nrl ortholog (Vihtelic et al., 2005), raising questions as to the true expression pattern and function of zebrafish nrl. In embryonic and early larval (80 hpf) retina, this nrl gene was expressed in cells of the lens, and also in cells of the onl in a pattern reminiscent of that of Nr2e3 (Fig. 3K, and see Chen et al., 2005). We observed weak expression of nrl in a scattered population of cells of the onl, consistent with their identity as rods or possibly rod precursors (Fig. 3K). However, nrl was also strongly expressed in the cells of the onl adjacent to the cgz, having a likely identity of cone progenitors (Fig. 3K). In BrdU-injected embryos, we regularly observed co-expression of nrl in some of the BrdU+ cells of the onl sufficiently distant from the cgz to be identified as rods or rod precursors (Fig. 3L,M).
Expression of the retinal homeobox (rx) genes has been characterized in the zebrafish embryo (Chuang et al., 1999), but this characterization did not include a complete evaluation of rod versus cone expression, nor of expression in the rod lineage. We therefore processed BrdU-injected embryos for in situ hybridization using cRNAs corresponding to the zebrafish rx1 gene, together with BrdU immunofluorescence. All BrdU+ cells of the onl were also rx1+ (Fig. 3N,O), suggesting that rx1 is expressed by both rods and rod precursors. We also regularly observed rx1+/BrdU+ cells in variable locations within the inl (Fig. 3P,Q). However, not all BrdU+ cells were rx1-positive (Fig. 3N,O), and not all rx1-positive cells were BrdU+, even in the cumulative labeling experiments. This indicates that rx1, like NeuroD, crx, and Nr2e3, is not an exclusive marker of cells of the rod lineage. Weaker retinal expression of the rx2 and rx3 genes prevented us from performing interpretable dual labeling experiments; the color reaction from the in situ hybridization steps did not survive the BrdU labeling procedure. However, the expression patterns of rx1 and rx2 are virtually identical (Chuang et al., 1999, and data not shown), predicting a similar association with the rod lineage.
For each transcription factor evaluated, we counted the proportion of BrdU+ cells that were colabeled following pulse-labeling (60–75 hpf), within defined compartments of the inl (Fig. 5A), in order to establish a putative genetic hierarchy within the rod lineage. The proximal inl (p-inl) is defined as the region spanning the inner limit of the crx expression domain and the boundary of the inner plexiform layer (ipl), and is approximately three cell diameters thick. The distal inl (d-inl) is defined as a layer that is approximately two cell diameters thick and its outer border is the outer plexiform layer (opl). Finally, the medial inl (m-inl) lies between the inner border of the d-inl and the inner boundary of the crx expression domain and is approximately four cell diameters thick. Within the p-inl, BrdU coexpression with pax6 was more consistently observed than that with any of the other transcription factors tested (Fig. 5B). Coexpression with NeuroD was seen less frequently, though still more frequently than that with rx1 or Nr2e3; in these latter cases colabeling was seen only rarely. Within the m-inl, BrdU+ cells were always crx+, and approximately half of them were NeuroD+, as was the case in the p-inl. The proportion of BrdU+ cells that were also rx1+ remained low, although it was higher than the corresponding proportion in the p-inl. Within the d-inl, crx coexpression with BrdU remained at 100%, NeuroD coexpression at 50%, rx1 coexpression remained low but increased compared to that in the m-inl, and Nr2e3 coexpression was again rarely observed (Fig. 5B). Within the onl, all BrdU+ cells were also NeuroD+, rx1+, and crx+, and nearly all were also Nr2e3+. This quantitative evaluation reveals heterogeneity of transcription factor expression within the rod lineage in the inl, followed by remarkable homogeneity once the progenitors reach the onl. Only a fraction (39%) of the BrdU+ cells of the onl also expressed rod opsin (Fig. 5B), the remainder correspond to an identity as rod precursors or immature rods. An even smaller fraction (22%) of the BrdU+ cells of the onl expressed nrl (Fig. 5B), suggesting that this transcription factor is expressed only in a subpopulation of developing rods, or is expressed transiently.
Fig. 5.
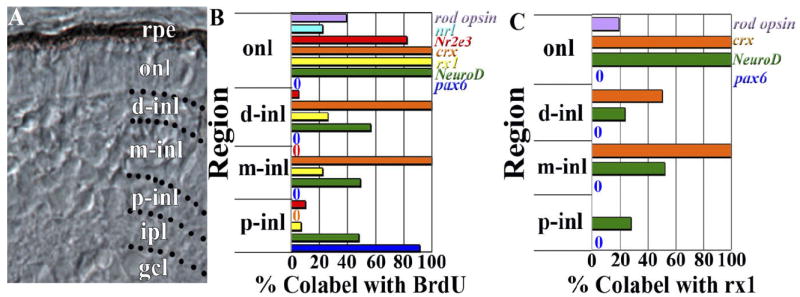
Colabeling quantification by onl and inl compartments. A: Retinal cryosection from 72-hpf embryo showing subdivision of the inner nuclear layer (inl) into proximal (p-inl), medial (m-inl), and distal (d-inl) compartments; further explanation is provided in the Results section. B: BrdU colabeling with rod opsin, nrl, Nr2e3, crx, rx1, NeuroD, and pax6, by retinal lamina and defined inl compartments. C: Rx1 colabeling with rod opsin, crx, NeuroD, and pax6, by retinal lamina and defined compartments of the inl. rpe, retinal pigmented epithelium; onl, outer nuclear layer; gcl, ganglion cell layer.
Expression of rx1 in Rod and Cone Photoreceptors
We next utilized an independent set of experiments to identify the specific photoreceptor types that express rx1. Cryosections processed for a combination of rod opsin and rx1 in situ hybridization showed that all rod opsin+ cells were also rx1+, but not all rx1+ cells were rod opsin+, confirming that rx1 is expressed by developing rods as well as developing cones (Fig. 6A–C; Chuang et al., 1999). Sections processed for a combination of the rod transducin, gnat1, and rx1 in situ hybridization showed the same pattern (Fig. 6D–F). To verify the reliability of our double labeling protocol, we performed several control experiments. As a positive control, we processed sections for a combination of rod opsin and gnat1 in situ hybridization, and observed that nearly all labeled cells were colabeled (Fig. 6G–I). As a negative control, we processed sections for a combination of rod opsin and gnat2 (expressed by all cones), and observed no colabeling (Fig. 6J–L), indicating that we were not obtaining false-positive information in the previous experiments. A combination of rod opsin and red cone opsin also showed no colabeling (data not shown). As a final confirmation that embryonic rods express rx1, we performed rx1/rod opsin dual in situ hybridizations using alternative reagents for visualization of hybridization, and these experiments also revealed colabeled cells in the onl (Fig. 6M,N). To identify the embryonic cone photoreceptors that express rx1, we processed sections with the following combinations of probes: rx1/red cone opsin (Fig. 6O–Q), rx1/blue cone opsin (Fig. 6R–T), rx1/UV cone opsin (Fig. 6U–W), and rx1/gnat2 (Fig. 6X–Z). We observed rx1 colabeling with each cone opsin subtype tested, and with gnat2 (cone transducin), which is expressed by all cone subtypes. The rx1 transcription factor is therefore expressed by all maturing photoreceptor types within the embryonic zebrafish retina, as well as within some cells of the rod lineage.
Fig. 6.
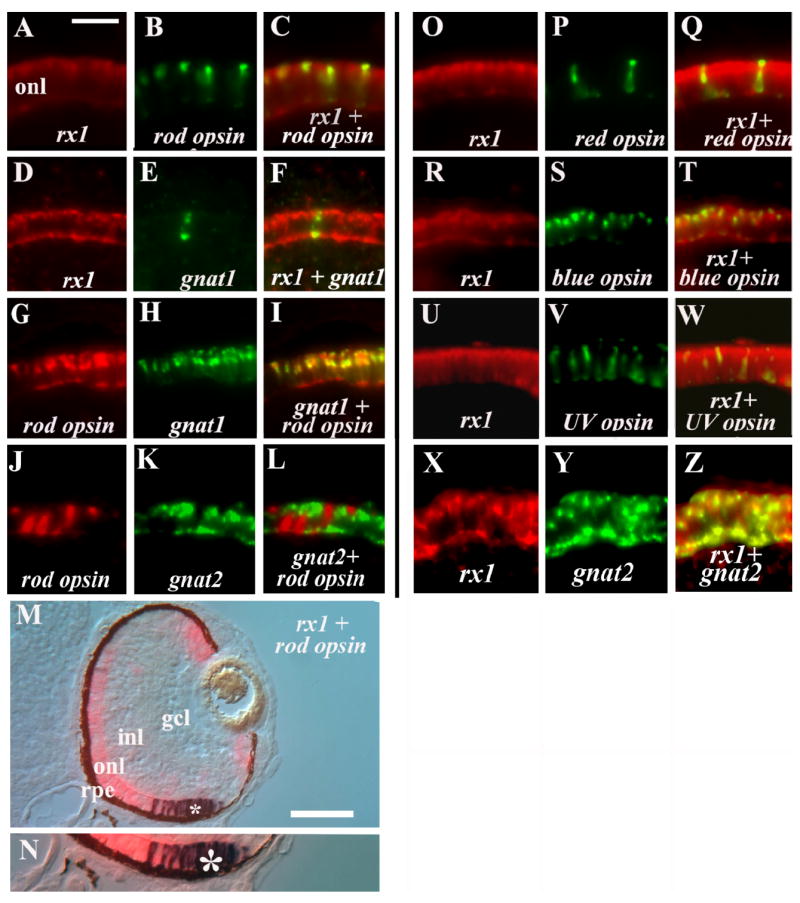
Rx1 expression in all photoreceptor subtypes. All panels show retinal cryosections of 72-hpf embryos. A–C: rx1 (A) and rod opsin (B) colabeling (C). D–F: rx1 (D) and gnat1 (E) colabeling (F). G–I: rod opsin (G) and gnat1 (H) colabeling (I; positive control). J–L: rod opsin (J) and gnat2 (K) show no colabeling (L; negative control). M,N: rx1 and rod opsin colabeling using an alternative set of reaction products; N is an enlargement of region in M indicated by *, showing colabeled cells. O–Q: rx1 (O) and red opsin (P) colabeling (Q). R–T: rx1 (R) and blue opsin (S) colabeling (T). U–W: rx1 (U) and uv opsin (V) colabeling (W). X–Z: rx1 (X) and gnat2 (Y) colabeling (Z). onl, outer nuclear layer; inl, inner nuclear layer; gcl, ganglion cell layer; rpe, retinal pigmented epithelium. Scale bar in A (applies to A–L, O–W) = 20 μm; in M = 50 μm.
Relationship of rx1 to Other Transcription Factors of the Rod Lineage
We wished to establish the in vivo relationship of expression of the rx1 gene to that of other rod lineage markers, in order to better understand the genetic hierarchy of the rod lineage. BrdU+/rx1+ cells were occasionally observed in the proximal region of the inl, and so we tested whether these cells may correspond to the pax6+ stem cells of the rod lineage, by performing rx1/pax6 colabeling experiments. Using two alternative sets of visualization reagents, on a total of 126 sections from 37 embryos, we could not see convincing evidence of colabeling (Fig. 7A–D). However, we observed several instances of rx1 labeling in cells immediately adjacent to the region of pax6 expression. Rx1 and pax6 clearly segregated into discrete expression domains within the inl. Therefore, rx1 is not retained in the pax6+/Müller glia that serve as stem cells for the production of rods (Bernardos et al., 2007).
Fig. 7.
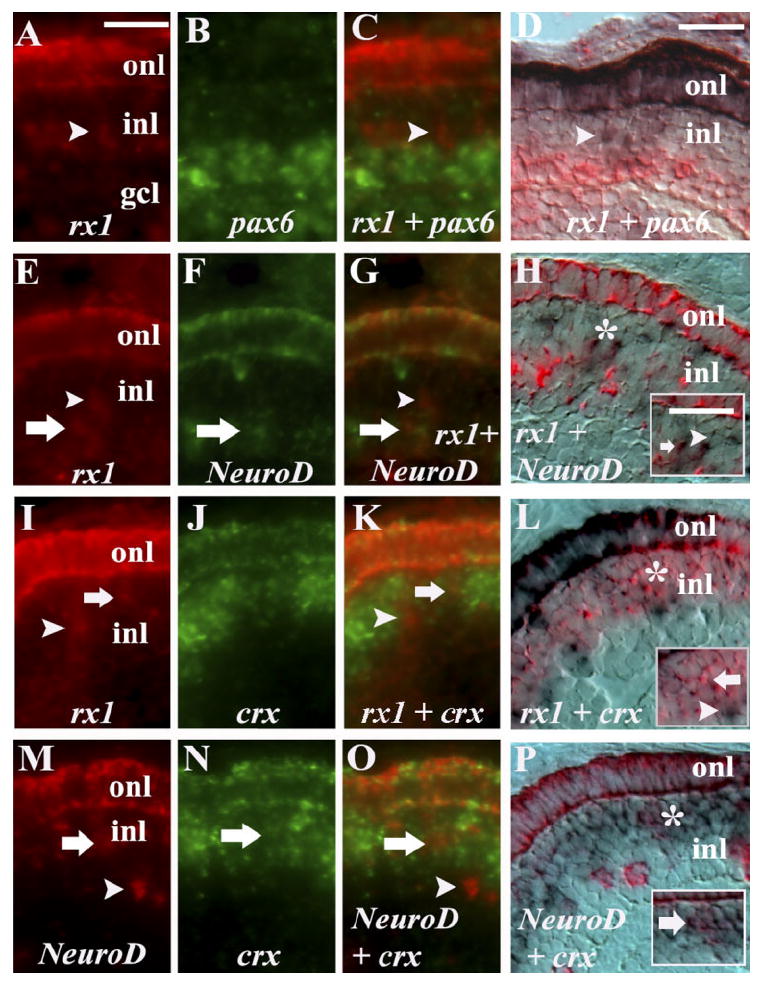
Rx1 coexpression with rod lineage markers. A–C: rx1 (A) and pax6 (B) double in situ; merged image (C) showing no colabeled cells (arrowhead). D: rx1 (purple) and pax6 (pink) using alternative reaction products; arrowhead = rx1+ cell only. E–G: rx1 (E) and NeuroD (F); merged image (G) showing colabeling in the inl (arrow) and throughout the onl; arrowhead = rx1+ cell only. H: rx1 (purple) and NeuroD (pink) using alternative reaction products; doubly-labeled cell (arrow) and rx1+ cell only (arrowhead). I–K: rx1 (I) and crx (J); merged image (K) showing a colabeled cell in the inl (arrow) and throughout the onl; arrowhead = rx1+ cell only. L: rx1 (purple) and crx (pink) using alternative reaction products, showing a doubly-labeled cell (arrow) and an rx1+ cell only (arrowhead). M–O: NeuroD (M) and crx (N); merged image (O) showing a colabeled cell in the inl (arrow) and throughout the onl; arrowhead = NeuroD+ cell only. P: NeuroD (pink) and crx (purple) using alternative reaction products, showing doubly-labeled cell (arrow). onl, outer nuclear layer; inl, inner nuclear layer; scale bar in A (applies to A–C,E–G,I–K,M–O) = 20 μm; in D (applies to E,H,L,P) = 20 μm. *, areas enlarged in insets.
Many of the rx1+/BrdU+ cells in the inl were observed in locations corresponding to locations of both NeuroD+/BrdU+ cells, and crx+/BrdU+ cells. In the interests of determining whether these three genes may cooperate in regulating the maturation of cells in the rod lineage, we performed rx1/NeuroD, rx1/crx, and crx/NeuroD colabeling experiments. For each combination, we used two alternative sets of visualization reagents, on an average of 60 sections from 16 embryos. In each case, colocalization of gene expression was observed throughout the onl (Fig. 7E–P), indicating that cones and rods, as well as rod precursors, co-express rx1, crx, and NeuroD (see also Bernardos et al., 2007; Ochocinska and Hitchcock, 2007). In addition, colocalization of rx1 and NeuroD expression was seen regularly in cells residing in the inl (Fig. 7E–H; in 84 sections of 23 embryos). Expression of rx1 together with crx was also observed in a population of cells residing within the crx expression domain (Fig. 7I–L; in 72 sections of 19 embryos). These experiments, along with those presented earlier (Fig. 3C–F) predicted that NeuroD and crx may be co-expressed by cells in the middle and distal inl. Our colabeling experiments, using two alternative sets of visualization reagents, confirmed that this is the case (Fig. 7M–P). Colabeling experiments using Nr2e3, nrl, rx2, and rx3 in combination with rx1, were challenging and/or difficult to interpret because of weaker hybridization signals.
We then counted the proportion of rx1+ cells that were colabeled with pax6, NeuroD, or crx, to understand potential combinatorial relationships of these transcription factors, using the compartments of the inl defined previously (Fig. 5A). Within the p-inl, rx1 colabeled only with NeuroD, and in only 25% of the cases (Fig. 5B). Within the m-inl, rx1+ cells were also NeuroD+ in 50% of the cases observed, but were always also crx+ (Fig. 5B). Interestingly, the rx1+ cells of the d-inl were less likely to be colabeled with either of these transcription factors, but the rx1+ cells of the onl coexpressed NeuroD and crx in all cases. These results corroborate the different temporal patterns of expression within the inl of the developing retina, and suggest that a complete combinatorial relationship among the three retinal transcription factors is associated only with cells of the embryonic onl. Only 19% of the rx1+ cells of the onl were rod opsin+ (Fig. 5B), the remainder being cones.
DISCUSSION
Identification of the Rod Lineage in Embryonic Zebrafish
The rod photoreceptor lineage in larval and adult teleost fish arises from stem cells residing in the inl of the retina; this lineage was first described using 3H-thymidine cell-labeling techniques in larval goldfish (Raymond and Rivlin, 1987). We have now identified cells of the rod lineage of the zebrafish embryo, by using BrdU incorporation over a defined developmental time. Our results suggest that BrdU labeling can be temporally selective for dividing cells of the rod lineage in zebrafish when administered between 60–65 hpf and examined in a spatially-restricted region between 72–80 hpf. The kinetic features of BrdU incorporation are consistent with a lineage of proliferating cells that migrate from the inl to the onl. The low-dose BrdU experiments showed reduced cell labeling as a function of time following injection, particularly in the onl, suggesting a dilution of a finite quantity of label. In contrast, the high-dose BrdU experiments showed increased cell labeling in the onl as a function of time following injection, with little variation in inl labeling, suggesting continuous incorporation of BrdU into a cell lineage that populates the onl from slowly-proliferating sources in the inl. Proliferation kinetics in the inl and onl over this time-course were confirmed by quantification of mitotic cells using the M-phase marker PH3. Using BrdU incorporation, recently generated BrdU+ rod photoreceptors can be reliably identified. Our gnat2 colabeling experiments indicate that when injections are performed at 60 hpf or later, the BrdU+ cone photoreceptors are restricted to the region adjacent to the cgz. Collectively, these data show a period of overlapping embryonic rod and cone production around 55 hpf, followed by the restriction of retinal proliferative activity to the rod lineage and the cgz (Hu and Easter, 1999; Ochocinska and Hitchcock, 2007).
Recent evidence indicates that Müller glia in postembryonic zebrafish correspond to the pax6+ stem cells of the inl that give rise to the rod lineage (Bernardos et al., 2007). Our BrdU labeling studies in embryos were able to detect BrdU+/GS+ cells located within the innermost region of the inl, as well as BrdU+/pax6+ cells with a similar laminar address. It is possible that these labeling methods identified representatives of the same cell population: embryonic Müller glia, acting as stem cells for the generation of rod photoreceptors (Bernardos et al., 2007). However, in embryos the proportion of BrdU+ cells colabeled by a Müller marker (3–12%) was far less than the proportion expressing pax6 (90%). Furthermore, the rate of proliferation of the embryonic Müller glia slowed considerably over the experimental time-course, and we have not observed mitotic Müller glia. Therefore, embryonic glia may be terminally differentiated, rather than contributing to the production of additional rod photoreceptors. At minimum, our studies are consistent with a lineage relationship between Müller glia and rods in the embryonic retina, at a time when these cell classes are initially being generated. The specific nature of any relationship may be distinct from the relationship described for the juvenile zebrafish, in which Müller glia are pax6+ and proliferate, generating cells of the rod lineage (Bernardos et al., 2007). We note that, in the juvenile zebrafish retina, rare cells were found that were pax6+ and proliferative, but were not Müller glia (Bernardos et al., 2007). These cells may be similar to the pax6+ stem cells of the embryonic rod lineage identified in the present study.
Expression of retinal homeobox 1 in Rod and Cone Photoreceptors and the Rod Lineage
The rx genes are required for normal eye development, and are expressed in multiple developmental contexts, including in photoreceptors (Mathers et al., 1997; Chuang et al., 1999; Chuang and Raymond, 2001; Andreazzoli et al., 2003; Bailey et al., 2004; Voronina et al., 2004). The mouse Rx transcription factor has been shown to interact with Crx to promote photoreceptor-specific gene expression (Kimura et al., 2000), but a specific role in photoreceptor development has been difficult to test in mammalian models, where manipulation of the single Rx gene results in profound ocular abnormalities due to the early role of Rx (Mathers et al., 1997; Voronina et al., 2004). In addition, rx-like genes, such as QRX, RaxL, and Rx-L, have been identified in many model organisms, where they appear to be photoreceptor-specific and regulate photoreceptor differentiation (Chen and Cepko, 2002; Wang et al., 2004; Pan et al., 2006). However, the most recent build of the zebrafish genome does not contain RaxL/Rx-L/QRX-like genes, leaving rx1 (and perhaps rx2) as the only retinal homeobox gene(s) available to regulate photoreceptor-specific gene expression in zebrafish. In the zebrafish, functional knockdown of rx3 results in defects in the RPE, while functional knockdown of rx1 results in the loss of the onl (Rojas-Muñoz et al.,2005; Nelson and Stenkamp, unpublished results). Collectively, these findings are consistent with evolutionary subfunctionalization of the zebrafish rx genes, such that rx3 is required for RPE development, while rx1 plays a role in photoreceptor development. The current study presents new findings that support this hypothesis.
Cone-selective expression of zebrafish rx1 and rx2 had been inferred from the expression patterns of these genes in adult retina, where rods and cones can be distinguished based upon laminar position (Chuang et al., 1999). Here, we have clarified the cell-selective expression of rx1 in embryonic retina through the use of several independent cell identification methods. Colabeling experiments with specific cone opsin cRNAs, and with gnat2 cRNA indicate that all spectral types of embryonic cones express rx1. In addition, colabeling experiments with rod-selective markers provide unambiguous evidence that the rx1 gene is also expressed by maturing embryonic rods. The rx1 gene product may, therefore, be involved in the regulation of photoreceptor gene expression in both rods and cones, a hypothesis we are testing through gene knockdown studies (Nelson and Stenkamp, unpublished observations).
In addition to photoreceptor expression of rx1, subpopulations of proliferative cells of the rod lineage, as identified through BrdU incorporation, are also rx1-positive. All of the BrdU-positive cells of the onl were also rx1-positive; therefore, not only rods but also rod precursor cells of the onl express rx1. This result suggests that rx1 may play a role in rod neurogenesis prior to rod terminal mitosis. However, approximately half of the rod lineage-related cells in all three compartments of the inl were rx1+, making rx1 a non-exclusive marker for rod progenitors. Since the expression domains of pax6 and rx1 appear to be mutually exclusionary, rx1 also cannot be considered as a marker for the stem cells of the rod lineage. The stem cells of the embryonic rod lineage are therefore distinct from the stem cells of the cgz, which co-express rx1 and pax6 (Raymond et al., 2006). Evidence from recent experiments in Xenopus supports a model in which rx1 and pax6 together maintain retinal progenitors in a proliferative, multipotent state (Zaghloul and Moody, 2007). If this model is correct, then the absence of rx1 expression in the pax6+ stem cells at the apex of the rod lineage is consistent with a bias in fate, in this case toward the production of rods. This is intriguing in light of the dual role of these stem cells; they also serve as a source of new retinal neurons following injury (Hitchcock et al., 1996; Otteson and Hitchcock, 2003), and therefore must either retain, or have the capacity to regain, a multipotent status. Consistent with this is a recent study demonstrating that the replacement of cones following cone degeneration requires Müller cell activation, while replacement of rods does not (Morris et al., 2008). The induction of the proneural gene, ash1a, was recently revealed as a critical step in the transition to multipotency of Müller glia following retinal damage (Yurco and Cameron, 2007; Fausett et al., 2008). Expression of rx1 in the inl was also enhanced following injury (Raymond et al., 2006), although co-expression with pax6 within Müller glia has not been demonstrated.
Finally, a large population of rx1+ cells residing within the embryonic inl does not appear to be associated with the rod lineage, as these cells do not colabel with BrdU using any of our labeling schemes. The identity of these rx1+ cells remains to be determined. It is possible that these cells are part of the rod lineage but were not proceeding through S-phase during the period of BrdU exposure.
The Genetic Hierarchy of the Rod Lineage in Embryonic Retina
Our experiments reveal the genetic sequence of development associated with maturation of the rod lineage of embryonic zebrafish. The spatiotemporal pattern of BrdU incorporation is consistent with an inner-to-outer movement of proliferating cells; this movement is accompanied by progressive changes in gene expression as the lineage matures (Fig. 8). At the apex of the rod lineage are pax6-positive cells, some of which may correspond to Müller glia whose cell bodies lie in the p-inl, and whose radial processes span the retina (see also Bernardos et al., 2007).
Fig. 8.
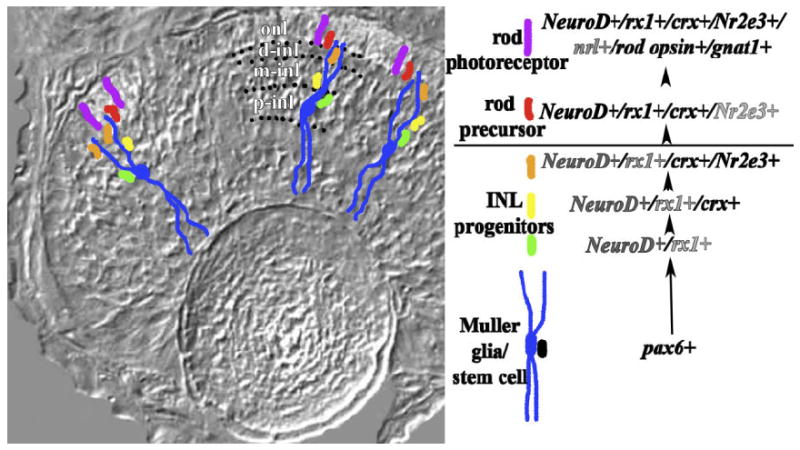
Gene expression in the embryonic rod lineage of zebrafish. Gene expression summary at right shows the genetic hierarchy of the rod lineage; darkness of font reflects the extent to which the transcription factor is expressed within the identified cells of the lineage. Pax6-positive Müller glia/stem cells are shown in blue with their cell bodies in the inner region of the inl. The summary at right illustrates an alternative scenario in which pax6+ stem cells (in black) generate embryonic Müller glia as well as cells of the rod lineage. As rod progenitors proliferate and migrate toward the onl, some become NeuroD-positive and rx1-positive (green cells), but none remain pax6-positive. All of these progenitors later express crx (yellow). Prior to entering the onl, some rod progenitors express NeuroD, rx1, and Nr2e3, while all continue to express crx (orange). All rod precursors of the onl (red) are NeuroD, rx1, crx, and Nr2e3-positive but do not express nrl, rod opsin, or gnat 1. Postmitotic rod photoreceptors (purple) express NeuroD, rx1, crx, Nr2e3, nrl, rod opsin, and gnat1. onl, outer nuclear layer; p-inl, m-inl, d-inl are proximal, middle, and distal compartments of the inl, respectively, and are delineated by dotted lines.
Alternatively, the pax6+ proliferative cells of the embryonic retina may serve as the source of both the rod lineage and Müller glia (Fig. 8). These cells are rx1-negative, and are therefore molecularly distinct from stem cells of the cgz. Because half of the BrdU-incorporating cell population of the p-inl is NeuroD+, it is possible that some of the rod lineage stem cells are also NeuroD+. Arguing against this are the colabeling studies of Ochocinska and Hitchcock (2007), in which the pax6+/NeuroD+ cells of the inl morphologically resembled amacrine cells, not stem cells. Our observed colabeling of rx1 and NeuroD in the p-inl instead suggests that expression of NeuroD and/or rx1, along with down-regulation of pax6, may represent a key step in molecular maturation of the rod lineage (Fig. 8), although during this step the lineage becomes molecularly heterogeneous. A more definitive shift in gene expression takes place as cells of the rod lineage enter the m-inl, where all rod progenitors express crx (see also Bernardos et al., 2007), and there is an increase in the proportion of rod progenitors that express rx1 (Fig. 7). Continued maturation of the rod lineage, as cells move into the d-inl, involves a further increase in the proportion of rod progenitors that express rx1, although the lineage remains heterogeneous in terms of transcription factor expression (Fig. 8). In a zebrafish model for rod degeneration and replacement, Nr2e3 expression was found throughout the lineage (Morris et al., 2008), rather than sporadically, as we have observed in undamaged embryonic retina. Damage-mediated upregulation of rod production may therefore alter the gene expression profile of inl rod progenitors.
The movement of rod progenitors across the outer plexiform layer marks the next change in gene expression. Now referred to as rod precursors, the cells of the rod lineage become molecularly homogeneous (Fig. 8). All of the BrdU+ cells of the onl express NeuroD, rx1, and crx, and virtually all of them express Nr2e3, consistent with a NeuroD+/rx1+/crx+/Nr2e3+ cell population that includes rod precursors as well as developing rods. The shift to homogeneity of gene expression in the onl suggests a regulatory mechanism, either a reduction of an inhibitory factor, or an increase of a stimulatory factor, that is associated with laminar position. Several extrinsic signaling molecules that regulate photoreceptor development arise from the retinal pigmented epithelium (rpe), and could serve this function, including sonic hedgehog (shh; Stenkamp et al., 2000). Experimental reduction in shh signaling results in reduced photoreceptor differentiation, such that rod and cone opsin expression is inhibited, although the onl appears normal in morphology (Stenkamp et al., 2002; Stenkamp and Frey, 2003). Interestingly, in these experiments, expression of rx1 is conspicuously absent from the onl, while NeuroD and crx are expressed in a normal pattern (Stenkamp et al., 2002). Sonic hedgehog may therefore be one of the factors that influence gene expression in rod progenitors as they enter the onl, specifically influencing expression of rx1. The shift to homogeneity of gene expression in the onl may in turn allow for the production of rod photoreceptors.
The photoreceptor markers, nrl, rod opsin, and gnat1, are not expressed by all BrdU+ cells of the onl, consistent with these markers being specific to postmitotic, maturing rod photoreceptors, but not to rod precursors. Therefore, while the collective expression of NeuroD, rx1, crx, and Nr2e3 may be involved in rod differentiation, it is not sufficient. In other vertebrates, the transcription factor Nrl likely regulates this final step. In Nrl −/− mice, rods are transformed to an S-cone fate (Mears et al., 2001; Daniele et al., 2005; Akimoto et al., 2006), and in Xenopus, nrl overexpression generates supernumerary rods at the expense of cones (McIlvain and Knox, 2007). However, the zebrafish nrl does not appear to be specific to rod photoreceptors, in that expression of nrl was also seen in cone progenitors (and the lens). Interestingly, the set of genes expressed by rod progenitors in the zebrafish is the same as the set of genes expressed by cone progenitors, including nrd (Ochocinska and Hitchcock, 2007), crx (Bernardos et al., 2007), Nr2e3 (Chen et al., 2005), nrl (current study), and rx1, which is downregulated in the cgz, and then upregulated in nascent cones (Chuang et al., 1999). The rod and cone lineages also have in common the downregulation of pax6 (Hitchcock et al., 1996). The production of rod photoreceptors from a spatiotemporally defined rod lineage appears to be unique to fishes, and has been presented as an example of a challenge in constructing a “unified model of photoreceptor cell fate specification in vertebrates” (Adler and Raymond, 2007). However, the developmental genetic history of the cells fated to become rods is virtually identical to that of cells fated to become cones, suggesting that, even in the distinctive retinas of fishes, the molecular features of rod and cone neurogenesis are conserved.
EXPERIMENTAL PROCEDURES
Animals and BrdU injections
All experiments using animals were approved by the University of Idaho’s Animal Care and Use Committee. Adult zebrafish were either of the AB strain or a strain originally obtained from Scientific Hatcheries (“SH”), and were bred and raised in-house, in aquatic housing units on recirculating, filtered, and monitored system water. Fish were bred and embryos were collected and maintained in small beakers in system water at 28.5°C, then manually dechorionated (Westerfield, 2000). BrdU injections were performed according to Hu and Easter (1999). Embryos were lightly anaesthetized (0.05% MS-222; Sigma), or were immobilized against the edge of a coverslip to minimize movement, then a micropipette was introduced into the yolk and approximately 0.5 to 1.5 nL (as indicated in the Results section) of 10 mM BrdU in sterile saline was delivered through the use of a pressurized injection system. Volumes were calibrated by spherical geometry. Injected embryos were returned to system water until the time of fixation.
Tissue Processing
Embryos were fixed in 4% paraformaldehyde in buffered 5% sucrose for 1 hr, and were then washed with increasing concentrations of buffered 5% sucrose before cyroprotecting overnight in 20% sucrose. Embryos were embedded in a 2:1 solution of 20% sucrose:OCT embedding compound (Sakura Finetek, Torrance, CA), frozen and cryosectioned at 3–5 μm (as indicated below). Sections were tracked according to specific, identified embryos, in order to process all sections from a single embryo for a specific marker.
In Situ Hybridization and Immunocytochemistry
Digoxigenin-labeled (DIG) and/or fluorescein-labeled (FL) cRNA probes were prepared from the following full-length cDNAs using components of the Genius Kit (Roche): zebrafish rod opsin, red cone opsin, blue cone opsin, and UV opsin (gifts of T. Vihtelic), gnat1 and gnat2 (gifts of Q. Liu), pax6, (gifts of S. Wilson), NeuroD (gift of V. Korhz), crx (gift of P. Raymond), rx1, rx2, and rx3 (gifts of P. Mathers), nrl (gift of P. Hitchcock, obtained through Open Biosystems Repository; Gen-Bank Accession BC115080, identical to sequence reported by Coolen et al., 2005), and Nr2e3 (gift of J. Nathans). In situ hybridization methods for cryosections have been described (Barthel and Raymond, 1993).
For in situs in combination with BrdU immuocytochemistry, we utilized the methods of Stenkamp et al. (1997). In brief, the NBT/BCIP color reaction was used, yielding a dark purple/blue precipitate. Hybridized sections were then washed in a 1:1 solution of 4N HCl:PBST (phosphate-buffered saline + 0.05% Triton X-100) for 30 min, followed by washes in PBST and PBS, then sections were blocked in 20% normal goat serum prior to overnight incubation at 4°C with the primary antibody, monoclonal rat anti-BrdU (Accurate Chemical, Westbury, NY). Sections were washed with PBST, then incubated in secondary antibody (donkey anti-rat Cy3; Jackson Immunoscientific, West Grove, PA). For these experiments,5-μM sections were used to allow the color product from in situ hybridization to survive the BrdU detection steps.
For dual immunocytochemistry (BrdU in combination with another retinal cell maker), the following antibodies were used: rabbit polyclonal anti-PH3 (1:1,000; Upstate Cell Signaling Solutions, Lake Placid, NY); mouse monoclonal zpr-1 (1:200; Zebrafish International Resource Center, Eugene, OR); mouse monoclonal anti-glutamine synthetase (GS; 1:5,000; BD Biosciences, San Diego, CA); rabbit polyclonal anti-protein kinase C (PKC; 1:200; Santa Cruz Biotechnologies, Santa Cruz, CA); mouse monoclonal anti-islet1 (1:200; Developmental Studies Hybridoma Bank, Ames, IA); rabbit polyclonal anti-Crx (1:100; using the antibody retrieval method of Raymond et al., 2006; the gift of Pamela Raymond); and mouse monoclonal MPM-2 (1:100; Millipore, Billerica, MA). Sections were processed first for one of the above antibodies, followed by an appropriate secondary antibody conjugated to Cy3 (Jackson Immunoscientific), and were then processed for anti-BrdU indirect immunofluorescence, using goat anti-rat conjugated to FITC (Jackson Immunoscientific). Section thickness was not an issue for retention of immunofluorescence, and so for these experiments, 3–5-μM sections were used.
For double-label in situs, DIG and FL probes were applied together. The DIG probe was detected with anti-DIG antibody conjugated to alkaline phosphatase, followed by use of the Fast Red color substrate (Roche), resulting in a red precipitate that is also fluorescent. The FL probe was detected with anti-FL antibody conjugated to horseradish peroxidase, followed by use of the Tyramide Signal Amplification fluorescent system (TSA-biotin/avidin-FITC, Perkin-Elmer, Boston, MA), resulting in green fluorescence (Ochocinska and Hitchcock, 2007). The results of most probe combinations were confirmed using an additional double in situ technique (Hauptmann and Gerster, 1994; Stenkamp et al., 2000). In brief, DIG probe was detected as in the above protocol, but this was followed by treatment with 2N HCl to inactivate the alkaline phosphatase. Sections were then post-fixed in 4% paraformaldehyde, and the FL probe was detected with anti-FL antibody conjugated to alkaline phosphatase, followed by use of the NBT/BCIP color substrate. For both types of procedures, 5-μM-thick sections were needed to optimally retain both reaction products.
Microscopy, Photography, and Cell Counting
Sections were viewed on a Lieca DMR microscope under epifluorescence and Nomarski optics. The numbers of BrdU+ cells in each retinal layer were counted for each section, and then were averaged for each identified embryo. These counts included only the fully laminated part of the retina. Sections labeled for expression of a specific gene in combination with BrdU were processed as follows. A series of images from each identified embryo were collected using a SPOT digital camera. Epifluorescence and Nomarski images were combined, using the “apply image” function in Adobe Photoshop CS, and scored for the presence of double-labeled cells (in situ reaction product+/BrdU+) in any retinal layer or indicated compartment of the inl. Additional images were collected using brightfield optics to verify that Nomarski visual artifacts were not contributing to the impression of a positive label. Sections doubly-labeled for expression of two genes were analyzed by combining epifluorescence images and inspecting these images for regions of yellow-white fluorescence, indicating dual label. Combinations of single epifluorescence images and Nomarski images were also inspected to confirm identity of doubly-labeled cells. Statistical analyses consisted of one-way ANOVA followed by post-hoc comparison, or Student’s t-test, or the non-parametric Kolmogorov-Smirnov test, where appropriate.
Acknowledgments
The authors are grateful to members of the zebrafish community for the following cDNAs: the zebrafish opsins (T. Vihtelic); the zebrafish transducins (Q. Liu); pax6 (S. Wilson); NeuroD/nrd (V. Korzh); crx (P. Raymond); rx1, rx2, rx3 (P. Mathers), nrl (P. Hitchcock), and pnr/Nr2e3 (J. Nathans). We thank Dr. Pamela Raymond for the gift of the anti-crx antibody, and Dr. Peter Hitchcock for a critical evaluation of an earlier version of the manuscript. This work was supported by NIH R01EY012146 (D.L.S.), and by graduate (S.M.N.) and undergraduate (S.L.W.) student fellowships available through NIH P20RR015587 (Idaho INBRE).
Grant sponsor: NIH; Grant number: R01EY012146; Grant sponsor: NIH; Grant number: P20RR015587.
Footnotes
Published online 19 September 2008 in Wiley InterScience (www.interscience.wiley.com).
References
- Adler R, Raymond PA. Have we achieved a unified model of photoreceptor cell fate specification in vertebrates? Brain Res. 2008;1192:134–150. doi: 10.1016/j.brainres.2007.03.044. [DOI] [PMC free article] [PubMed] [Google Scholar]
- Akimoto M, Cheng H, Zhu D, Brzezinski JA, Khanna R, Filippova E, Oh EC, Jing Y, Linares JL, Brooks M, Zareparsi S, Mears AJ, Hero A, Glaser T, Swaroop A. Targeting of GFP to newborn rods by Nrl promoter and temporal expression profiling of flow-sorted photoreceptors. Proc Natl Acad Sci U S A. 2006;103:3890–3895. doi: 10.1073/pnas.0508214103. [DOI] [PMC free article] [PubMed] [Google Scholar]
- Altshuler D, Turner D, Cepko C. Specification of cell types in the vertebrate retina. In: Lam D, Shatz C, editors. Development of the visual system. Cambridge: MIT Press; 1991. pp. 37–58. [Google Scholar]
- Andreazzoli M, Gestri G, Cremisi F, Casarosa S, Dawid IB, Barsacchi G. Xrx1 controls proliferation and neurogenesis in Xenopus anterior neural plate. Development. 2003;130:5143–5154. doi: 10.1242/dev.00665. [DOI] [PubMed] [Google Scholar]
- Bailey TJ, El-Hodiri H, Zhang L, Shah R, Mathers PH, Jamrich M. Regulation of vertebrate eye development by Rx genes. Int J Dev Biol. 2004;48:761–770. doi: 10.1387/ijdb.041878tb. [DOI] [PubMed] [Google Scholar]
- Barthel LK, Raymond PA. Subcellular localization of alpha-tubulin and opsin mRNA in the goldfish retina using digoxigenin-labeled cRNA probes detected by alkaline phosphatase and HRP histochemistry. J Neurosci Methods. 1993;50:145–152. doi: 10.1016/0165-0270(93)90002-9. [DOI] [PubMed] [Google Scholar]
- Bernardos RL, Barthel LK, Meyers JR, Raymond PA. Late-stage neuronal progenitors in the retina are radial Muller glia that function as retinal stem cells. J Neurosci. 2007;27:7028–7040. doi: 10.1523/JNEUROSCI.1624-07.2007. [DOI] [PMC free article] [PubMed] [Google Scholar]
- Blaxter JHS, Staines M. Pure-cone retinae and retinomotor responses in larval teleosts. J mar biol Ass. 1970;47:677–697. [Google Scholar]
- Carter-Dawson LD, LaVail MM. Rods and cones in the mouse retina. I. Structural analysis using light and electron microscopy. J Comp Neurol. 1979;188:245–262. doi: 10.1002/cne.901880204. [DOI] [PubMed] [Google Scholar]
- Chen CM, Cepko CL. The chicken RaxL gene plays a role in the initiation of photoreceptor differentiation. Development. 2002;129:5363–5375. doi: 10.1242/dev.00114. [DOI] [PubMed] [Google Scholar]
- Chen J, Rattner A, Nathans J. The rod photoreceptor-specific nuclear receptor Nr2e3 represses transcription of multiple cone-specific genes. J Neurosci. 2005;25:118–129. doi: 10.1523/JNEUROSCI.3571-04.2005. [DOI] [PMC free article] [PubMed] [Google Scholar]
- Chuang JC, Raymond PA. Zebrafish genes rx1 and rx2 help define the region of forebrain that gives rise to retina. Dev Biol. 2001;231:13–30. doi: 10.1006/dbio.2000.0125. [DOI] [PubMed] [Google Scholar]
- Chuang JC, Mathers PH, Raymond PA. Expression of three Rx homeobox genes in embryonic and adult zebrafish. Mech Dev. 1999;84:195–198. doi: 10.1016/s0925-4773(99)00077-5. [DOI] [PubMed] [Google Scholar]
- Coolen M, SiiFelice K, Bronchain O, Mazabraud A, Bourrat F, Retaux S, Felder-Schmittbuhl MP, Mazan S, Plouhinec JL. Phylogenomic analysis and expression patterns of large Maf genes in Xenopus tropicalis provide new insights into the functional evolution of the gene family in osteichthyans. Dev Genes Evol. 2005;215:327–339. doi: 10.1007/s00427-005-0476-y. [DOI] [PubMed] [Google Scholar]
- Daniele LL, Lillo C, Lyubarsky AL, Nikonov SS, Philp N, Mears AJ, Swaroop A, Williams DS, Pugh EN., Jr Cone-like morphological, molecular, and electrophysiological features of the photoreceptors of the Nrl knockout mouse. Invest Ophthalmol Vis Sci. 2005;46:2156–2167. doi: 10.1167/iovs.04-1427. [DOI] [PMC free article] [PubMed] [Google Scholar]
- Fausett BV, Gumerson JD, Goldman D. The proneural basic helix-loop-helix gene ascl1a is required for retina regeneration. J Neurosci. 2008;28:1109–1117. doi: 10.1523/JNEUROSCI.4853-07.2008. [DOI] [PMC free article] [PubMed] [Google Scholar]
- Hauptmann G, Gerster T. Two-color whole-mount in situ hybridization to vertebrate and Drosophila embryos. Trends Genet. 1994;10:266. doi: 10.1016/0168-9525(90)90008-t. [DOI] [PubMed] [Google Scholar]
- Hitchcock PF, Macdonald RE, VanDeRyt JT, Wilson SW. Antibodies against Pax6 immunostain amacrine and ganglion cells and neuronal progenitors, but not rod precursors, in the normal and regenerating retina of the goldfish. J Neurobiol. 1996;29:399–413. doi: 10.1002/(SICI)1097-4695(199603)29:3<399::AID-NEU10>3.0.CO;2-4. [DOI] [PubMed] [Google Scholar]
- Hitchcock P, Ochocinska M, Sieh A, Otteson D. Persistent and injury-induced neurogenesis in the vertebrate retina. Prog Retin Eye Res. 2004;23:183–194. doi: 10.1016/j.preteyeres.2004.01.001. [DOI] [PubMed] [Google Scholar]
- Hu M, Easter SS. Retinal neurogenesis: the formation of the initial central patch of postmitotic cells. Dev Biol. 1999;207:309–321. doi: 10.1006/dbio.1998.9031. [DOI] [PubMed] [Google Scholar]
- Johns PR, Fernald RD. Genesis of rods in teleost fish retina. Nature. 1981;293:141–142. doi: 10.1038/293141a0. [DOI] [PubMed] [Google Scholar]
- Julian D, Ennis K, Korenbrot JI. Birth and fate of proliferative cells in the inner nuclear layer of the mature fish retina. J Comp Neurol. 1998;394:271–282. [PubMed] [Google Scholar]
- Kimura A, Singh D, Wawrousek EF, Kikuchi M, Nakamura M, Shinohara T. Both PCE-1/RX and OTX/CRX interactions are necessary for photoreceptor-specific gene expression. J Biol Chem. 2000;275:1152–1160. doi: 10.1074/jbc.275.2.1152. [DOI] [PubMed] [Google Scholar]
- Kitambi SS, Hauptmann G. The zebrafish orphan nuclear receptor genes nr2e1 and nr2e3 are expressed in developing eye and forebrain. Gene Expr Patterns. 2007;7:521–528. doi: 10.1016/j.modgep.2006.10.006. [DOI] [PubMed] [Google Scholar]
- Knight JK, Raymond PA. Time course of opsin expression in developing rod photoreceptors. Development. 1990;110:1115–1120. doi: 10.1242/dev.110.4.1115. [DOI] [PubMed] [Google Scholar]
- Koulen P, Brandstatter JH, Kroger S, Enz R, Bormann J, Wassle H. Immunocytochemical localization of the GABA(C) receptor rho subunits in the cat, goldfish, and chicken retina. J Comp Neurol. 1997;380:520–532. doi: 10.1002/(sici)1096-9861(19970421)380:4<520::aid-cne8>3.0.co;2-3. [DOI] [PubMed] [Google Scholar]
- Larison KD, Bremiller R. Early onset of phenotype and cell patterning in the embryonic zebrafish retina. Development. 1990;109:567–576. doi: 10.1242/dev.109.3.567. [DOI] [PubMed] [Google Scholar]
- Lisner P, Moseona AA. Induction of glutamine synthetase in embryonic neural retina: localization in Müller fibers and dependence on cell interactions. Proc Natl Acad Sci U S A. 1979;76:6476–6480. doi: 10.1073/pnas.76.12.6476. [DOI] [PMC free article] [PubMed] [Google Scholar]
- Liu Y, Shen Y, Rest JS, Raymond PA, Zack DJ. Isolation and characterization of a zebrafish homologue of the cone rod homeobox gene. Invest Ophthalmol Vis Sci. 2001;42:481–487. [PubMed] [Google Scholar]
- Masland RH, Tauchi M. The cholinergic amacrine cells. Trends Neurosci. 1986;9:218–223. [Google Scholar]
- Mathers PH, Grinberg A, Mahon KA, Jamrich M. The Rx homeobox gene is essential for vertebrate eye development. Nature. 1997;387:603–607. doi: 10.1038/42475. [DOI] [PubMed] [Google Scholar]
- McIlvain VA, Knox BE. Nr2e3 and Nrl can reprogram retinal precursors to the rod fate in Xenopus retina. Dev Dyn. 2007;236:1970–1979. doi: 10.1002/dvdy.21128. [DOI] [PubMed] [Google Scholar]
- Mears AJ, Kondo M, Swain PK, Takada Y, Bush RA, Saunders TL, Sieving PA, Swaroop A. Nrl is required for rod photoreceptor development. Nat Genet. 2001;29:447–452. doi: 10.1038/ng774. [DOI] [PubMed] [Google Scholar]
- Mitton KP, Swain PK, Chen S, Xu S, Zack DJ, Swaroop A. The leucine zipper of NRL interacts with the CRX homeodomain. A possible mechanism of transcriptional synergy in rhodopsin regulation. J Biol Chem. 2000;275:29794–29799. doi: 10.1074/jbc.M003658200. [DOI] [PubMed] [Google Scholar]
- Morris AC, Scholz RL, Brockerhoff SE, Fadool JM. Genetic dissection reveals two separate pathways for rod and cone regeneration in the teleost retina. Dev Nurobiol. 2008;68:605–619. doi: 10.1002/dneu.20610. [DOI] [PMC free article] [PubMed] [Google Scholar]
- Morrow EM, Furukawa T, Lee JE, Cepko CL. NeuroD regulates multiple functions in the developing neural retina in rodent. Development. 1999;126:23–36. doi: 10.1242/dev.126.1.23. [DOI] [PubMed] [Google Scholar]
- Ochocinska MJ, Hitchcock PF. Dynamic expression of the basic helix-loop-helix transcription factor neuroD in the rod and cone photoreceptor lineages in the retina of the embryonic and larval zebrafish. J Comp Neurol. 2007;501:1–12. doi: 10.1002/cne.21150. [DOI] [PubMed] [Google Scholar]
- Otteson DC, Hitchcock PF. Stem cells in the teleost retina: persistent neurogenesis and injury-induced regeneration. Vision Res. 2003;43:927–936. doi: 10.1016/s0042-6989(02)00400-5. [DOI] [PubMed] [Google Scholar]
- Otteson DC, D’Costa AR, Hitchcock PF. Putative stem cells and the lineage of rod photoreceptors in the mature retina of the goldfish. Dev Biol. 2001;232:62–76. doi: 10.1006/dbio.2001.0163. [DOI] [PubMed] [Google Scholar]
- Pan Y, Nekkalapudi S, Kelly LE, El-Hodiri HM. The Rx-like homeobox gene (Rx-L) is necessary for normal photoreceptor development. Invest Ophthalmol Vis Sci. 2006;47:4245–4253. doi: 10.1167/iovs.06-0167. [DOI] [PMC free article] [PubMed] [Google Scholar]
- Raymond PA, Rivlin PK. Germinal cells in the goldfish retina that produce rod photoreceptors. Dev Biol. 1987;122:120–138. doi: 10.1016/0012-1606(87)90338-1. [DOI] [PubMed] [Google Scholar]
- Raymond PA, Barthel LK, Curran GA. Developmental patterning of rod and cone photoreceptors in embryonic zebrafish. J Comp Neurol. 1995;359:537–550. doi: 10.1002/cne.903590403. [DOI] [PubMed] [Google Scholar]
- Raymond PA, Barthel LK, Bernardos RL, Perkowski JJ. Molecular characterization of retinal stem cells and their niches in adult zebrafish. BMC Dev Biol. 2006;6:36. doi: 10.1186/1471-213X-6-36. [DOI] [PMC free article] [PubMed] [Google Scholar]
- Rojas-Munoz A, Dahm R, Nusslein-Volhard C. chokh/rx3 specifies the retinal pigment epithelium fate independently of eye morphogenesis. Dev Biol. 2005;288:348–362. doi: 10.1016/j.ydbio.2005.08.046. [DOI] [PubMed] [Google Scholar]
- Shen YC, Raymond PA. Zebrafish cone-rod (crx) homeobox gene promotes retinogenesis. Dev Biol. 2004;269:237–251. doi: 10.1016/j.ydbio.2004.01.037. [DOI] [PubMed] [Google Scholar]
- Stenkamp DL. Neurogenesis in the fish retina. Int Rev Cytol. 2007;259:173–224. doi: 10.1016/S0074-7696(06)59005-9. [DOI] [PMC free article] [PubMed] [Google Scholar]
- Stenkamp DL, Frey RA. Extraretinal and retinal hedgehog signaling sequentially regulate retinal differentiation in zebrafish. Dev Biol. 2003;258:349–363. doi: 10.1016/s0012-1606(03)00121-0. [DOI] [PubMed] [Google Scholar]
- Stenkamp DL, Hisatomi O, Barthel LK, Tokunaga F, Raymond PA. Temporal expression of rod and cone opsins in embryonic goldfish retina predicts the spatial organization of the cone mosaic. Invest Ophthalmol Vis Sci. 1996;37:363–376. [PubMed] [Google Scholar]
- Stenkamp DL, Barthel LK, Raymond PA. Spatiotemporal coordination of rod and cone photoreceptor differentiation in goldfish retina. J Comp Neurol. 1997;382:272–284. doi: 10.1002/(sici)1096-9861(19970602)382:2<272::aid-cne10>3.0.co;2-u. [DOI] [PubMed] [Google Scholar]
- Stenkamp DL, Frey RA, Prabhudesai SN, Raymond PA. Function for Hedgehog genes in zebrafish retinal development. Dev Biol. 2000;220:238–252. doi: 10.1006/dbio.2000.9629. [DOI] [PubMed] [Google Scholar]
- Stenkamp DL, Frey RA, Mallory DE, Shupe EE. Embryonic retinal gene expression in sonic-you mutant zebrafish. Dev Dyn. 2002;225:344–350. doi: 10.1002/dvdy.10165. [DOI] [PubMed] [Google Scholar]
- Vihtelic TS, Fadool JM, Gao J, Thornton KA, Hyde DR, Wistow G. Expressed sequence tag analysis of zebrafish eye tissues for NEIBank. Mol Vis. 2005;11:1083–1100. [PubMed] [Google Scholar]
- Voronina VA, Kozhemyakina EA, O’Kernick CM, Kahn ND, Wenger SL, Linberg JV, Schneider AS, Mathers PH. Mutations in the human RAX homeobox gene in a patient with anophthalmia and sclerocornea. Hum Mol Genet. 2004;13:315–322. doi: 10.1093/hmg/ddh025. [DOI] [PubMed] [Google Scholar]
- Wang QL, Chen S, Esumi N, Swain PK, Haines HS, Peng G, Melia BM, McIntosh I, Heckenlively JR, Jacobson SG, Stone EM, Swaroop A, Zack DJ. QRX, a novel homeobox gene, modulates photoreceptor gene expression. Hum Mol Genet. 2004;13:1025–1040. doi: 10.1093/hmg/ddh117. [DOI] [PubMed] [Google Scholar]
- Westerfield M. The Zebrafish Book: a guide for the laboratory use of the zebrafish (Danio rerio) 4. Eugene, Oregon: University of Oregon Press; 2000. [Google Scholar]
- Young RW. Cell differentiation in the retina of the mouse. Anat Rec. 1985;212:199–205. doi: 10.1002/ar.1092120215. [DOI] [PubMed] [Google Scholar]
- Yurco P, Cameron DA. Cellular correlates of proneural and Notch-delta gene expression in the regenerating zebrafish retina. Vis Neurosci. 2007;24:437–443. doi: 10.1017/S0952523807070496. [DOI] [PubMed] [Google Scholar]
- Zaghloul NA, Moody SA. Alterations of rx1 and pax6 expression levels at neural plate stages differentially affect the production of retinal cell types and maintenance of retinal stem cell qualities. Dev Biol. 2007;306:222–240. doi: 10.1016/j.ydbio.2007.03.017. [DOI] [PubMed] [Google Scholar]
- Zhang L, Mathers PH, Jamrich M. Function of Rx, but not Pax6, is essential for the formation of retinal progenitor cells in mice. Genesis. 2000;28:135–142. [PubMed] [Google Scholar]