Abstract
The creation of psychophysical tasks for the behavioral neurosciences has generally relied upon low-level software running on a limited range of hardware. Despite the availability of software that allows the coding of behavioral tasks in high-level programming environments, many researchers are still reluctant to trust the temporal accuracy and resolution of programs running in such environments, especially when they run atop non-real-time operating systems. Thus, the creation of behavioral paradigms has been slowed by the intricacy of the coding required and their dissemination across labs has been hampered by the various types of hardware needed. However, we demonstrate here that, when proper measures are taken to handle the various sources of temporal error, accuracy can be achieved at the one millisecond time-scale that is relevant for the alignment of behavioral and neural events.
Keywords: Neurophysiology, Psychophysics, Matlab, Behavioral Control, Software, Cognition, Human, Monkey
INTRODUCTION
Carefully designed and precisely executed behavioral tasks are the bedrock of modern cognitive and systems neuroscience. Because of the crucial requirement for temporal precision, the construction of these tasks has generally relied upon low-level programs written to function on very specific video presentation and data acquisition hardware (Hays et al., 1982; White et al., 1989–2008; Ghose et al., 1995; Maunsell, 2008). When this hardware becomes obsolete or is discontinued, researchers must invest significant amounts of time re-writing the core, low-level programs. Meanwhile, many researchers are comfortable with high-level programs, such as Matlab, for data analysis, and would appreciate being able to code behavioral tasks in the same, flexible manner. However, most share reasonable suspicions about the ability of such a highly abstracted programming environment executing on a non-real-time operating system to deliver temporally precise control over behavior. Fortunately, as we show here, when the relevant issues are managed appropriately, behavioral control software written in a high-level programming environment can achieve the performance necessary for millisecond-scale temporal accuracy and reproducibility.
Below, we identify several potential obstacles to precise and reliable timing in a high-level software environment, and show data to determine which of these represent true problems; we then present our solutions to these problems as they arise. Some issues presented here are well known and have generally accepted solutions. Others have been appreciated in a qualitative sense, but have not been quantitatively characterized, if at all. A few issues have not been previously discussed in the literature, and may affect some software systems currently in use for behavioral control. Our treatment of these issues is intended to apply in a general manner to anyone who is considering writing behavioral control software in a high-level programming environment.
MATERIALS AND METHODS
Our test system was composed of a Dell Computer with a Pentium Core 2 Duo processor (model 6300) running at 1.86 GHz and containing 1 GB of RAM (Dell Inc, Round Rock, TX). The operating system was Microsoft Windows XP, service pack 2 (Microsoft, Redmond, WA). The graphics hardware in this machine consisted of an nVidia Quadro NVS 285 with 256 MB of video RAM. Output from this dual-headed graphics card was split to a subject display running in full-screen mode at a pixel resolution of 800 × 600, and an experimenter’s control display, running in windowed mode at a resolution of 1024 × 768. The displays were standard cathode-ray tubes measuring 15 inches in the diagonal, also from Dell. For the tests reported here, the displays refreshed at 60 Hz.
Data acquisition boards consisted of two PCI-6229 multi-function devices (a.k.a., DAQ boards), each connected to a BNC-2090a break-out box (National Instruments, Austin, TX). We also tested two National Instruments USB-6009 devices, for comparison. A Plexon neural data acquisition system (Plexon Inc, Dallas, TX) was used to compare time-stamps sent digitally by these boards with a signal from a photoresistor positioned against the subject’s display.
Matlab software (version r2007b, The Mathworks Inc, Natick, MA), including the Data Acquisition Toolbox and the Image Processing Toolbox, was used to write the behavioral control software tested here, and to analyze timing data, as described below. Matlab was run in the default, non-multi-threaded mode. Matlab figures (those created using the built-in graphics functions) relied upon OpenGL with hardware acceleration enabled. Low-level routines for video control (based on DirectX from Microsoft Corp.) were obtained through the generosity of Jeffrey S. Perry at the University of Texas at Austin. All tests were run within Matlab with the Java Virtual Machine disabled (launched by typing “matlab–nojvm” at the windows command prompt).
To optimize performance, a streamlined system profile was created from which unnecessary devices (i.e., network, security, and printer-related devices) were removed. For the timing tests described here, Matlab was the only application running. In addition to essential windows system processes and one Matlab process (matlab.exe), processes running at the time these tests were carried out included ten from National Instruments (nidevmon.exe, nimxs.exe, nidmsrv.exe, nitcidl5.exe, lkads.exe, lktsrv.exe, lkcitdl.exe, nipalsm.exe and nisvcloc.exe), and two related to the Intel Application Accelerator (IAAnotif.exe and IAANTmon.exe).
RESULTS
In order to have true millisecond-level temporal resolution on standard PC with off-the-shelf video display and data acquisition hardware, and running a modern multi-tasking operating system, several potential obstacles must be overcome or at least managed appropriately: 1) Video displays are updated (refreshed) with a relatively slow periodicity that is not in any way synchronized to a subject’s time-varying behavioral output; 2) Most data acquisition hardware have on-board data buffers that temporarily store acquired analog samples before transferring them to motherboard memory at relatively infrequent intervals, and so these data are not available for behavioral monitoring until the transfers have taken place; 3) High-level programming environments, such as Matlab, trade ease of coding for high costs in execution speed, and furthermore run atop operating systems which are not are not “hard” real-time capable. Therefore, they may be interrupted by competing processes and applications, potentially resulting in unexpected delays in behavioral monitoring and control. Here we examine each of these three issues in turn, and describe our solutions in each case.
Video Timing Issues
The first timing issue is a property of standard video display hardware. Strictly periodic video refreshes result in relatively poor predictability of video stimulus timing relative to a subject's time-varying behavior. In other words, if a visual stimulus is to be turned on after some specified behavioral event (e.g., the subject fixates), and that behavioral event occurs 2 milliseconds after the latest refresh, the stimulus will not appear for another 8 milliseconds (on a monitor running at 100 Hz, and disregarding the vertical blank interval). If, on the other hand, the subject had fixated slightly later, say 7 milliseconds after the latest refresh, that stimulus will appear only ~3 milliseconds later. (This does not take into account the position of that stimulus on the screen when using a CRT: an image in the center of the screen will require another n milliseconds for the raster beam to reach that point, where n is the refresh period minus the vertical blank duration, multiplied by the fraction of the total raster travel distance to the object, here 0.5). One way around this limitation (still used by many labs) is to employ an LED array. However, many experiments designed to examine higher level sensori-motor or cognitive behaviors require the ability to display more complex stimuli. In such cases, the timing of the refresh (i.e., vertical blank) can be time-stamped to give an accurate indication of when a visual stimulus was presented, even though this specific instant itself cannot be pre-determined. We found that such a time-stamp generated from within Matlab had an accuracy that was within one-millisecond of the actual appearance of the stimulus on the video display, as determined using a photoresistor (standard deviation = 0.3 ms).
Furthermore, in order to minimize the lag between the software call to activate a stimulus and its appearance, the relatively slower steps of creating a video memory buffer and copying image data into that buffer can be performed in advance (e.g., during the inter-trial interval). Then, during trial execution, the appropriate buffers can be “blitted” to the video back-plane (a very fast operation on modern graphics hardware). Once this back-plane has been fully populated with those stimuli that are intended to appear simultaneously, this back-plane can be “flipped” into the active (visible) position. While this preemptive strategy may necessitate copying images into video memory that, depending on the subject’s behavior, may not actually be used, the large amount of video RAM available on modern graphics cards allows more than sufficient memory for hundreds, if not thousands, of images, depending on the size of each.
Data Acquisition Issues
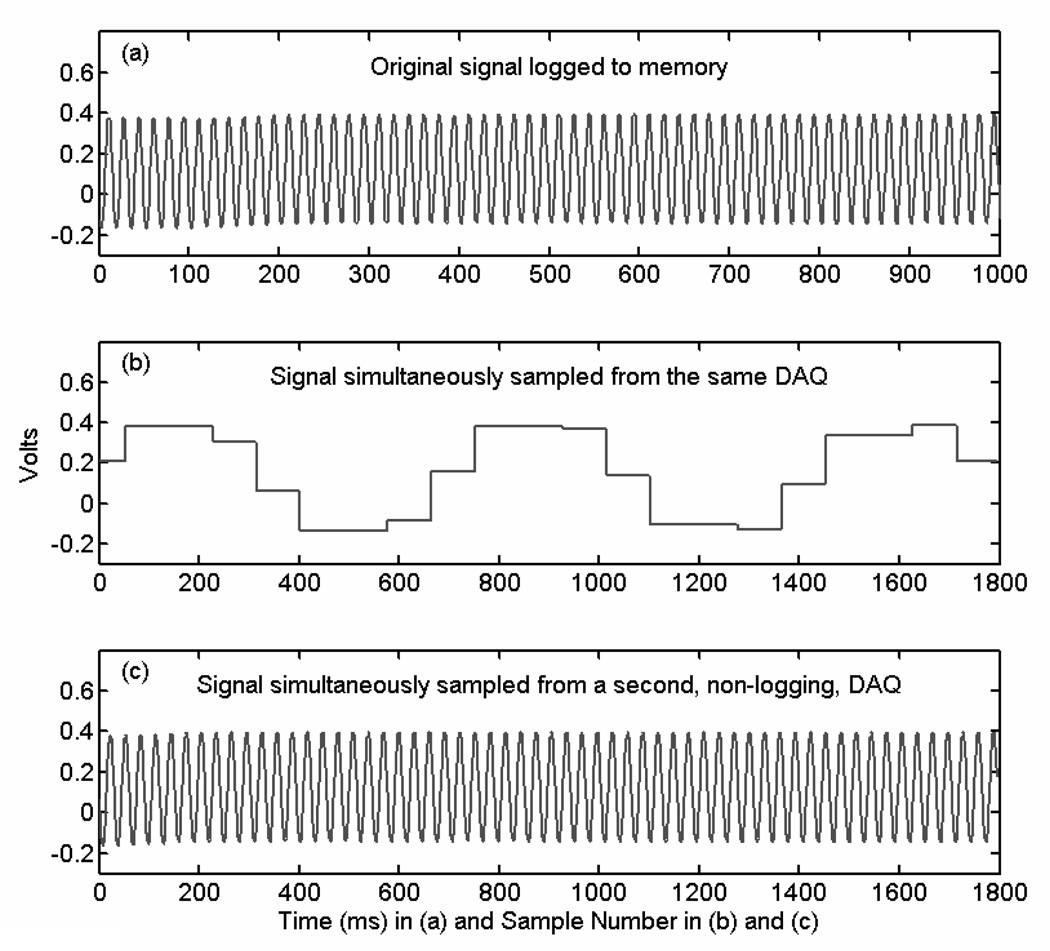
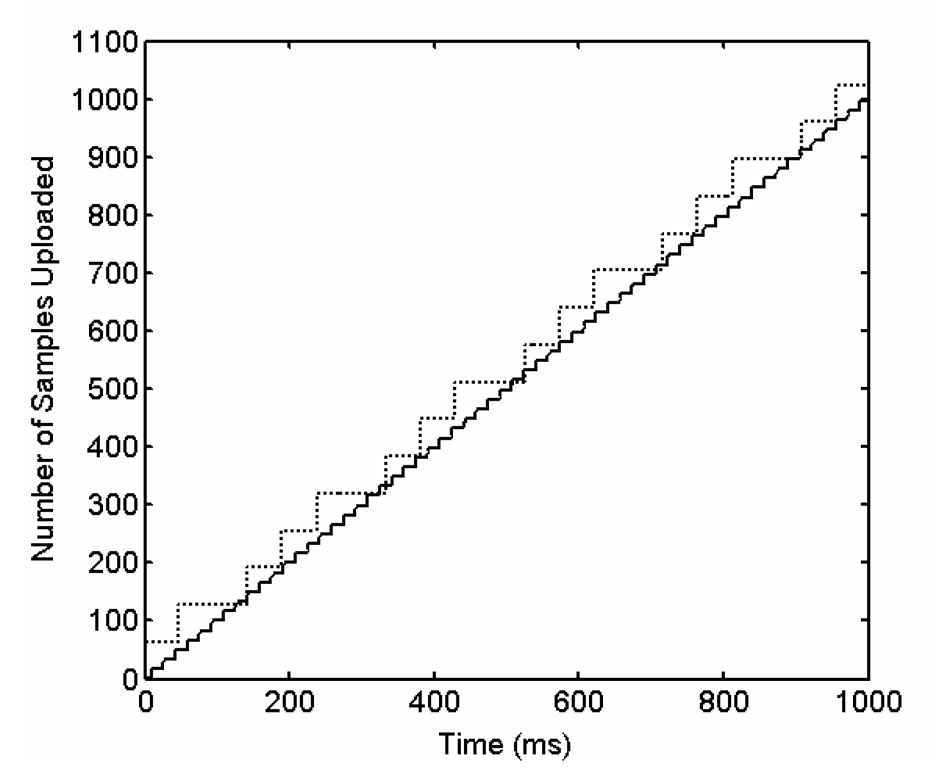
The second timing limitation results from the manner in which analog data is transferred from a data acquisition device (DAQ) to the PC. If the DAQ is set to acquire and store a continuous stream of data (e.g., eye- or joystick-position data), this data is stored initially in a buffer on the device itself and then uploaded to the PC in chunks at regular intervals. If one simultaneously attempts to sample this analog input stream for on-line behavioral control, only the last uploaded data point will be available. Therefore, if these uploads occur every 50 milliseconds (a value we found to be typical, using default settings in Matlab), the on-line sampled data will lag the actual signal by up to that amount of time. Nevertheless, in Matlab, data is returned to the user at a much faster rate (at least 1500 samples per second can be retrieved, and often many more, depending on the system configuration); however, the retrieved data values will simply be copies of the last transferred data point until the next upload (Figure 1). Thus, the raw number of samples retrieved is deceiving, and may have confounded previously published attempts to achieve high-level behavioral control with millisecond temporal resolution (Meyer and Constantinidis, 2005). We found that even if the buffer size is shrunk so that these transfers are forced to occur more frequently, there was a ceiling to the benefit provided by this tactic. Specifically, even after setting a buffer size that should allow only one data point, gaps between transfers of around 15 milliseconds were still common (Figure 1d), corresponding to a sampling rate of under 70 Hz (far less than is ideal for tracking eye movements or other analog behavioral data).
Figure 1. Analog Input Sampling and Aliasing.
A 60-Hertz sinusoid resulting from ambient noise was amplified and fed into the data acquisition system. (a) The original signal sampled at 1 kHz as logged to memory. (b) The same signal simultaneously sampled by Matlab as fast as software allowed (~1.8 kHz). (c) The same signal split and fed into a second data acquisition board, sampled while that board was left in a non-logging (“free-running”) state. These figures demonstrate that when an acquisition board is set to log data to memory or disk, that data becomes available to Matlab only after it has been uploaded in chunks to motherboard memory. Attempting to simultaneously sample this data, as in (b), results in the retrieval of the last uploaded data point, even that sample is tens of milliseconds old. This produces an aliased image of the signal which is not adequate for real-time behavioral control. Instead, data sampled from a second acquisition board, set not to log data, provides an accurate, immediate record of the signal. In this way, data can both be logged for post-hoc analysis and used for on-line behavioral control. (d) With the DAQ set to acquire data at 1 kHz, the number of samples uploaded to memory is plotted against time for two settings: the result using the default buffer size set by Matlab is depicted by the dotted line, and result using the minimum allowable buffer size is depicted by the solid line. Shrinking the DAQ’s buffer size provided a significant but limited benefit (gaps between uploads still occurred, lasting about 15 ms). Thus, the two-DAQ solution offered the best performance.
One way around this problem would be simply to avoid logging analog input data to memory. In this situation, one can sample data from many types of data acquisition devices even when they are in a “free-running” state (i.e., not set to log data to memory or disk), and the values returned will reflect the most recent state of the analog-to-digital converters. However, the inability to store acquired data for post-hoc analysis is severely limiting. In such a case, no continuous, regularly-sampled record of the behavioral signals will be available for post-hoc, off-line analysis; this is because the data points sampled on-line (i.e., under software control) will not be strictly clocked, but will instead occur at irregular, sub-millisecond intervals. Therefore, we devised a simple solution to this problem: we split the analog input signal into two identical data acquisition boards. One is set to log data to memory whereas the other is left in a free-running state for on-line sampling. With this configuration, we found that unique data samples could be retrieved at a rate well above 1 kHz (Figure 1c). In contrast, the rate of unique sample retrieval with only one acquisition board was limited to 20–70 Hz (Figure 1b).
Under our conditions, and qualitatively agreeing with a previous report (Meyer and Constantinidis, 2005), we found no temporal cost associated with sampling one vs. eight analog channels. Thus, with two data acquisition boards, it is possible to sample and simultaneously to store multiple behavioral signals with millisecond precision.
Importantly, we found that accessing data samples from USB DAQ devices took significantly longer than from PCI devices. Specifically, using two USB-6008 devices from National Instruments, the maximum number of unique samples retrievable per second was only 200 to 400 (compared with at least 1–2 kHz for PCI devices, above), despite the 10 kHz maximum sampling rate of these devices. So, although these devices tend to be several hundred dollars cheaper than the PCI devices, their slower performance may make them less suitable for real-time behavioral control.
As an aside, we found that for sending digital event markers to separate neural data acquisition systems, parallel ports were generally faster than the digital lines on the DAQ device. On our test system, this difference was large: The per-operation time was 0.4 ms for the parallel port versus 4 milliseconds for the DAQ digital subsystem. However, newer machines can achieve significantly better performance: ~0.1 ms for the parallel port versus ~0.2 ms for the DAQ (David Freedman, personal communication). Thus, because it takes two operations to send each number (one to set the value bits, another to trigger the strobe bit), it is preferable on older systems to use a parallel port for these operations.
Software Issues
Many behavioral researchers have significant concerns regarding the use of a high-level programming environment running on a non-real-time operating system (e.g., Matlab on Microsoft Windows) to control behavior with reliable millisecond temporal resolution. These concerns may be classified broadly into three categories: 1) concerns about the adequacy of the average cycle-rate performance of such a system (that is, its ability to perform the basic steps required for behavioral monitoring and control sufficiently rapidly to be able to repeat these steps about every millisecond); 2) concern that there is simply too much temporal jitter in a high-level application such as Matlab to provide accurate time-stamps; and 3) concerns about the possibility of rare, unpredictable highlatencies introduced by software events external to the experimental environment (e.g., the stealing of CPU time by background applications). These are serious issues that must be resolved in order to have confidence that behavior is being sampled with sufficient speed and without unexpected delays so that critical measures such as movement and reaction times – in which milliseconds matter – are not distorted.
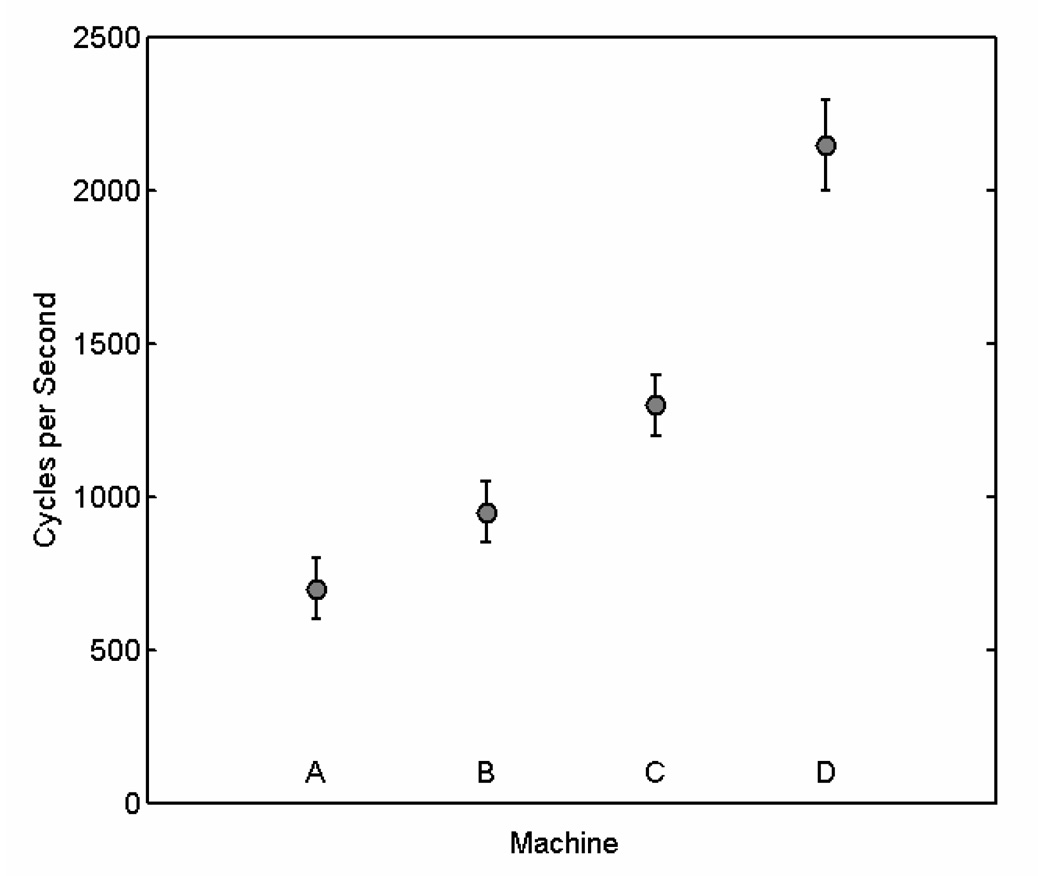
The first concern, regarding the average speed of execution within a high-level programming environment is easily allayed. Matlab running in an empty-loop (whose only function is to time-stamp each successive cycle) can execute several hundred thousand cycles per second on a modern PC running Windows (and over one million cycles per second have been measured on the newest machines). Even when code is added to check analog inputs, transform these into calibrated x-and-y coordinates, and check these coordinates against multiple possible targets, the average cycle rate still approaches or surpasses one kilohertz on modern, multi-core PCs (Figure 2). Thus, despite the use of a high-level, interpreted programming environment such as Matlab, more than adequate average performance can be achieved using standard computer hardware.
Figure 2. Cycle Rates Achieved on Different Machines.
The ranges of observed frequencies at which computers with different levels of processing power were able to execute the behavioral monitoring loop are shown. This loop involves signal sampling, signal calibration, and target-checking. Included here, also, are periodic updates to the control screen (to redraw the position of the eye-trace, visible only to the experimenter), occurring every 50 to 100 ms. A) Intel Pentium 4 running at 2.4 GHz with an 800 MHz FSB. B) Intel Core 2 Duo running at 1.86 GHz with an 800 MHz FSB. C) Intel Core 2 Duo running at 3.4 GHz with an 800 MHz FSB. D) Intel Core 2 Duo running at 3 GHz with a 1333 MHz FSB. Note that the bars around each point represent the approximate observed ranges, not standard deviations. The exact value that would be observed within this range depends on the particular task being run.
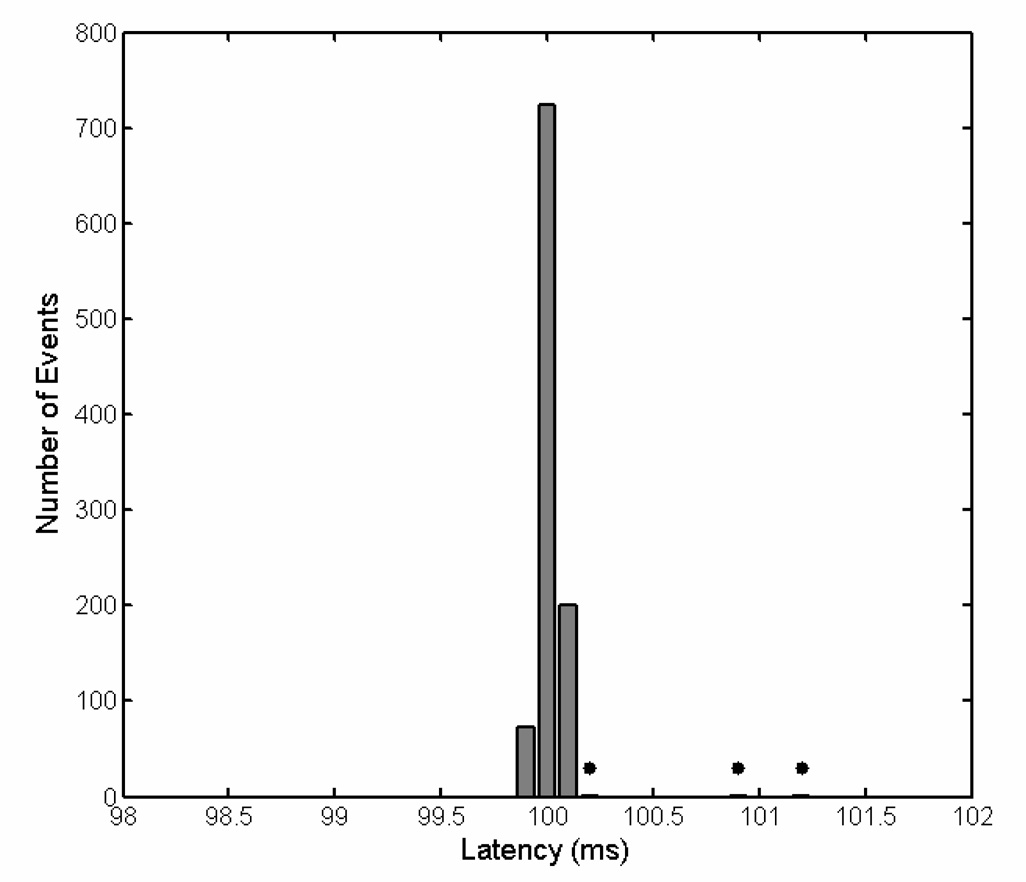
The second issue, concerning the degree of temporal jitter observed in time-stamps generated by a high-level application such as Matlab, also turns out not to be significant. Using a separate data acquisition system running at 40 kHz, we tested the jitter in the arrival times of 1000 event markers sent one-at-a-time every 100 milliseconds. We found that 99.7 percent of time-stamps arrived within 0.1 millisecond of their intended times (Figure 3). The largest error observed was only 1.2 milliseconds.
Figure 3. Event Timing.
The temporal jitter obtained by time-stamping 1000 events, each 100 ms apart. The three dots mark the three occurrences of jitter beyond 0.1 ms, the greatest of which was 1.2 ms late.
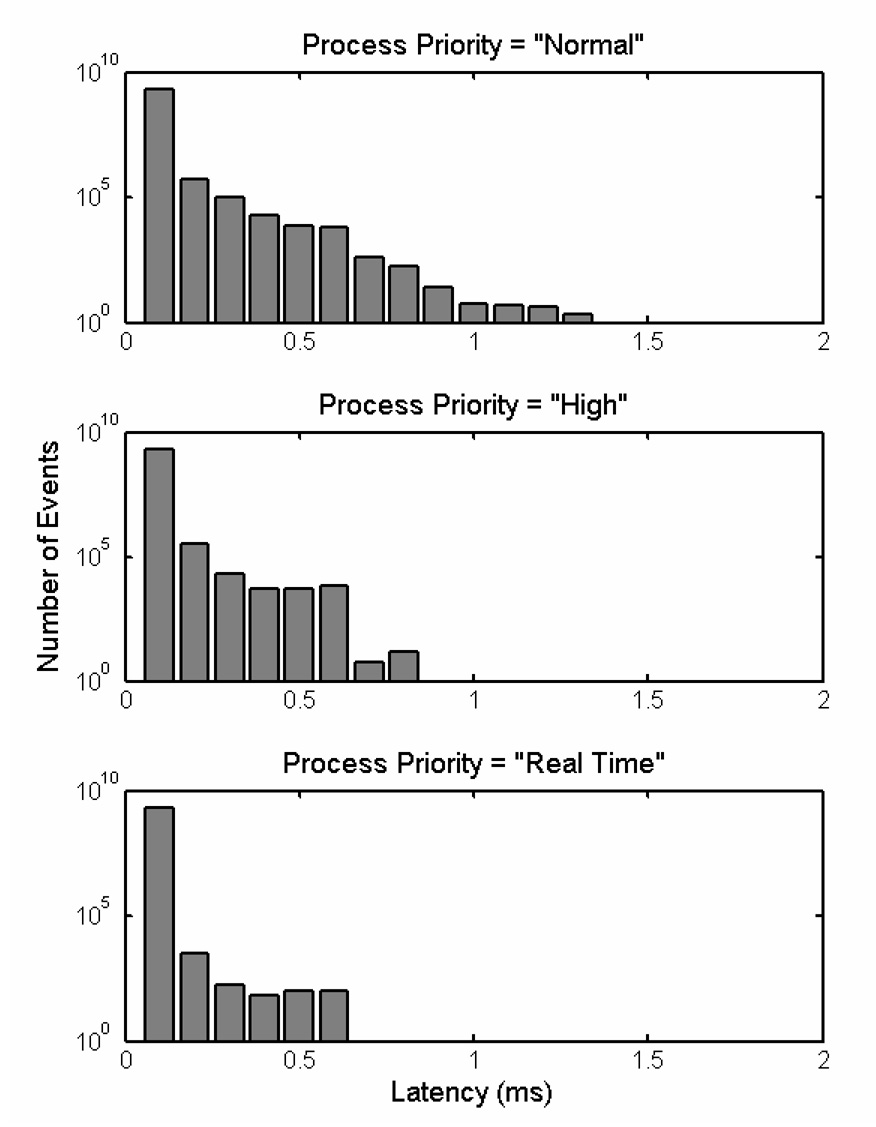
The third concern, regarding the possibility of rare, unpredictable delays resulting from non-experiment-related software events competing for CPU time, can also be shown to be inconsequential in practical application. Specifically, we allowed Matlab to run an empty loop continuously for one hour, time-stamping each cycle. We performed this test three times at each of three process priorities allowed by Windows: “Normal,” “High,” or “Real Time” (Figure 4). Setting the priority for matlab.exe as “High” or “Real Time” resulted in zero latencies above one millisecond. Even at the lowest priority setting tested, no latencies were measured to be above 1.3 ms over the entire hour this test was run. At the highest priority setting, the longest observed latency was only half of this value, 0.6 milliseconds. These longer latencies would occur relatively rarely: For example, at the highest priority setting, latencies greater than 0.2 ms would be encountered only once every 8.2 seconds, on average. In practice, we use software to increase the priority setting during the execution of a trial and decrease it during the intertrial-interval. This is to allow background processes to use CPU time preferentially during the inter-trial-interval, thereby hopefully lessening competing demands on processor time during the trials themselves (this is borne out by a slight increase in the number of cycles executed per second when a 2-second, low-priority “pause” is inserted between 10 second epochs running at the highest priority).
Figure 4. Process Priority and OS Delays.
Latencies encountered within Matlab at three different process priorities on our test system (see Methods for specifications), each tested over one continuous hour. Latency is plotted against the number of events on a logarithmic scale. Note that as the process priority was increased (the second and third graphs), the distribution of latencies shifted to the left. Concomitant with this decrease in latencies, the number of cycles completed increased from ~566,000 to ~574,000 to ~587,000 as the Matlab priority was increased from “Normal” to “High” to “Real Time.” In no case were there any latencies greater than 1.3 ms. At the highest priority setting, latencies greater than 0.2 ms would be encountered only once every 8.2 seconds, on average. Because of the large number of samples collected over the course of each hour (yielding too many data points to hold all at once in memory), the following procedure was used to generate these graphs: A time-stamp was retrieved at the beginning of each cycle of a loop. The preceding time-stamp was then subtracted from the current one and the difference was rounded to the nearest 0.1 ms. Then, the corresponding bin of a histogram vector encompassing all time differences up to 100 ms (in 0.1 ms steps) was incremented (1000 bins total). Importantly, any delays greater than 100 ms were put into the highest bin so as not to be missed. This vector could then be used to generate directly these bar graphs. These measured latencies, therefore, include these processing steps.
While these three concerns are the ones most commonly raised regarding software timing issues, there are at least a couple of other software-related timing matters that are must be appreciated: 1) a slightly slower speed is consistently measured for the first versus all subsequent trials; 2) there is a temporal cost of accessing the experimenter’s display to update the behavior trace (e.g., a moving dot corresponding to eye or joystick position).
First, an added temporal cost is associated with the initial execution of a software function in an environment such as Matlab. This cost comes as a result of the time it takes to load the function into memory, parse the commands in its script, and compile these commands into a machine-executable format. Subsequent executions of the same function can rely in some part on these pre-compiled sections of code. The practical result of these events is that the execution speed of events within the first trial is somewhat slower than in subsequent trials. The exact cost will vary greatly from task to task, depending on the type and number of sub-functions called. To minimize this effect, one can load the function into memory and initialize its sub-functions by running a “dummy” trial (executing a trial with null stimuli and subsequently discarding any behavioral signals acquired). For example, in a task in which we were able to initialize all top-level sub-functions, we found that the first trial was 3.6 +/− 2.5 (mean +/− standard deviation) percent slower than the subsequent ones, whereas the same task showed a 7.3 +/− 1.6 percent first-trial cost when those functions were not initialized (t-test comparing the means of the percent differences across the two cases: p < 0.01).
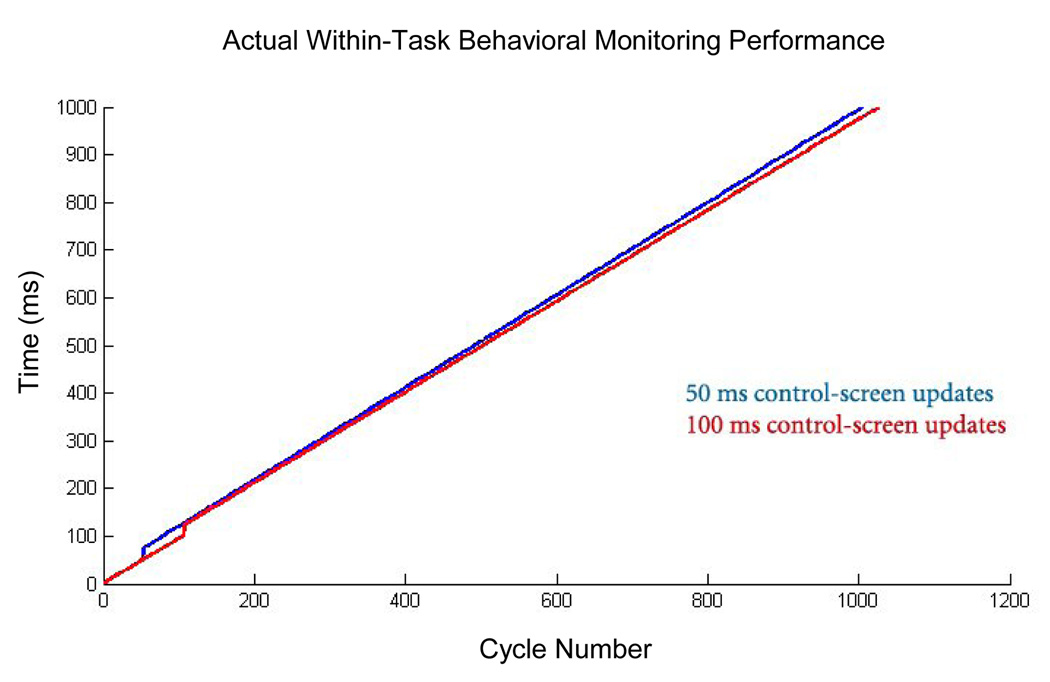
Second, because most users will want some sort of graphical feedback about the subject’s behavior in near-real-time, there could be a temporal cost associated with these video activities, even if this feedback takes the form of something as simple as a moving dot corresponding to instantaneous eye-or joystick position. To assess the cost of this added functionality, we tested the time required for periodic updates of the position of a dot in a Matlab figure window (updated by issuing a “drawnow” command every 50 or 100 milliseconds), reflecting a varying analog signal. We found that there is a fixed, one-time cost associated with accessing this window (Figure 5). Subsequent updates do not result in similar time gaps. While the time lost is relatively large (23 milliseconds, on our test machine), it occurred at a pre-determined latency: that of the first update. Therefore, to minimize the impact of this phenomenon, it is possible to perform the first graphical update upon the first cycle of the behavioral monitoring loop, and thereby be confident that subsequent updates are not interfering with the millisecond-by-millisecond sampling of behavior. Importantly, recognize that the “lost” time here results simply in the lack of behavioral data sampling during that interval, not in the slippage of temporal measurements or in erroneous time-stamps.
Figure 5. Actual Within-Task Behavioral Monitoring Performance.
Plotted here is cycle number versus time, in milliseconds, on our test system (see Methods for specifications). There is a linear relationship between these variables, demonstrating roughly equal time intervals between samples. The one exception to this linearity occurs at the time of the first call for a control-screen update (the issuing of a “drawnow” command at 50 ms for the blue line and 100 ms for the red line); at that time, a gap of approximately 23 milliseconds was measured, meaning the software was blind to changes in the behavioral signal during this time. Importantly, no further such gaps are seen afterward, despite continued calls for updating the control screen at regular 50 or 100 ms intervals. Note that the actual screen update is not expected to occur at these times because of the slower refresh rate (60 Hz) and potential delays within OpenGL (the graphics library used by Matlab). Unlike the subject’s display, the experimenter’s display is low-priority (all that is required is a subjective sense of smooth motion), so these delays were not considered problematic. In contrast to what is depicted here, within our software, this first update is called in the first cycle, thereby fixing the expected “blind” interval to the very beginning of the behavioral tracking period. Note also that there is a slight difference in slope between the 50 and 100 ms conditions, reflecting fewer cycles executed in the former case. This likely reflects added background cost when there is an increased frequency of control screen updates (here, this cost is only on the order of 2 to 3 percent).
Note that drawing to the experimenter’s display window was accomplished by calls to Matlab’s built-in graphics routines rather than through calls to the low-level graphics functions that controlled the subject’s display in full-screen mode. Thus, a screen update resulting from the “drawnow” command would appear at some later time, as allowed by OpenGL (the graphics library used by Matlab) and the screen refresh rate. This delay was acceptable because updating the experimenter’s (not subject’s) display had a relatively low-priority; all that was required was the subjective impression that the eyeor joystick-position trace was moving smoothly. The advantages of using Matlab’s high-level graphics functions included the ability to construct, very simply, an information-rich display to aide the experimenter’s interpretation of behavioral events in real-time, during task performance.
DISCUSSION
The potential timing limitations that must be overcome in order to monitor and control behavior in a temporally precise manner can be handled effectively with a few simple strategies. In these ways, one can achieve millisecond-level temporal precision and reliability for behavioral experiments even when working in a high-level programming environment such as Matlab running on a non-real-time operating system, using a relatively modest computer with off-the-shelf graphics capability and commonly available data acquisition hardware.
Because a millisecond is a relatively course unit of measure by electronic standards, temporal precision within this scale can be achieved on most occasions when the proper precautions are taken. Nevertheless, on a non-“hard”-real-time system, such as Matlab on Windows, no guarantees can be made about timing, even at the 1 ms scale, because the predictability of software events is limited by the design of the Windows operating system. Specifically, even those processes designated as having a “real-time” priority can be pre-empted by both kernel-level events and by interrupt requests, as well as by other processes with equally high-priority (Ramamritham et al., 1998). While using systems with multiple processors may provide some benefit, they do not alter the fundamental problem. Therefore, several steps can be taken to minimize these temporal intrusions. First, because they are a source of interrupt requests, unnecessary device drivers should be avoided (for example, by creating a hardware profile that excludes them). Importantly, this includes network-related devices. Second, applications other than Matlab should be closed (not simply minimized). Inspecting the list of running applications and processes in the Windows Task Manager for unneeded activities is one way to make certain the operating environment is streamlined. Lastly, because different behavioral tasks can potentially place heavy demands on different aspects of the operating system and hardware (e.g., varying graphics, disk and memory use), end-users should not take observed timing accuracy in one task as direct evidence of satisfactory accuracy in another; thorough testing must be performed to assess the performance of new behavioral paradigms and new hardware configurations.
The occurrence of temporal “slips” (unexpectedly increased latencies) often can be detected using time-stamps placed after critical behavioral events. These mark an event with reference to the deterministic system clock. A delay in the appearance of an expected time-stamp can then be used to reject trials in which timing constraints were not met. Of course, a delayed time-stamp could also represent a “false-alarm” when the delay occurred in the processing of that time-stamp itself and not in the preceding event. Fortunately, as we found above, such temporal slips can be made very infrequent, and are rarely longer than a millisecond.
Once appropriate care has been taken to ensure accuracy in the three domains that are most likely introduce temporal jitter and error (video output, data sampling, and software), the reliance on a high-level language for behavioral control offers numerous benefits aside from simply the ease of task coding and portability across a wider range of hardware platforms. In particular, the simplicity with which new features can be coded encourages the development of new functions that improve usability and record keeping. While in principle such benefits could be realized in a low-level language, in practice, the difficulty and time-consuming nature of programming in such a language hinders their development by those who would like to spend their time designing and carrying out experiments rather than tweaking software. We hope the ability to code at a higher level of abstraction will permit more careful attention to task design and execution, thereby increasing the quality and range of behavioral paradigms in-use.
Supplementary Material
ACKNOWLEDGEMENTS
The authors thank David Freedman, Andrew Mitz, Ming Cheng, Tim Buschman, John Gale, Earl Miller and Camillo Padoa-Schioppa for helpful discussions regarding the design and testing of our behavioral control software. We also thank Jeffrey Perry for making the low-level graphics drivers publicly available and for his advice regarding their implementation. Funding was provided by a Tosteson Fellowship from the Massachusetts Biomedical Research Council (WFA), NEI 1R01DA026297 (ENE), NSF IOB 0645886 (ENE) and the HHMI (ENE).
Footnotes
Publisher's Disclaimer: This is a PDF file of an unedited manuscript that has been accepted for publication. As a service to our customers we are providing this early version of the manuscript. The manuscript will undergo copyediting, typesetting, and review of the resulting proof before it is published in its final citable form. Please note that during the production process errors may be discovered which could affect the content, and all legal disclaimers that apply to the journal pertain.
Contributor Information
Wael F. Asaad, Department of Neurosurgery, Massachusetts General Hospital, Boston, MA, 02114, USA.
Emad N. Eskandar, Program in Neuroscience, Harvard Medical School, Boston, MA, 02115, USA
REFERENCES
- Ghose GM, Ohzawa I, Freeman RD. A flexible PC-based physiological monitor for animal experiments. J Neurosci Methods. 1995;62:7–13. doi: 10.1016/0165-0270(95)00048-8. [DOI] [PubMed] [Google Scholar]
- Hays AV, Richmond BJ, Optican LM. A UNIX-based multiple-process system for real-time data acquisition and control; WESCON Conference Proceedings; 1982. pp. 1–10. [Google Scholar]
- Maunsell JHR. LabLib. 2008 http://maunsell.med.harvard.edu/software.html.
- Meyer T, Constantinidis C. A software solution for the control of visual behavioral experimentation. J Neurosci Methods. 2005;142:27–34. doi: 10.1016/j.jneumeth.2004.07.009. [DOI] [PubMed] [Google Scholar]
- Ramamritham K, Shen C, Sen S, Shirgurkar S. Using Windows NT for Real-Time Applications: Experimental Observations and Recommendations; IEEE Real Time Technology and Applications Symposium; 1998. [Google Scholar]
- White TM, Norden-Krichmar TM, Benson J, Boulden E, Macknik S, Mitz A, Mazer J, Miller EK, Bertini G, Desimone R. COmputerized Real-Time Experiments (CORTEX) 1989–2008 http://www.cortex.salk.edu/
Associated Data
This section collects any data citations, data availability statements, or supplementary materials included in this article.


