

Abstract
In the absence of a vaccine for use in humans against West Nile virus (WNV), mosquito control and personal protection against mosquito bites are the only measures available to prevent disease. Improved spatial targeting is desirable for costly mosquito and WNV surveillance and control schemes. We used a multivariate regression modeling approach to develop spatial models predicting high risk of exposure to WNV in western and eastern Colorado based on associations between Geographic Information System–derived environmental data and zip code of residence for 3,659 human WNV disease cases from 2002 to 2006. Models were robust, with user accuracies for correct classification of high risk areas of 67–80%. The importance of selecting a suitable model development area in an ecologically and climatically diverse environment was shown by models based on data from the eastern plains landscape performing poorly in the mountainous western part of Colorado and vice versa.
INTRODUCTION
West Nile virus (WNV) disease, which is caused by an arthropod-borne virus in the family Flaviviridae, has emerged as a serious public health problem in the United States.1,2 After spreading west from the initial focus in New York, the virus reached Colorado in 20022 and caused an epidemic in 2003 with 2,947 human cases and 63 fatalities reported to the Colorado Department of Public Health and Environment.3 In the western United States, WNV is maintained in a natural transmission cycle primarily involving birds and Culex mosquitoes and is considered to most commonly be transmitted to humans by Cx. tarsalis.4-6 In the absence of a vaccine against WNV for use in humans,7-10 mosquito control and personal protection against mosquito bites are the only preventative measures available to reduce risk of WNV exposure.11-13 Effective implementation of mosquito and WNV control schemes requires knowledge of local spatial and temporal patterns of Culex mosquitoes and WNV. Spatial factors influencing risk of WNV exposure in humans include location of larval habitats, microclimate, and local abundance of hosts for female mosquitoes, especially birds serving as WNV reservoirs.2,6,14 Temporal factors affecting Culex vector abundance include the extent of annual flooding caused by snow-melt runoff and seasonal rainfall and temperature patterns.15-20 High local abundances of Culex vectors enhance the enzootic transmission potential of WNV and may lead to intense viral transmission within the enzootic bird–mosquito cycle followed by incidental infections of humans and domestic animals.2,12
Although it is well understood that spatially targeted and timely implementation of mosquito control measures is critical to reduce mosquito abundance and risk of WNV transmission, deciding where and when to implement costly vector control measures is not a trivial matter. Detection of human WNV disease cases does not provide sufficient lead time for effective mosquito control because the peak in abundance of Cx. tarsalis in Colorado precedes the peak in human cases by several weeks to a month.21,22 Human WNV cases typically peak in late July and August, coinciding with a rapid decline of populations of host-seeking Cx. tarsalis females. Emergency mosquito control initiated in response to peaks in human WNV cases is therefore of limited use. Surveillance for WNV seropositive birds, which typically is achieved through monitoring of sentinel chicken flocks or by testing of dead birds,23-28 or WNV-infected mosquitoes, likewise may fail to provide sufficient lead time to implement effective mosquito control. To be most effective, mosquito control measures need to be implemented proactively based on factors discernible before the risk of a WNV outbreak can be determined unequivocally (e.g., weather patterns, Culex mosquito abundance). This is a conundrum facing local decision-makers across the United States charged with making decisions regarding resource allocation for mosquito control activities.
Knowledge of historical spatial and temporal patterns of abundance of Culex vectors and human WNV disease cases provide crucial information to facilitate implementation of proactive and evidence-based mosquito surveillance and control schemes.16,29-35 For large parts of Colorado, risk patterns can only be discerned from epidemiologic data because mosquito control programs, and consequently entomologic data, are lacking. To improve the knowledge of spatial risk of WNV exposure in Colorado, we used data for human WNV disease cases from 2002 to 2006 to first determine fine-scale WNV disease incidence and thereafter identify associations between environmental factors and high WNV disease incidence through multivariate regression modeling. A secondary aim was to determine whether models based on data from the plains landscape of eastern Colorado were applicable to the mountainous western part of the state and vice versa.
MATERIALS AND METHODS
Study area
The topographically diverse state of Colorado encompasses short-grass prairie in the eastern plains, high mountains of the Continental Divide running north to south in the central part of the state, and canyons and high plateaus to the west. The high elevation and mid-latitude interior continent location of Colorado results in a cool, dry climate with considerable daily and seasonal temperature fluctuations.36 Precipitation in the eastern Colorado plains is seasonal, with 70–80% of the annual total precipitation occurring from April through September. Along the foothills at the eastern edge of the Rocky Mountains (the Colorado Front Range), daily and seasonal temperature fluctuations are less severe, and precipitation increases as one moves from the foothills into montane areas. Eastern Colorado is primarily rural agricultural land to the east with increasing focal human populations to the west along the Front Range (e.g., Colorado Springs, Denver, Boulder-Longmont, Loveland-Fort Collins). Two major rivers flow through eastern Colorado: the South Platte River to the northeast and the Arkansas River to the southeast. Western Colorado topography includes canyons and plateaus with winter weather colder, but less variable, than eastern Colorado. The valleys of west-central and southwestern Colorado have a relatively mild climate, and precipitation exhibits less seasonality compared with eastern Colorado. The Colorado River flows through west central Colorado.
Epidemiologic data
The study included 3,659 WNV disease cases reported to the Colorado Department of Public Health and Environment (CDPHE) during 2002–2006 by five-digit zone improvement plan (zip) code (zip code identifies the individual post office or metropolitan area delivery station associated with a postal address; www.usps.com/help/glossaries.htm). All included disease cases were from zip codes reporting a mean cooling degree day (CDD) value that exceeded a cut-off of 20.7 during the month of July (1961–1990, data from Climate Source, Corvallis, OR). This CDD cut-off was chosen because entomologic data collected along elevation-climate gradients in Larimer County in north-central Colorado in 2006 showed that risk of exposure to Culex WNV vectors was minimal in areas with a CDD value < 20.7 (L. Eisen, unpublished data). Based on this CDD cutoff, the high mountain portion of central Colorado was excluded from the study as an area with minimal risk of exposure to Culex WNV vectors (Figure 1). Few WNV disease cases (N = 42; 1.1% of the total for the state) were reported from zip codes in the excluded area during 2002–2006, and we consider it probable that the vast majority of these cases resulted from out-of-zip code exposures to infected Culex mosquitoes at lower elevations. Data from 301 zip codes to the east and 59 zip codes to the west of the high mountains were used to calculate zip code-based cumulative WNV disease incidences per 100,000 person-years during 2002–2006. Incidences were not age-adjusted because disease cases included not only severe neuroinvasive manifestations, which are more likely to occur in older relative to younger persons,37 but also uncomplicated West Nile fever. Uncomplicated fevers typically account for 75–85% of annual WNV disease cases in Colorado (http://www.cdphe.state.co.us/dc/Zoonosis/wnv/index.html).
Figure 1.
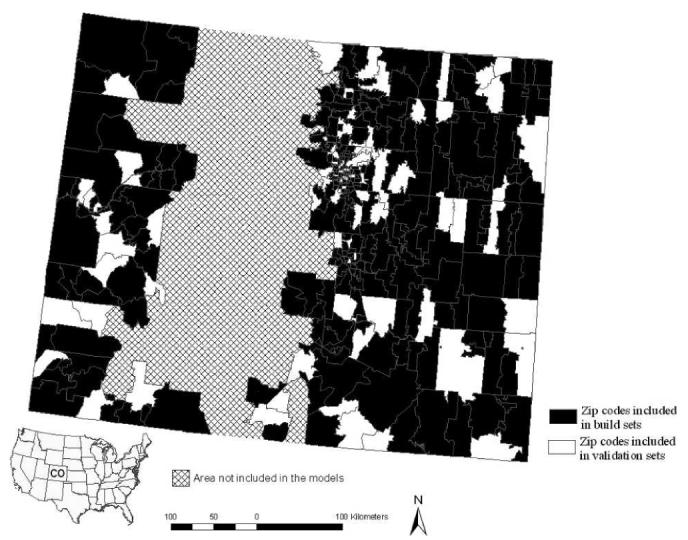
Distribution of zip codes in western and eastern Colorado used to build and validate models for high incidence of WNV disease. The central part of the state, which is dominated by high mountains where Culex vectors for WNV are rare or lacking, was excluded from the models.
Cumulative cases were aggregated to zip code rather than census tract because the variability of census tract area (< 1–8,947 km2) was more pronounced than zip code area (< 1–5,131 km2), especially in high-density urban and sparsely populated rural regions of the state. Quality of data from Colorado for probable sites of exposure (point locations) for the relatively mild and common WNV disease is highly variable (reflecting differences in information gathering practice and interest of individual physicians) and precludes reliable use of point locations as the basis for determining environmental correlates of WNV disease risk. We do, however, consider it a valid working assumption that most exposures occurred within the zip code of residence because human habitation in the semi-arid Colorado landscape tends to cluster in the vicinity of mosquito larval habitat (rivers, lakes, ponds, irrigated lands). Major recreational areas in western Colorado and the Front Range area cluster in montane habitats where Culex vectors are rare or lacking,14 and thus, WNV exposure is unlikely to commonly be associated with out-ofzip code recreational activities.
Environmental data
Geographic Information System (GIS)-based data included the following: (1) administrative boundaries including state, county, and zip code (Environmental Systems Research Institute [ESRI], Redland, CA); (2) long-term (1961–1990) climate data (mean monthly and annual temperature, cooling degree, heating degree and growing degree days; mean monthly and annual precipitation, snowfall, and relative humidity; mean annual length of freeze-free period; Julian date of first and last snowfall; at 2 × 2-km spatial resolution (Climate Source LLC); (3) US Geological Survey 30-m national elevation data set; (4) land cover classification based on the 30-m 2001 National Land Cover Dataset (NLCD); and (5) annual average normalized difference vegetation index (NDVI) data from 2005 (1 × 1-km spatial resolution; derived from NOAA Advanced Very High Resolution Radiometer images).
GIS-based data were extracted by zip code using ArcGIS 9.2 (ESRI). All layers were projected to North American Albers Equal Area Conic projection and North American 1983 datum.
Model construction
Multivariate logistic regression models, based on the above-mentioned environmental data, were developed to predict spatial patterns of zip codes with high incidence of WNV disease. Separate models were developed for eastern versus western Colorado because of the climatic and topographic variability between the two regions, which may result in different environmental determinants for WNV disease incidence. Logistic regression modeling was used because WNV disease incidence data were not normally distributed, and extensive applications of normalizing transformations could not make them so (Shapiro-Wilk test; P < 0.05 for both eastern and western Colorado). Furthermore, the modeling focused on high versus lower WNV disease incidence because the majority of WNV exposures tends to go undetected (asymptomatic infections or mild, short-lived manifestations37). This results in a scenario where we reasonably can expect that high risk (high incidence) areas are detectable through cases reported to the Colorado Department of Public Health and Environment but where observed variability within the range of lower incidences is less reliable. Modeling within the range of lower incidences for WNV disease in Colorado therefore will require prospective studies including data for exposure to WNV rather than only data for reported WNV disease cases.
High WNV disease incidence was classified using the fourth quartile cut-off value for zip code–based incidence in eastern Colorado (≥ 38.39 cases per 100,000 person-years) or western Colorado (≥ 25.75 cases per 100,000 person-years). Because the range of disease incidence by zip code was greater in eastern Colorado (0–754.72 cases per 100,000 person-years) versus western Colorado (0–512.82 cases per 100,000 person-years), separate cut-off values for high WNV disease incidence were used to ensure that model development would be representative of the specific region. We initially considered also developing models for presence-absence of WNV disease but ultimately decided against this because the observed pattern of presence-absence in eastern Colorado, where the climate is uniformly suitable for Culex vectors and all zip codes contain at least some larval habitat, most likely results from asymptomatic exposures being common and mild WNV disease cases often going unrecognized.
Model development for eastern or western Colorado was based on random selection of 75% of the zip codes for each region, with the remaining 25% of zip codes reserved for model validation (Figure 1). Forward stepwise regression was used to identify three or more candidate models for high incidence of WNV disease (eastern and western Colorado). Covariates included in the models (probability to enter of 0.25) were restricted to variables significantly associated with WNV disease incidence in univariate tests of association (Wilcoxon's test; P < 0.05) but not strongly correlated with each other (Spearman rank correlation; ρs < 0.8). A goodness of fit test was applied to determine whether the model covariates adequately explained the distribution of WNV disease incidence. Receiver operating curves (ROCs) assessed the overall discrimination of the model based on the area under the curve (AUC). The AUC provides a threshold-independent measure of the overall accuracy of the model and was also used to determine the optimal probability cut-off that characterized each grid cell as high versus lower WNV disease incidence. Models with the lowest Akaike information criterion (AIC) were considered the most parsimonious models, but models within two AIC units of the minimum AIC value were considered competing.38 The best models had the lowest or competing AIC values and provided the most robust validations.
The models are described with the following equation:
| (1) |
where P is the probability of a grid cell being classified as having high WNV disease incidence, β0 is the intercept, and β1 … βk represent the coefficients associated with each independent variable x1 … xk.
A Moran I was calculated using ArcGIS 9.2 to ensure that the residuals of the selected final models for eastern and western Colorado were not spatially autocorrelated. To create GIS data layers predicting high incidence of WNV disease, the following equation (derived from equation 1) was used to express the probability that a particular cell is classified as high incidence of WNV disease:
| (2) |
Data layers predictive of high incidence of WNV disease were first constructed by applying the eastern and western models at the zip code scale. More fine-scale predictive data layers (2 × 2-km pixel size) were generated by applying specific model equations to the raster data using the raster calculator of ArcGIS 9.2. For each zip code, the maximum probability value (P) for having high WNV disease incidence among raster cells was extracted using zonal statistics (ArcGIS Spatial Analyst; ESRI). Sensitivity and specificity were maximized simultaneously by optimizing the probability cut-off value. Cells with a probability greater than the cut-off value were classified as “high incidence” for WNV disease. All other cells were considered “lower incidence.” We also evaluated the predictive capability of the eastern Colorado model for western Colorado and the western model for eastern Colorado to study the potential for applying regional models statewide. This included extrapolation of the model developed for eastern Colorado to western Colorado and evaluation against cumulative WNV disease incidence data from western Colorado. The same procedure was repeated for the other half of the state. Statistical analyses were carried out using the JMP statistical package,39 and results were considered significant when P < 0.05.
RESULTS
Summary of WNV disease data
Mean cumulative incidence (2002–2006) of WNV disease by zip code for the eastern and western parts of Colorado was similar with 29.6 cases per 100,000 person-years in the east (range, 0–754) and 29.1 cases per 100,000 person-years in the west (range, 0–513). Larimer, Boulder, and Weld counties in the Front Range area reported the highest case numbers across the state (totals of 618, 513, and 489 cases for 2002–2006, respectively). On the other hand, the highest cumulative incidences of WNV disease occurred in the eastern part of the state, with the northeastern counties of Logan, Sedgwick, and Phillips reporting 100, 154, and 122 cases per 100,000 person-years, respectively, during 2002–2006, compared with 35–44 cases per 100,000 person-years for Boulder, Larimer, and Weld. Mesa and Delta counties (located in western Colorado) and Fremont County (located in central Colorado) reported relatively high incidence rates (33–49 cases per 100,000 person-years).
Predictive spatial models for high risk of exposure to WNV
Multivariate logistic regression models based on GIS-derived environmental data were developed to predict areas where WNV disease incidence was high in western and eastern Colorado (Table 1). Lack of fit tests indicated that models included sufficient numbers of covariates (P > 0.05 in all cases), and whole model tests denoted good overall fit for all models (P < 0.05 for western Colorado models and P < 0.001 for eastern Colorado models; Table 1). Parameter estimates for covariates of selected models are shown in Table 2. The residuals of the final selected models were not spatially autocorrelated for either eastern or western Colorado (Moran I = 0.01, Z[I] = 1.53 and Moran I = −0.01, Z[I] = 0.61, respectively).
Table 1.
Multivariate logistic regression models for high WNV disease incidence in western and eastern Colorado
|
Area |
Model no. |
k |
Negative log-likelihood |
AIC values |
Whole model P value |
Goodness of fit P value |
AUC |
Independent model covariates |
|
|---|---|---|---|---|---|---|---|---|---|
| AIC | ΔAIC | ||||||||
| Western Colorado | 1* | 2 | 21.07 | 43.15 | 0 | 0.007 | 0.47 | 0.763 | Temp in March |
| 2 | 3 | 20.96 | 47.93 | 1.78 | 0.023 | 0.43 | 0.748 | Temp in March, Annual RH | |
| 3 | 3 | 20.74 | 47.48 | 1.33 | 0.018 | 0.45 | 0.791 | Temp in March, NDVI in June | |
| 4 | 4 | 20.65 | 49.30 | 3.15 | 0.037 | 0.43 | 0.777 | Temp in March, Annual RH, NDVI in June | |
| Eastern Colorado | 1 | 2 | 101.34 | 206.68 | 25.96 | < 0.001 | 0.74 | 0.819 | Elev |
| 2 | 3 | 96.46 | 198.91 | 18.19 | < 0.001 | 0.93 | 0.831 | Elev, Precip in July | |
| 3 | 4 | 91.16 | 190.33 | 9.61 | < 0.001 | 0.98 | 0.853 | Elev, Precip in July, HDD in August | |
| 4 | 5 | 85.82 | 181.64 | 0.93 | < 0.001 | 0.99 | 0.866 | Elev, Precip in July, HDD in August, Snow in September | |
| 5* | 6 | 84.36 | 180.72 | 0 | < 0.001 | 0.99 | 0.873 | Elev, Precip in July, HDD in August, Snow in September, NDVI in May | |
Selected models.
K = the number of estimated parameters included in the model; AIC = Akaike information criterion: ΔAIC = AIC for model – AIC for most parsimonious model; AUC = area under the receiver operator curve; Elev = elevation; HDD = heating degree days; Precip = precipitation; RH = relative humidity; Snow = snowfall; Temp = temperature.
Table 2.
Parameter estimates for selected multivariate logistic regression models predicting areas with high incidence of WNV disease in western and eastern Colorado
| Parameter estimate |
Likelihood ratio test |
||||
|---|---|---|---|---|---|
| Area and model covariates | Estimate | SE | χ2 | df | P |
| Western Colorado | |||||
| Intercept | −2.86 | 0.92 | 9.55 | 1 | 0.00 |
| Temperature in March (°C) | 0.05 | 0.02 | 5.63 | 1 | 0.01 |
| Eastern Colorado | |||||
| Intercept | 3.65 | 6.32 | 0.033 | 1 | 0.56 |
| Elevation (m) | −0.01 | 0.01 | 10.10 | 1 | 0.00 |
| Precipitation in July (mm) | −0.06 | 0.02 | 8.74 | 1 | 0.00 |
| Heating degree days in August (HDD) | 0.03 | 0.06 | 3.12 | 1 | 0.08 |
| Snowfall in September (mm) | −0.07 | 0.02 | 8.28 | 1 | 0.00 |
| NDVI in May | 0.05 | 0.03 | 2.79 | 1 | 0.10 |
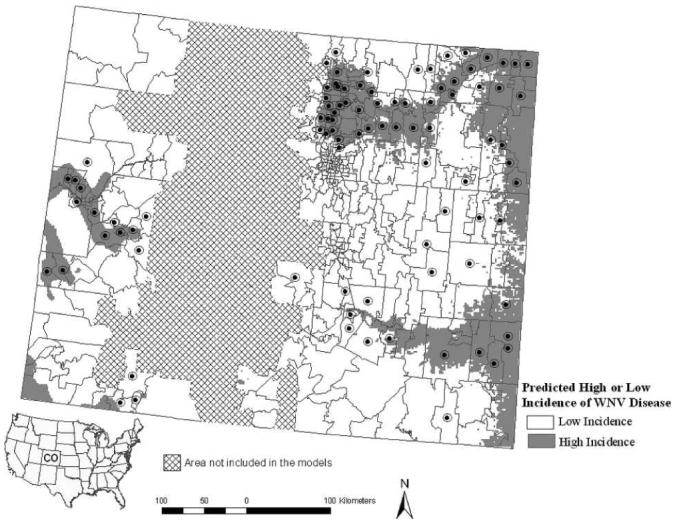
Models for high incidence of WNV disease in eastern and western Colorado based on zip code and 2 × 2-km raster scales are shown in Figures 2 and 3. Eastern Colorado had a higher percentage of area with predicted high incidence of WNV disease (27%) compared with the western part of the state (12%; Figures 2 and 3). The models predicted high incidence of WNV disease along river basins including the Platte, Arkansas, and Colorado rivers and in the northern Colorado Front Range (Figures 2-3).
Figure 2.

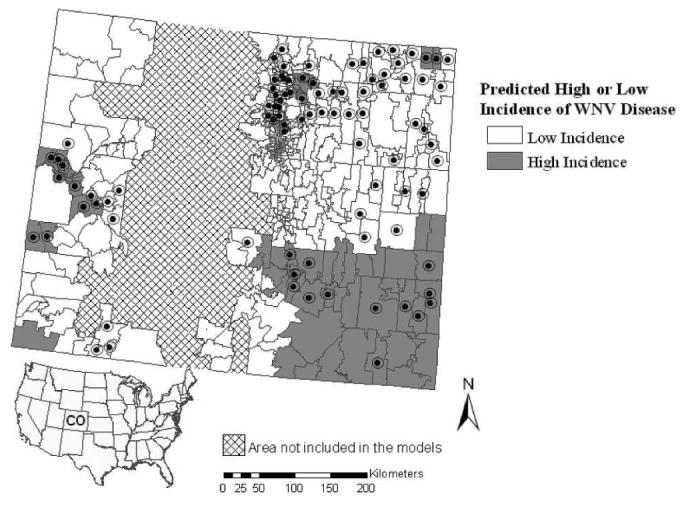
Predicted presence of high incidence of WNV disease in western Colorado (> 25.75 cases per 100,000 person-years) and eastern Colorado (> 38.39 cases per 100,000 person-years) from 2002 to 2006 for the zip code scale-based model. The high incidence cut-offs were chosen based on the fourth quartile cut-off value for zip code–based incidence in either region. Zip codes reporting high incidences of WNV disease during 2002–2006 are indicated by black circles.
Figure 3.
Predicted presence of high incidence of WNV disease in western Colorado (> 25.75 cases per 100,000 person-years) and eastern Colorado (> 38.39 cases per 100,000 person-years) during 2002–2006 for the fine-scale (2 × 2 km) model. The high incidence cut-offs were chosen based on the fourth quartile cut-off value for zip code–based incidence in either region. Zip codes reporting high incidences of WNV disease during 2002–2006 are indicated by black circles.
Evaluation of models
Models were validated internally (against the zip code data set used to construct the models) as well as externally (against the zip code data set not included in model development). Validations were conducted at zip code scale and also at a finer 2 × 2-km scale. Only the external validation results are reported in the text, but data for both internal and external validation results are shown in Tables 3 and 4. User and producer accuracies were calculated for evaluation of the models. User accuracy (errors of commission) calculates the probability that the modeled data represents reality and provides a measurement of how well the models represent disease risk. Producer accuracy (errors of omission) is a measure of the accuracy of the particular modeling scheme and measures what percentage of the area was modeled correctly.40
Table 3.
Zip code scale-based validation of models for high incidence of WNV disease for western and eastern Colorado based on the internal build data set and external validation data sets
| Actual classification for high WNV disease incidence |
||||||
|---|---|---|---|---|---|---|
| Predicted high incidence of WNV disease* |
Yes | No | Percent correct† |
Yes | No | Percent correct† |
| Internal validation | Western Colorado | Eastern Colorado | ||||
| Yes | 5 | 6 | 45% | 33 | 24 | 58% |
| No | 6 | 27 | 82% | 24 | 145 | 86% |
| Percent correct‡ | 45% | 82% | 58% | 86% | ||
| External validation | ||||||
| Yes | 4 | 1 | 80% | 10 | 5 | 67% |
| No | 2 | 8 | 80% | 7 | 53 | 88% |
| Percent correct‡ | 67% | 89% | 59% | 91% | ||
Zip code refers to the system of five-digit codes that identifies the individual post office or metropolitan area delivery station associated with a postal address.
Probability cut-off value of P ≥ 0.42 for western and eastern Colorado.
User accuracy (commission error).
Producer accuracy (omission error).
Table 4.
Fine-scale (2 × 2 km) validation of models for high incidence of WNV disease for western and eastern Colorado based on the internal build data set and external validation data sets
| Actual classification for high WNV disease incidence |
||||||
|---|---|---|---|---|---|---|
| Predicted high incidence of WNV disease* |
Yes | No | Percent correct† |
Yes | No | Percent correct† |
| Internal validation | Western Colorado | Eastern Colorado | ||||
| Yes | 5 | 6 | 45% | 38 | 19 | 67% |
| No | 6 | 27 | 82% | 19 | 83 | 81% |
| Percent correct‡ | 45% | 82% | 67% | 81% | ||
| External validation | ||||||
| Yes | 4 | 1 | 80% | 10 | 6 | 63% |
| No | 2 | 8 | 80% | 7 | 24 | 77% |
| Percent correct‡ | 67% | 89% | 59% | 80% | ||
Probability cut-off value of P ≥ 0.42 for western and eastern Colorado.
User accuracy (commission error).
Producer accuracy (omission error).
External zip code scale validation
Producer accuracies for categorizing areas with high WNV disease incidence as likely to have high incidence or areas with lower incidence as likely to have lower incidence ranged from 59% to 91% for the western and eastern Colorado models (Table 3). User accuracy for high WNV disease incidence in zip codes predicted by the model to have high incidence was 80% in western Colorado and 67% in eastern Colorado (Table 3). Regarding the spatial distribution of errors of omission, the high incidence model underpredicted disease risk along a portion of the Arkansas River in the south-central region of the state (Figure 2).
External fine 2 × 2-km scale validation
The 2 × 2-km scale models for high incidence of WNV disease in eastern and western Colorado had producer accuracies ranging from 59% to 89% (Table 4). User accuracies were 80% for the western model and 63% for the eastern model (Table 4). Similar to the zip code–based high incidence model for eastern Colorado, the 2 × 2-km scale high incidence model underestimated disease risk along a portion of the Arkansas River at the western edge of the eastern plains. This fine-scale high incidence model did, however, show small patches of risk within zip codes reporting high incidence of WNV disease in this area (Figure 3). To study how these small patches of predicted high incidence of WNV disease coincided with population density, the population per square kilometer was mapped by census tract and compared with the high incidence model (Figure 4). This showed that the small patches of model-predicted high incidence of WNV disease occurring along the aforementioned portion of the Arkansas River commonly coincided with population centers (e.g., Pueblo).
Figure 4.
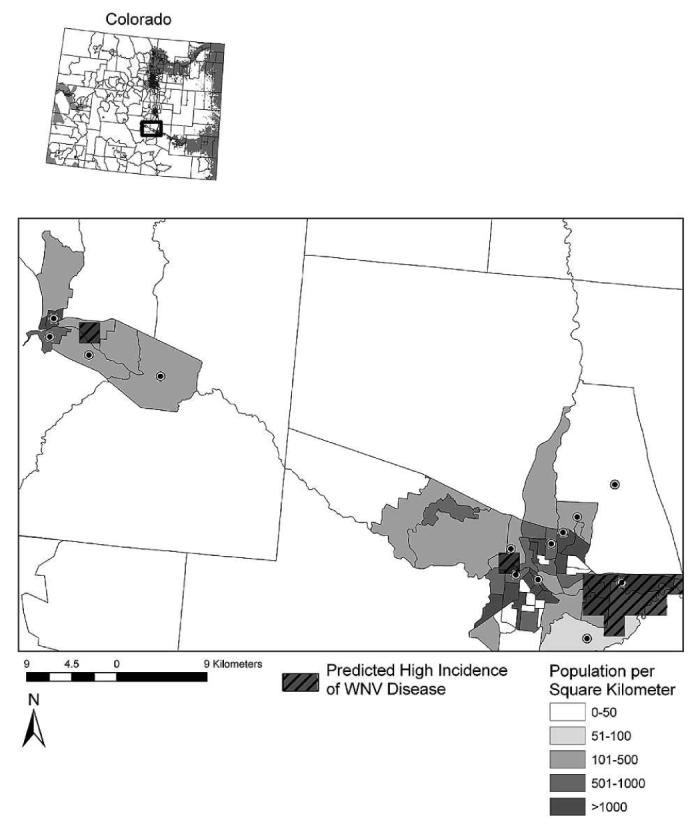
Along the portion of the Arkansas River where the 2 × 2-km scale model underestimated WNV disease risk (see inset map), we found that small patches of model-predicted high incidence of WNV disease commonly coincided with population centers (e.g., Pueblo). Population density per square kilometer is displayed at the census tract level, and census tracts with high WNV disease incidence during 2002–2006 are indicated by black circles.
Applicability of the western model to eastern Colorado and the eastern model to western Colorado
We also studied whether zip code–based models developed for eastern or western Colorado provide accurate predictions of high incidence of WNV disease in the other part of the state. Model predictions were validated at the zip code scale against high incidence of WNV disease for all zip codes in the validation area (i.e., 301 eastern zip codes or 59 western zip codes). When applied to western Colorado, the selected model for high WNV disease incidence in eastern Colorado yielded identical user and producer accuracies for correct classification of high-risk zip codes of 41% (Table 5). This model fit the actual spatial pattern for areas with high WNV disease incidence in the west-central region along the Colorado River basin but overpredicted high WNV disease incidence to the northwest (Figure 5).
Table 5.
Validation of zip code scale models for high incidence of WNV disease developed for eastern or western Colorado when applied to the other part of the state
| Actual classification for high WNV disease incidence |
||||||
|---|---|---|---|---|---|---|
| Predicted high incidence of WNV disease* |
Eastern models applied to western Colorado |
Western models applied to eastern Colorado |
||||
| Yes | No | Percent correct† |
Yes | No | Percent correct† |
|
| Yes | 7 | 10 | 41% | 19 | 55 | 26% |
| No | 10 | 32 | 76% | 55 | 172 | 76% |
| Percent correct‡ | 41% | 76% | 26% | 76% | ||
Zip code refers to the system of five-digit codes that identifies the individual post office or metropolitan area delivery station associated with a postal address. Models developed in eastern Colorado were validated against all 59 western zip codes and models developed in western Colorado against all 301 eastern zip codes.
Probability cut-off value of P ≥ 0.46 for western Colorado and P ≥ 0.34 for eastern Colorado.
User accuracy (commission error).
Producer accuracy (omission error).
Figure 5.
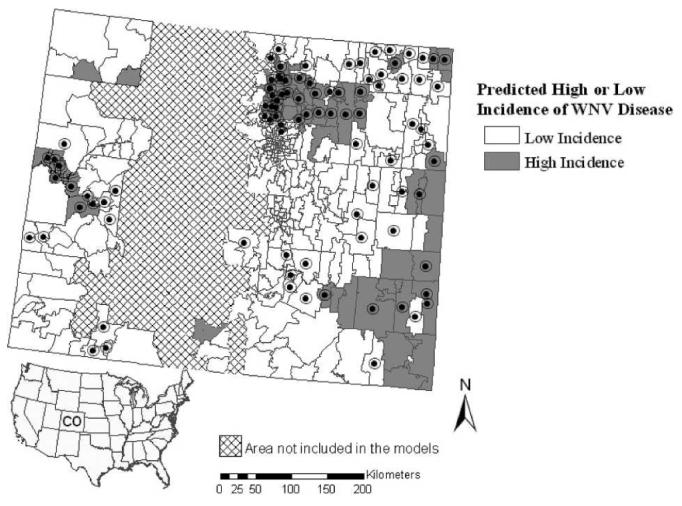
Outcome for the eastern zip code–based model for prediction of high incidence of WNV disease when applied statewide. Zip codes with high WNV disease incidence during 2002–2006 are indicated by black circles.
When applied to eastern Colorado, the selected western model for high WNV disease incidence gave identical user and producer accuracies for correct classification of high-risk zip codes of 26% (Table 5). The western model predicted only the southeastern corner of the eastern part of Colorado to include areas with high WNV disease incidence, thus overlooking a large number of zip codes with actual high WNV disease incidence to the northeast (Figure 6).
Figure 6.
Outcome for the western zip code–based model prediction of high incidence of West Nile virus disease when applied statewide. Zip codes with high WNV disease incidence during 2002–2006 are indicated by black circles.
Overall, the zip code–based models performed better when applied to the model development area (Table 3) than the other part of the state (Table 5). User accuracies for categorizing areas with high incidence as likely to have high incidence were 63–80% within the respective model development areas but 26–41% when the models were applied to the other part of the state.
DISCUSSION
WNV is the leading cause of arboviral disease in the United States, with > 15,000 human cases and > 600 fatalities since 1999.41,42 Despite the fact that Colorado has emerged as a major focal point of WNV disease, with 3,703 human cases and 76 fatalities reported from 2002 to 2006, mosquito control is still inconsistent or lacking in large parts of the state, including areas severely afflicted by WNV disease in the eastern plains region. Because entomologic data for Culex vector abundance is scarce from areas in Colorado lacking mosquito control programs, we developed models based on associations between environmental and epidemiologic data to assess statewide spatial risk of WNV exposure at multiple scales. The resulting models identify specific environmental factors associated with high incidence of WNV disease and can be used to assess statewide mosquito control needs.
As expected, the models predicted high incidence of WNV disease along river basins including the Platte, Arkansas, and Colorado rivers and in the northern Colorado Front Range. Eastern Colorado had greater coverage of areas with predicted high incidence of WNV disease compared with the western part of the state. This may be because of several factors. First, human population density in eastern Colorado (572/km2) is 12-fold greater than in western Colorado (46/km2); the larger human population in the east likely results in a greater likelihood of WNV cases occurring in this region. This was reflected in the model outcomes that showed large areas of predicted high incidence of WNV disease occurring in populated regions especially within the northern Front Range. In more rural areas with focal population centers (e.g., the southern Front Range, eastern plains region, and the central western region), small patches of predicted high incidence of WNV disease overlapped with or occurred in close proximity to population centers (see example in Figure 4).
Second, eastern Colorado has a higher coverage of irrigated agricultural land (18%) compared with the western part (10%), and ponds, small lakes, and riparian areas are common within and adjacent to population centers in the northern Front Range severely impacted by WNV disease (e.g., Boulder, Fort Collins, Greeley, Loveland). Irrigated agricultural land and ponds, lakes, and riparian areas provide larval habitat for Cx. tarsalis19,20,43 and thus may support enzootic WNV amplification cycles. Third, agricultural areas occur commonly on the edges of population centers throughout eastern Colorado. These agricultural areas may provide “source habitats” for Cx. tarsalis, with movement of mosquitoes into nearby urban areas during the summer months when Cx. tarsalis is known to shift from feeding on birds to mammals, including humans.44-46 Fourth, there could be systematic differences in the level of detection and reporting of WNV cases between counties in the eastern and western parts of Colorado. Further research on the spatiotemporal patterns of mosquito populations and WNV transmission in and around population centers in Colorado is urgently needed to improve mosquito control practices.
The selected eastern and western Colorado models included temperature-related variables as important predictors of high WNV disease incidence (Tables 1 and 2). This was not surprising because warm temperatures result in more rapid development rates among the immature life stages and a shorter gonotrophic cycle in Cx. tarsalis, as well as a shorter extrinsic incubation period of WNV in Culex vectors.17,18,47,48 Interestingly, in eastern Colorado, we found a negative association between areas with high WNV disease incidence and temperature in August (i.e., a positive association with heating degree days that reflects the demand for heating energy and therefore has a negative relationship with temperature). This may be explained by (1) high summer temperatures ultimately leading to reduction in availability of natural larval habitat in the semi-arid climate of eastern Colorado and (2) possible negative effects of high temperatures on WNV replication or transmission that previously was shown for western equine encephalitis virus.47,49 In contrast, the selected western Colorado model included a positive association between high WNV disease incidence and temperature in March. This association indicates that early season warm stretches are critical for mosquito population build-up and sets the stage for WNV disease outbreaks in the mountainous, high-elevation landscape of western Colorado (mean zip code elevation was 2,080 m in the western region compared with 1,672 m in the eastern region).
A negative association between summer (July) precipitation and high WNV disease incidence was observed in eastern Colorado. This is not surprising because heavy summer rains can flush out eggs and immatures from larval habitats, especially for Cx. pipiens in urban or semi-urban environments.50 Further research is needed to determine whether the effect of summer precipitation on Culex populations is more detrimental in urban or semi-urban environments where man-made waste water systems concentrate water flow than in rural areas where such systems are lacking.
Normalized difference vegetation index (NDVI) in May was positively associated with high WNV disease incidence in the eastern model. A high NDVI value is associated with abundance of green vegetation, which often is found along riparian areas and around lakes and ponds providing larval habitat.33,51 NDVI was not significantly associated with high WNV disease incidence in the west, perhaps because the distinct elevation and temperature gradients occurring in the mountainous landscape of western Colorado, relative to the eastern plains, result in climate factors being more basic determinants of Culex abundance than abundance of green vegetation.
The user accuracy of the selected models in predicting areas with high WNV disease incidence generally was high. The predictive models for high incidence of WNV disease reliably identified areas that did not report high incidence of WNV disease; user accuracies at the zip code scale (external validation) were 80% for western Colorado and 88% for eastern Colorado. The models for high incidence of WNV disease, which are unlikely to overpredict risk areas, are well suited for determination of critical statewide mosquito control needs.
Several areas in eastern and western Colorado not reporting high WNV disease incidences were predicted by the models to have high incidences of WNV disease. This error of commission may be attributed, in part, to persons without or with only mild symptoms of WNV disease not seeking medical attention. Based on calculations by the Centers for Disease Control and Prevention, only 1 in 150 (0.7%) infections of WNV result in neuroinvasive disease, which typically requires hospitalization.52 Applying this ratio to the 757 West Nile virus disease cases from Colorado that resulted in neuroinvasive disease (encephalitis or meningitis) from 2002 to 2006, the actual number of WNV infections in Colorado during this time period likely exceeded 110,000. Calculations by the Centers for Disease Control and Prevention also estimate that ∼20% of likely WNV infections result in clinical disease (and thus may be recognized and reported). Therefore, of the 110,000 likely infections in Colorado from 2002 to 2006, ∼22,000 cases of clinical disease likely occurred, of which 3,703 WNV disease cases (< 20%) were actually reported. Behavioral practices, such as use of repellents or people spending minimal time outdoors during the peak of the WNV transmission season,13,53,54 as well as mosquito control practices, may have contributed to the errors of commission as neither were considered in our model.
Errors of omission also occurred where high WNV disease incidence was reported within areas predicted by our models to have low risk of WNV disease. Comparison of the zip code–based versus the 2 × 2-km scale high incidence models did, however, show that the more fine-scale model predicted presence of patches of high risk within zip codes with reported high disease incidence but did not contain enough coverage of high risk pixels to classify the entire zip code as predicted high risk. These patches of risk identified by the fine-scale models, but overlooked by the zip code models, show the inherent problems of using a coarse-scale unit to display disease risk and merit the use of fine-scale models. Furthermore, small patches of high risk identified by the fine-scale models were most likely accurate because they often coincided with small (densely populated) census tracts with high reported WNV disease incidence (Figure 4).
Errors of omission may have also resulted from travel or recreationally related WNV exposure outside the zip code of residence. Unfortunately, reliable information on point locations for probable site of WNV exposure was not available for the development of our models. Rather, the models were based on human cases of WNV disease aggregated to the zip code level with a basic assumption that WNV exposure most likely occurred within the zip code of residence. Lack of reliable information for probable sites of pathogen exposure for common and relatively mild vector-borne diseases, such as Lyme disease and WNV disease, is emerging as a major impediment to the development of spatial epidemiology models for vector-borne diseases in the United States.55 Comprehensive case studies including determination of the probable pathogen exposure site for vector-borne diseases are typically only conducted for plague, and the costs and time associated with such investigations are prohibitive for more common and less severe diseases. This underscores the need for a discussion in the public health community of the importance of determining the probable site of WNV exposure, and possibly, for physicians routinely taking standardized travel histories from WNV disease patients.
The multivariate logistic regression models were based on cumulative disease incidence aggregated to zip codes (dependent variable) and raster-based environmental covariates (in-dependent variables). All predictive models were first displayed and validated at the zip code scale. To construct more fine-scale continuous spatial risk surfaces, the same predictive models were applied to 2 × 2-km raster data. External validation of the zip code versus fine-scale 2 × 2-km models showed the zip code models to most accurately identify areas of high WNV disease incidence in eastern Colorado. In western Colorado, the zip code and fine-scale 2 × 2-km models had identical user and producer accuracies. The validation results thus did not provide conclusive evidence for which scale was more appropriate. The lack of point locations of probable WNV exposure for model development likely reduced the usefulness of the fine-scale approach, especially in eastern Colorado. On the other hand, a key advantage of fine-scale spatial risk models is an enhanced ability to target small but important high risk areas occurring within large areas of low risk and obscured at the zip code scale.
Understanding the appropriate scale for model development and the feasibility of scaling-up a model for risk of WNV exposure to a larger area is critical. We therefore studied risk models developed for western or eastern Colorado performed when applied to the other area. The results showed that the models performed far better in the part of Colorado for which they were developed and underscored the importance of selecting a proper scale for model development based on an understanding of the physical environment (the plains landscape of eastern Colorado versus the mountainous landscape of western Colorado) rather than an administrative boundary (the state of Colorado). For example, the model for high WNV disease incidence developed for western Colorado failed to detect large areas with high risk for WNV exposure in the northeastern part of the state (Figure 6), and the model developed for eastern Colorado predicted high WNV disease incidence in parts of northwestern Colorado where very few cases actually occurred (Figure 5). Although Colorado may be an extreme example in terms of topographic, ecologic, and climatic variability, it underscores the importance of careful selection of model development areas for epidemiologic models of vector-borne diseases. Based on similarities in the physical environment, the model from eastern Colorado may perform well throughout the Central Plains, and the model from the western part of the state may be applicable to much of the intermountain west.
Finally, our study highlights one important problem related to mosquito control in Colorado, namely the lack of control activities in rural areas of the eastern plains at high risk for WNV exposure. From a statewide perspective, mosquito control activities accurately target high-risk urban areas along the Colorado River in the west and in the northern Front Range in east-central Colorado, but smaller communities along the Arkansas and Platte rivers in the eastern plains severely impacted by WNV disease and lacking means to pay for mosquito control have been left by the wayside. WNV disease will remain a public health concern in Colorado for the foreseeable future and needs to be addressed in a more comprehensive and evidence-based fashion than the current piecemeal approach that is largely based on control by commercial outfits on year-to-year contracts.
Acknowledgments
The authors thank Michael Johansson and Emily Zielinski-Gutierrez from the Centers for Disease Control and Prevention for helpful discussions.
Financial support: The study was funded by grants from the Centers for Disease Control and Prevention (T01/CCT822307), Colorado State University College of Veterinary Medicine and Biomedical Sciences, and National Institutes of Health contract AI-25489.
Contributor Information
Anna M. Winters, Department of Microbiology, Immunology and Pathology, Colorado State University, Infectious Disease Annex, 1690 Campus Delivery, Fort Collins, CO 80523-1690.
Rebecca J. Eisen, Division of Vector-Borne Infectious Diseases, National Center for Vector-Borne, Zoonotic and Enteric Diseases, Centers for Disease Control and Prevention, Fort Collins, CO 80521
Saul Lozano-Fuentes, Department of Microbiology, Immunology and Pathology, Colorado State University, Infectious Disease Annex, 1690 Campus Delivery, Fort Collins, CO 80523.
Chester G. Moore, Department of Microbiology, Immunology and Pathology, Colorado State University, Infectious Disease Annex, 1690 Campus Delivery, Fort Collins, CO 80523
W. John Pape, Communicable Disease Program, Colorado Department of Public Health and Environment, 4300 Cherry Creek Drive South, Denver, CO 80246..
Lars Eisen, Department of Microbiology, Immunology and Pathology, Colorado State University, Infectious Disease Annex, 1690 Campus Delivery, Fort Collins, CO 80523.
REFERENCES
- 1.Nash D, Mostashari F, Fine A, Miller J, O'Leary D, Murray K, Huang A, Rosenberg A, Greenberg A, Sherman M, Wong S, Layton M. The outbreak of West Nile virus infection in the New York City area in 1999. N Engl J Med. 2001;344:1807–1814. doi: 10.1056/NEJM200106143442401. [DOI] [PubMed] [Google Scholar]
- 2.Hayes EB, Komar N, Nasci RS, Montgomery SP, O'Leary DR, Campbell GL. Epidemiology and transmission dynamics of West Nile virus disease. Emerg Infect Dis. 2005;11:1167–1173. doi: 10.3201/eid1108.050289a. [DOI] [PMC free article] [PubMed] [Google Scholar]
- 3.Colorado Department of Public Health and Environment West Nile Virus. Available at: http://www.cdphe.state.co.us/dc/zoonosis/wnv/. Accessed August 8, 2007.
- 4.Turell MJ, Dohm DJ, Sardelis MR, Oguinn ML, Andreadis TG, Blow JA. An update on the potential of north American mosquitoes (Diptera: Culicidae) to transmit West Nile virus. J Med Entomol. 2005;42:57–62. doi: 10.1093/jmedent/42.1.57. [DOI] [PubMed] [Google Scholar]
- 5.Goddard LB, Roth AE, Reisen WK, Scott TW. Vector competence of California mosquitoes for West Nile virus. Emerg Infect Dis. 2002;8:1385–1391. doi: 10.3201/eid0812.020536. [DOI] [PMC free article] [PubMed] [Google Scholar]
- 6.Reisen W, Lothrop H, Chiles R, Madon M, Cossen C, Woods L, Husted S, Kramer V, Edman J. West Nile virus in California. Emerg Infect Dis. 2004;10:1369–1378. doi: 10.3201/eid1008.040077. [DOI] [PMC free article] [PubMed] [Google Scholar]
- 7.Monath TP. Prospects for development of a vaccine against the West Nile virus. Ann NY Acad Sci. 2001;951:1–12. doi: 10.1111/j.1749-6632.2001.tb02680.x. [DOI] [PubMed] [Google Scholar]
- 8.Gould LH, Fikrig E. West Nile virus: a growing concern? J Clin Invest. 2004;113:1102–1107. doi: 10.1172/JCI21623. [DOI] [PMC free article] [PubMed] [Google Scholar]
- 9.Mason PW, Shustov AV, Frolov I. Production and characterization of vaccines based on flaviviruses defective in replication. Virology. 2006;351:432–443. doi: 10.1016/j.virol.2006.04.003. [DOI] [PMC free article] [PubMed] [Google Scholar]
- 10.Granwehr BP, Lillibridge KM, Higgs S, Mason PW, Aronson JF, Campbell GA, Barrett AD. West Nile virus: where are we now? Lancet Infect Dis. 2004;4:547–556. doi: 10.1016/S1473-3099(04)01128-4. [DOI] [PubMed] [Google Scholar]
- 11.Petersen LR, Marfin AA. West Nile virus: a primer for the clinician. Ann Intern Med. 2002;137:173–179. doi: 10.7326/0003-4819-137-3-200208060-00009. [DOI] [PubMed] [Google Scholar]
- 12.Sampathkumar P. West Nile virus: Epidemiology, clinical presentation, diagnosis, and prevention. Mayo Clin Proc. 2003;78:1137–1144. doi: 10.4065/78.9.1137. [DOI] [PMC free article] [PubMed] [Google Scholar]
- 13.Herrington J. Pre-West Nile virus outbreak: perceptions and practices to prevent mosquito bites and viral encephalitis in the United States. Vector Borne Zoonotic Dis. 2003;3:157–173. doi: 10.1089/153036603322662156. [DOI] [PubMed] [Google Scholar]
- 14.Winters AM, Bolling BG, Beaty BJ, Blair CD, Eisen RJ, Meyer AM, Pape WJ, Moore CG, Eisen L. Combining mosquito vector and human disease data for improved assessment of spatial West Nile virus disease risk. Am J Trop Med Hyg. 2008;78:654–665. [PubMed] [Google Scholar]
- 15.Wegbreit J, Reisen WK. Relationships among weather, mosquito abundance, and encephalitis virus activity in California: Kern County 1990–98. J Am Mosq Control Assoc. 2000;16:22–27. [PubMed] [Google Scholar]
- 16.Reisen WK, Lothrop HD, Hardy JL. Bionomics of Culex tarsalis (Diptera: Culicidae) in relation to arbovirus transmission in southeastern California. J Med Entomol. 1995;32:316–327. doi: 10.1093/jmedent/32.3.316. [DOI] [PubMed] [Google Scholar]
- 17.Reisen WK. Effect of temperature on Culex tarsalis (Diptera: Culicidae) from the Coachella and San Joaquin Valleys of California. J Med Entomol. 1995;32:636–645. doi: 10.1093/jmedent/32.5.636. [DOI] [PubMed] [Google Scholar]
- 18.Reisen WK, Fang Y, Martinez VM. Effects of temperature on the transmission of West Nile virus by Culex tarsalis (Diptera: Culicidae) J Med Entomol. 2006;43:309–317. doi: 10.1603/0022-2585(2006)043[0309:EOTOTT]2.0.CO;2. [DOI] [PubMed] [Google Scholar]
- 19.Reisen WK, Lothrop HD, Presser SB, Hardy JL, Gordon EW. Landscape ecology of arboviruses in southeastern California—temporal and spatial patterns of enzootic activity in Imperial Valley, 1991–1994. J Med Entomol. 1997;34:179–188. doi: 10.1093/jmedent/34.2.179. [DOI] [PubMed] [Google Scholar]
- 20.Reisen WK, Lothrop HD, Presser SB, Milby MM, Hardy JL, Wargo MJ, Emmons RW. Landscape ecology of arboviruses in southern California—temporal and spatial patterns of vector and virus activity in Coachella Valley, 1990–1992. J Med Entomol. 1995;32:255–266. doi: 10.1093/jmedent/32.3.255. [DOI] [PubMed] [Google Scholar]
- 21.Bolling BG, Moore CG, Anderson SL, Blair CD, Beaty BJ. Entomological studies along the Colorado Front Range during a period of intense West Nile virus activity. J Am Mosq Control Assoc. 2007;23:37–46. doi: 10.2987/8756-971X(2007)23[37:ESATCF]2.0.CO;2. [DOI] [PubMed] [Google Scholar]
- 22.Smith GC, Moore CG, Davis T, Savage HM, Thapa AB, Shrestha SL, Karabatsos N. Arbovirus surveillance in northern Colorado, 1987 and 1991. J Med Entomol. 1993;30:257–261. doi: 10.1093/jmedent/30.1.257. [DOI] [PubMed] [Google Scholar]
- 23.Eidson M, Kramer L, Stone W, Hagiwara Y, Schmit K. Dead bird surveillance as an early warning system for West Nile virus. Emerg Infect Dis. 2001;7:631–635. doi: 10.3201/eid0704.010405. [DOI] [PMC free article] [PubMed] [Google Scholar]
- 24.Eidson M, Komar N, Sorhage F, Nelson R, Talbot T, Mostashari F, McLean R. Crow deaths as a sentinel surveillance system for West Nile virus in the northeastern United States, 1999. Emerg Infect Dis. 2001;7:615–620. doi: 10.3201/eid0704.010402. [DOI] [PMC free article] [PubMed] [Google Scholar]
- 25.Mostashari F, Kulldorff M, Hartman JJ, Miller JR, Kulasekera V. Dead bird clusters as an early warning system for West Nile virus activity. Emerg Infect Dis. 2003;9:641–646. doi: 10.3201/eid0906.020794. [DOI] [PMC free article] [PubMed] [Google Scholar]
- 26.Julian KG, Eidson M, Kipp AM, Weiss E, Petersen LR, Miller JR, Hinten SR, Marfin AA. Early season crow mortality as a sentinel for West Nile virus disease in humans, northeastern United States. Vector Borne Zoonotic Dis. 2002;2:145–155. doi: 10.1089/15303660260613710. [DOI] [PubMed] [Google Scholar]
- 27.Guptill SC, Julian KG, Campbell GL, Price SD, Marfin AA. Early-season avian deaths from West Nile virus as warnings of human infection. Emerg Infect Dis. 2003;9:483–484. doi: 10.3201/eid0904.020421. [DOI] [PMC free article] [PubMed] [Google Scholar]
- 28.Nemeth NM, Beckett S, Edwards E, Klenk K, Komar N. Avian mortality surveillance for West Nile virus in Colorado. Am J Trop Med Hyg. 2007;76:431–437. [PubMed] [Google Scholar]
- 29.Brownstein JS, Rosen H, Purdy D, Miller JR, Merlino M, Mostashari F, Fish D. Spatial analysis of West Nile virus: rapid risk assessment of an introduced vector-borne zoonosis. Vector Borne Zoonotic Dis. 2002;2:157–164. doi: 10.1089/15303660260613729. [DOI] [PubMed] [Google Scholar]
- 30.DiMenna MA, Bueno R, Jr, Parmenter RR, Norris DE, Sheyka JM, Molina JL, LaBeau EM, Hatton ES, Glass GE. Emergence of West Nile virus in mosquito (Diptera: Culicidae) communities of the New Mexico Rio Grande Valley. J Med Entomol. 2006;43:594–599. doi: 10.1603/0022-2585(2006)43[594:eownvi]2.0.co;2. [DOI] [PMC free article] [PubMed] [Google Scholar]
- 31.DiMenna MA, Bueno R, Jr, Parmenter RR, Norris DE, Sheyka JM, Molina JL, Labeau EM, Hatton ES, Roberts CM, Glass GE. Urban habitat evaluation for West Nile virus surveillance in mosquitoes in Albuquerque, New Mexico. J Am Mosq Contr Assoc. 2007;23:153–160. doi: 10.2987/8756-971x(2007)23[153:uhefwn]2.0.co;2. [DOI] [PMC free article] [PubMed] [Google Scholar]
- 32.Ruiz M, Tedesco C, McTighe T, Austin C, Kitron U. Environmental and social determinants of human risk during a West Nile virus outbreak in the greater Chicago area, 2002. Int J Health Geogr. 2004;3:8. doi: 10.1186/1476-072X-3-8. [DOI] [PMC free article] [PubMed] [Google Scholar]
- 33.Diuk-Wasser MA, Brown HE, Andreadis TG, Fish D. Modeling the spatial distribution of mosquito vectors for West Nile virus in Connecticut, USA. Vector Borne Zoonotic Dis. 2006;6:283–295. doi: 10.1089/vbz.2006.6.283. [DOI] [PubMed] [Google Scholar]
- 34.Godsey MS, Jr, Blackmore MS, Panella NA, Burkhalter K, Gottfried K, Halsey LA, Rutledge R, Langevin SA, Gates R, Lamonte KM, Lambert A, Lanciotti RS, Blackmore CG, Loyless T, Stark L, Oliveri R, Conti L, Komar N. West Nile virus epizootiology in the southeastern United States, 2001. Vector Borne Zoonotic Dis. 2005;5:82–89. doi: 10.1089/vbz.2005.5.82. [DOI] [PubMed] [Google Scholar]
- 35.White DJ. Vector surveillance for West Nile virus. Ann NY Acad Sci. 2001;951:74–83. doi: 10.1111/j.1749-6632.2001.tb02686.x. [DOI] [PubMed] [Google Scholar]
- 36.Western Regional Climate Center Climate of Colorado. Available at: http://www.wrcc.dri.edu/. Accessed August, 2007.
- 37.Hayes EB, Sejvar JJ, Zaki SR, Lanciotti RS, Bode AV, Campbell GL. Virology, pathology, and clinical manifestations of West Nile virus disease. Emerg Infect Dis. 2005;11:1174–1179. doi: 10.3201/eid1108.050289b. [DOI] [PMC free article] [PubMed] [Google Scholar]
- 38.Burnham K, Anderson D. Model Selection and Multimodel Inference: A Practical Information-Theoretic Approach. Springer; New York: 2002. [Google Scholar]
- 39.Sall J, Creighton L, Lehman A. JMP Start Statistics. Third edition Brooks/Cole; Belmont: 2005. [Google Scholar]
- 40.Congalton R, Green K. Assessing the Accuracy of Remotely Sensed Data: Principles and Practices. Lewis Publishers; Boca Raton, FL: 1999. [Google Scholar]
- 41.Higgs S, Schneider BS, Vanlandingham DL, Klingler KA, Gould EA. Nonviremic transmission of West Nile virus. Proc Natl Acad Sci USA. 2005;102:8871–8874. doi: 10.1073/pnas.0503835102. [DOI] [PMC free article] [PubMed] [Google Scholar]
- 42.Centers for Disease Control and Prevention West Nile virus. Available at: http://www.cdc.gov/ncidod/dvbid/westnile/. Accessed September 21, 2007.
- 43.Miramontes R, Lafferty WE, Lind BK, Oberle MW. Is agricultural activity linked to the incidence of human West Nile virus? Am J Prev Med. 2006;30:160–163. doi: 10.1016/j.amepre.2005.10.008. [DOI] [PubMed] [Google Scholar]
- 44.Kilpatrick AM, Kramer LD, Campbell SR, Alleyne EO, Dobson AP, Daszak P. West Nile virus epidemics in North America are driven by shifts in mosquito feeding behavior. PLoS Biol. 2006;4:606–610. doi: 10.1371/journal.pbio.0040082. [DOI] [PMC free article] [PubMed] [Google Scholar]
- 45.Tempelis CH, Francy DB, Hayes RO, Lofy MF. Variations in feeding patterns of seven culicine mosquitoes on vertebrate hosts in Weld and Larimer counties, Colorado. Am J Trop Med Hyg. 1967;16:111–119. doi: 10.4269/ajtmh.1967.16.111. [DOI] [PubMed] [Google Scholar]
- 46.Tempelis CH, Reeves WC, Bellamy RE, Lofy MF. A three-year study of the feeding habits of Culex tarsalis in Kern County, California. Am J Trop Med Hyg. 1965;14:170–177. doi: 10.4269/ajtmh.1965.14.170. [DOI] [PubMed] [Google Scholar]
- 47.Reisen WK, Meyer RP, Presser SB, Hardy JL. Effect of temperature on the transmission of western equine encephalomyelitis and St. Louis encephalitis viruses by Culex tarsalis (Diptera: Culicidae) J Med Entomol. 1993;30:151–160. doi: 10.1093/jmedent/30.1.151. [DOI] [PubMed] [Google Scholar]
- 48.Hagstrum DW, Workman EB. Interaction of temperature and feeding rate in determining the rate of development of larval Culex tarsalis (Diptera: Culicidae) Ann Entomol Soc Am. 1971;64:668–671. [Google Scholar]
- 49.Kramer LD, Hardy JL, Presser SB. Effect of temperature of extrinsic incubation on the vector competence of Culex tarsalis for Western Equine encephalomyelitis virus. Am J Trop Med Hyg. 1983;32:1130–1139. doi: 10.4269/ajtmh.1983.32.1130. [DOI] [PubMed] [Google Scholar]
- 50.Beehler JW, Mulla MS. Effects of organic enrichment on temporal distribution and abundance of culicine egg rafts. J Am Mosq Control Assoc. 1995;11:167–171. [PubMed] [Google Scholar]
- 51.Ward MP, Ramsay BH, Gallo K. Rural cases of equine West Nile virus encephalomyelitis and the normalized difference vegetation index. Vector Borne Zoonotic Dis. 2005;5:181–188. doi: 10.1089/vbz.2005.5.181. [DOI] [PubMed] [Google Scholar]
- 52.Mostashari F, Bunning ML, Kitsutani PT, Singer DA, Nash D, Cooper MJ, Katz N, Liljebjelke KA, Biggerstaff BJ, Fine AD, Layton MC, Mullin SM, Johnson AJ, Martin DA, Hayes EB, Campbell GL. Epidemic West Nile encephalitis, New York, 1999: results of a household-based seroepidemiological survey. Lancet. 2001;358:261–264. doi: 10.1016/S0140-6736(01)05480-0. [DOI] [PubMed] [Google Scholar]
- 53.Gujral IB, Zielinski-Gutierrez EC, LeBailly A, Nasci R. Behavioral risks for West Nile virus disease, northern Colorado, 2003. Emerg Infect Dis. 2007;13:419–425. doi: 10.3201/eid1303.060941. [DOI] [PMC free article] [PubMed] [Google Scholar]
- 54.O'Leary DR, Marfin AA, Montgomery SP, Kipp AM, Lehman JA, Biggerstaff BJ, Elko VL, Collins PD, Jones JE, Campbell GL, Petersen LR. The epidemic of West Nile virus in the United States, 2002. Vector Borne Zoonotic Dis. 2004;4:61–70. doi: 10.1089/153036604773083004. [DOI] [PubMed] [Google Scholar]
- 55.Eisen L, Eisen RJ. Need for improved methods to collect and present spatial epidemiologic data for vectorborne diseases. Emerg Infect Dis. 2007;13:1816–1820. doi: 10.3201/eid1312.070211. [DOI] [PMC free article] [PubMed] [Google Scholar]