

Abstract
Genome scans of polymorphisms promise to provide insights into the patterns and frequencies of positive selection under natural conditions. The use of microsatellites as markers has the potential to focus on very recent events, since in contrast to SNPs, their high mutation rates should remove signatures of older events. We assess this concept here in a large-scale study. We have analyzed two population pairs of the house mouse, one pair of the subspecies Mus musculus domesticus and the other of M. m. musculus. A total of 915 microsatellite loci chosen to cover the whole genome were assessed in a prescreening procedure, followed by individual typing of candidate loci. Schlötterer's ratio statistics (lnRH) were applied to detect loci with significant deviations from patterns of neutral expectation. For eight loci from each population pair we have determined the size of the potential sweep window and applied a second statistical procedure (linked locus statistics). For the two population pairs, we find five and four significant sweep loci, respectively, with an average estimated window size of 120 kb. On the basis of the analysis of individual allele frequencies, it is possible to identify the most recent sweep, for which we estimate an onset of 400–600 years ago. Given the known population history for the French–German population pair, we infer that the average frequency of selective sweeps in these populations is higher than 1 in 100 generations across the whole genome. We discuss the implications for adaptation processes in natural populations.
THE use of genome scans to detect signatures of selection in populations has become popular, but has also run into a number of statistical problems (Biswas and Akey 2006; Teshima et al. 2006; Thornton et al. 2007). The general principle of any such scan is to detect deviations from the neutral expectation in the pattern of polymorphic markers. However, it has turned out to be difficult to develop appropriate models for neutral expectations, with respect to often unknown influences of population demography and bottlenecks (Haddrill et al. 2005). The validity of many such studies has therefore been questioned and it is clear that at least some of the loci identified in the screens are due to the inherent evolutionary noise in population samples (Biswas and Akey 2006). Most of these problems have arisen in the context of SNP-based screens. SNPs have an inherent low mutation rate and the polymorphism patterns are therefore the products of relatively long population histories; i.e., there is a high chance of undetected demographic perturbations. A focus on very recently separated populations with known population history is also difficult with SNPs, since there is only little variation in such closely related populations, which leads to low statistical power (Zivkovic and Wiehe 2008).
An alternative to scans based on SNP markers are microsatellite genome scans (Schlötterer et al. 1997; Harr et al. 2002; Payseur et al. 2002; Kayser et al. 2003). These have much higher mutation rates, providing sufficient variation in closely related populations, and would reveal only recent selective sweeps. They are evaluated on the basis of a ratio statistic that has been shown to be quite robust against large fluctuations in mutation rates and population sizes (Schlötterer 2002; Kauer et al. 2003). In addition, it is possible to use a second level of analysis based on a set of linked microsatellites, providing an independent test for the confirmation of candidate loci. It is known that the false positive rate of this statistic is very low for the range of bottleneck parameters that is relevant for the present study (Wiehe et al. 2007). Hence, despite the widespread criticism of detecting signatures of selection in molecular data sets, there are promising statistical tools to do genome scans in recently diverged populations and to assess the frequency and nature of signatures of positive selection in natural populations.
We have developed the house mouse Mus musculus as a system for doing such scans (Ihle et al. 2006). Extending our previous study, we focus now specifically on population pairs from two different subspecies. The history of these populations is well understood, on the basis of taxonomic and molecular data (Guénet and Bonhomme 2003; Rajabi-Maham et al. 2008) as well as fossil analysis (Cucchi et al. 2005). There are two subspecies in Europe, M. m. musculus and M. m. domesticus. They most likely originated on the Indian subcontinent up to a million years ago and followed different colonization routes into the rest of the world. M. m. domesticus spread via the Mediterranean into western Europe, while M. m. musculus spread via Asia toward Europe. Currently, a hybrid zone exists in the regions where these populations meet, roughly along a line from Denmark over Vienna into Greece (Boursot et al. 1993). The first fossils of M. m. domesticus in southern France are ∼3000 years old and it appears that western Europe was then quickly colonized by these invaders, which were presumably brought by Phoenician trading ships across the Mediterranean Sea (Cucchi et al. 2005). Populations in western Germany may have been derived from these invaders, but could alternatively also be a composite of populations that at the same time colonized western Europe via the Balkans (Rajabi-Maham et al. 2008). There is currently less detailed information for the M. m. musculus populations, but all evidence points toward a migration route from Asia toward eastern Europe.
We used population samples of M. m. domesticus from southern France (Massif Central) and western Europe (Cologne/Bonn area) and M. m. musculus samples from Kazakhstan (Almaty) and the Czech Republic (near Námest nad Oslavou). The molecular analysis of these populations has shown that they are distinct with no evidence for ongoing gene flow (Ihle et al. 2006). Moreover, average heterozygosities and nucleotide diversities are comparable among them (π for autosomal loci between 0.00126 and 0.00260; Baines and Harr 2007); i.e., there is no evidence for a genetic bottleneck that would have differentially affected a population. We employed an almost 10-fold higher marker density than in our previous study (Ihle et al. 2006) to assess these populations and to identify candidate loci for selective sweeps. Then, we determined the size of the sweep windows around candidate loci. This allows us to extend the statistical analysis and to derive estimates for the selection coefficients that are involved. Our results confirm the existence of significant signatures of selection and a correlation with the population history suggests that these occur at high frequencies.
METHODS
Genome screen:
A total of 960 microsatellite loci were assessed, using the pooling approach described in Thomas et al. (2007). The resulting patterns were visually inspected via pairwise comparisons between the populations within the two subspecies. Loci showing a complex pattern of peaks (indicating a certain degree of polymorphism) in one population and a relatively simple pattern (indicating extreme reduction in variability) in the second were marked as candidates for a selective sweep. In a second step these candidate loci were retyped for ∼40 single individuals from the respective population. Amplification was done following the QIAGEN (Valencia, CA) multiplex kit manual (cat. no. 206143). Flanking sequences of 200 kb surrounding the significant candidate loci were downloaded from GenBank and screened for microsatellite loci [applying the program “tandem repeats finder” (Benson 1999); primer design was carried out applying the software “FastPCR” (http://www.biocenter.helsinki.fi/bi/Programs/fastpcr.htm)].
Statistics:
Gene diversity estimates (expected heterozygosity, corrected for sample size) for all individually genotyped loci were calculated using the program MS Analyzer 3.15 (Dieringer and Schlötterer 2003). lnRH statistics (Kauer et al. 2003) were applied to compare variability levels between the populations. Significance was estimated by normalizing the individual lnRH values with a reference data set representing a genomewide variability distribution between the respective populations. The reference data set contained polymorphism data of 64 microsatellite loci for the domesticus population pair and 52 for the musculus pair, leading to a distribution of gene diversity of 0.087 ± 0.85 (SD) and 0.075 ± 0.93 (SD), respectively.
After a stringent Bonferroni adjustment for multiple testing, significant, z-transformed lnRH values are < −4.0556 or >4.0556, and P-values are <5 × 10⁻⁵.
The linked locus test statistic was done according to Wiehe et al. (2007). We first identified in each candidate region the one locus with minimal lnRH. Then, we summed the lnRH values of upstream and downstream flanking loci, whereby the initially identified minimal value is not included. Under the neutral model, standardized lnRH for each locus is independent and approximately standard normal. Therefore, under neutrality, the sum of lnRH values is still normal. To test whether in a given candidate region observed lnRH values at k linked loci are compatible with the neutral model, we determine the test statistic 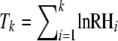 and the P-value from the normal distribution with mean 0 and variance k.
As an ad hoc measure for the size of a sweep window we use the following strategy. First, we determine lnRH(X) of the candidate sweep locus X. Then, we determine the genomic region in which lnRH < lnRH(X)/2 by approaching X from the margins of the region. We call this the “half-life” of the sweep window. The estimated sweep window W is twice this value. We then proceed to estimate a selection coefficient associated with an observed sweep window. The deterministic formula that approximates the reduction of heterozygosity at a neutral marker locus due to a selective sweep at a flanking locus is given by 1 − ɛ(2r/s), where ɛ = 1/(2N), s is the selection coefficient, and r is the recombination rate between the two loci (Stephan et al. 1992). The half-life can be computed by solving  for r. Our final estimate of the sweep window size is four times r (because both sides, upstream and downstream, of the focal locus X have to be considered) and is
 |
where ρ is the recombination rate per nucleotide (0.009 × 10⁻⁶ in our case). Solving this equation for s yields an estimate for the strength of the selection coefficient of the sweep that gave rise to the observed sweep window W. Note that this approach is likely to be an underestimate of the true value, since the deterministic formula above underestimates the size of a sweep window and lnRH(X) is likely to be larger than the actual most extreme lnRH value in the considered candidate region. This leads to an underestimate of s.
Supplemental material:
The following material is supplied as supplemental files: (1) list of all primer sequences, (2) figures for all sweep valleys analyzed, (3) allele-frequency data for all loci analyzed for the Germany–France comparison, and (4) allele-frequency data for all loci analyzed for the Czech–Kazhakstan comparison.
RESULTS
Genome scan:
To obtain a broad genome scan we chose 960 loci randomly from all chromosomes, apart from the Y chromosome, focusing on loci upstream of annotated transcripts. A total of 915 of these could be amplified in all populations and showed a degree of polymorphism suitable for further analysis. To reduce the genotyping effort, we employed a two-step procedure. In the first step, we used pools of DNA from 40 animals of each population and compared variability patterns for each locus, which allows us to retrieve the subset of loci with signs of population-specific loss of polymorphism (Thomas et al. 2007). In the second step we typed these loci individually for ∼40 animals from the respective population pairs.
We emphasize that it is not possible to infer allele numbers or heterozygosities from the peak patterns of the prescreen, because long alleles are underrepresented due to an amplification bias and because they are blurred by the slippage bands that are associated with each allele (Thomas et al. 2007). In addition, this set may contain false positives due to allele-specific primer binding sites. Thus, the further statistical analysis is solely based on the allele frequencies obtained in the second step.
Sweep statistics:
The prescreen allowed us to focus on the loci where a population-specific reduction of the allele pattern was visible. These were then typed for ∼40 individuals per population to allow statistical analysis.
To apply Schlötterer's ratio statistics (Schlötterer 2002; Kauer et al. 2003) we created in parallel two reference sets for each subspecies (64 loci for M. m. domesticus and 52 loci for M. m. musculus). The loci for these sets were chosen randomly across the genome, but in the same general way as the test loci (see methods). Although some of the loci in these reference sets may also have been subject to positive selection, this would result only in a broader distribution of lnRH, which would make the test more conservative. Note that there is no evidence for an influence of recombination rate on the heterozygosity of microsatellite loci in mouse, most likely because of the high mutation rates of these loci (Thomas et al. 2005).
Using the lnRH statistics on individually typed loci from the prescreen (41 from the M. m. domesticus comparison and 38 from the M. m. musculus comparison), we found 8 significant (P < 5 × 10⁻⁵) loci for both the M. m. domesticus population pair and the M. m. musculus population pair. For these loci we then designed primers for flanking microsatellites. These were typed in ∼40 individuals for each population and the lnRH values were calculated. The detailed results for all 16 regions are provided in the supplemental material, and two examples are provided in Figures 1 and 2. The availability of the data for the flanking loci allowed us to apply the linked-locus statistics developed by Wiehe et al. (2007). With this second test, 5 loci remain significant for the M. m. domesticus population pair and four for the M. m. musculus population pair (Table 1).
Figure 1.—

Microsatellite allele spectra in the sweep window region 15E3. The genotyped microsatellite loci in the window are labeled by numbers (X is the originally identified locus while the others were chosen in its vicinity) and their corresponding lnRH values are plotted alongside their location in the window. A value of lnRH < −4.06 is considered to be significant after Bonferroni correction. The solid line represents a sliding-window analysis as averages from four loci. The scale of the window is in base pairs. Annotated transcripts are taken from the NCBI Mouse Genome Resources Build 37.1. Note that Tubgcp6 is only a predicted gene.
Figure 2.—

Microsatellite allele spectra in the sweep window region 14C1. The annotations are as in Figure 1. Transcripts are taken from NCBI Mouse Genome Resources Build 37.1 (similar to TATA-box-binding protein) and from Build 36.1 (Gm534). Both might be pseudogenes.
TABLE 1.
List of all 16 candidate sweep regions analyzed in detail
| Chromosome region/sweep in | Microsatellite locus; positiona | Ratio testb/linked locus testc | Allele pattern | Estimated sweep size (kb) | Gene(s) in the sweep window |
|---|---|---|---|---|---|
| 10C1/Fra | PP3H03; 79,872,040 | 4.13/* | Unclear | 60 | Ubiquinol-cytochrome c reductase (Uqcr), methyl-CpG binding domain protein 3 (Mbd3) |
| 13A1/Fra | PP4H12; 3,806,092 | 4.87/*** | Clear | 90 | Calmodulin-like 3 (Calml3) |
| 19C1/Ger | PP5F12; 30,077,083 | 4.34/NS | Unclear | 40 | Tumor protein D52-like 3 (Trpd52l3) |
| 1D/Fra | PP6E03; 90,650,098 | 4.91/NS | Unclear | 180 | RIKEN cDNA 2410088K16 (XM_001474136) |
| 5E5/Ger | PP7F04; 107,769,982 | 5.22/NS | Indicative | 60 | Bromodomain, testis specific (Brdt) |
| 15E3/Fra | PP8D01; 88,918,855 | 4.26/*** | Very clear | 160 | TraB domain containing (Trabd), tubulin gamma complex-associated protein 6 (Tubgcp6), selenoprotein O (SelO), histone deacetylase 10 (Hdac10) |
| 14C1/Ger | PP9A07; 49,455,135 | 5.50/*** | Very clear | 100 | Similar to TATA-box-binding protein-associated factor (XR_033884) |
| 9F2/Ger | PP10B07; 108,986,179 | 5.61/*** | Clear | 80 | Coiled-coil domain-containing 72 (Ccdc72) |
| 11B5/Cze | PP3A11; 78,056,172 | 5.73/** | Clear | 50 | Stromal cell-derived factor 2 (Sdf2) |
| 16C2/Kaz | PP7G8; 70,313,173 | 4.39/NS | Unclear | 120 | Glucan (1,4-α-), branching enzyme 1 (Gbe1) |
| 17C/Cze | PP8H6; 46,797,337 | 4.32/NS | Unclear | 20 | Cullin 7 (Cul7) |
| 14B/Cze | PP9F7; 40,818,858 | 5.67/*** | Clear | 300 | Similar to isolog of yeast sui1 and rice gos2; XM_001474680 |
| 4B3/Cze | PP10E9; 58,297,807 | 4.48/* | Clear | 180 | Muscle, skeletal, receptor tyrosine kinase (Musk) |
| 8A1.1/Cze | PP10F3; 11,716,939 | 4.84/NS | Unclear | 30 | Mus musculus similar to ribosomal protein L26 (XR_032000) |
| 8A4/Cze | PP10G1; 35,211,105 | 5.28/** | Indicative | 120 | Transmembrane protein 66 (Tmem66), leptin receptor overlapping transcript-like 1 (Leprotl1) |
| 4D3/Kaz | PP10G9; 135,610,554 | 5.49/NS | Unclear | 120 | Ribosomal protein L11 (Rpl1) |
Positions refer to the location (first nucleotide) of the microsatellite in Mouse Genome Build 37.1.
lnRH, absolute z-values.
P-values: NS, nonsignificant; *P < 0.05; **P < 0.01; ***P < 0.001.
Allele spectra:
Examination of the allele spectra can provide important additional information on the regions. Given the high mutation rates at microsatellite loci, one would expect that an allele that has been fixed due to positive selection at a linked site will quickly accumulate new mutations; i.e., the sweep signature will be lost. However, there can be large differences in mutation rates, dependent on the length of the allele (Brandstrom and Ellegren 2008). Accordingly, if a locus with a high mutation rate flanks a locus with a low mutation rate, one would expect that it does not retain a significant sweep signature, although it may originally also have been affected by the sweep. This effect can be assessed when the allele spectra in the windows are further analyzed and can be used to make inferences on the relative age of the sweep. In the following we discuss this for two loci that can serve as examples.
Region 15E3:
This region shows the expected ideal pattern with four neighboring microsatellite loci being clearly affected by the sweep in the French population (Figure 2, loci X, 2, 3, and 4). For each of the four loci, it is an intermediate-size allele that is almost fixed in the French sample, while the same loci have a relatively broad spectrum in the German sample. The flanking loci on both sides have a broad allele spectrum in both populations. Thus, this region shows all the expected hallmarks of a recent sweep, with nearly fixed alleles at loci in the center of the region and no indication that these alleles could have reduced mutation rates. The estimated sweep window size is 160 kb (Table 1). The region harbors several annotated genes, two of which are in the center of the sweep region. This gene is selenoprotein O, one of the few genes that incorporates the rare amino acid selenocysteine. However, a specific function is not yet known for this protein.
Region 14C1:
This region harbors within the sweep window two loci with strong signatures, as well as two with a weaker signature (Figure 2, loci X, 4, 5, and 6). It is therefore a candidate region for a sweep having occurred in the German population a longer time ago and where some loci have recovered allelic variance. This interpretation is in line with the allele patterns. The high-frequency alleles for loci X and 6 are at the lower end of the spectrum and are therefore expected to show a lower mutation rate. In contrast, the high-frequency alleles for the loci in between (i.e., loci 4 and 5) represent intermediate-size alleles, with a higher propensity to generate new variants. The further flanking loci 3 and 8 also have high-frequency intermediate-size alleles in the German sample, which are part of a large spectrum of alleles. Hence, they may also have been originally affected and have since recovered almost normal variance. Because of this uncertainty, it is more difficult to assess the size of the sweep window. The core window size could be again ∼50 kb, but up to 100 kb cannot be excluded. According to Mouse Genome Build 37.1 this region harbors only a single transcript, which appears to be an intron-free recent duplicate of a member of the TATA-box-binding proteins.
Using these lines of arguments, we assessed all 16 regions that were analyzed in detail, including those where the stringent statistical analysis did not provide significant evidence (Table 1). In general we find that the statistical assessment and the assessment of the allele spectra are in good accordance. Only for region 10C1 did we find no clear pattern in the allele spectra, yet the linked locus statistic is marginally significant (0.0467). On the other hand, for region 5E5 we find an indicative allele spectrum pattern, but the linked locus statistic is marginally not significant (0.078). Hence the assessment of the allele spectra on their own is already a good predictor of the statistical outcome. This is not trivial, since different criteria are used for these assessments. The visual assessment, for example, does not use data from reference sets of loci, but is based only on general rules of microsatellite evolution, such as higher mutation rate of long alleles and the stepwise model. On the other hand, the statistical evaluation cannot directly suggest whether the sweep is recent or old, because it ignores the size of the swept allele, but this can be inferred from the allele spectra.
Assessing the sizes of the sweep windows is complicated by the fact that the different microsatellite loci have different mutational characteristics. As an ad hoc measure, we use twice the size of the interval in which lnRH is less than lnRH(X)/2, where lnRH(X) is the lnRH value observed at the sweep locus (see methods). This results in a window size range from 20 to 300 kb (Table 1), with an average of 126 kb for the significant regions. In most cases there is only one gene annotated in the region. The genes that are potentially affected do not fall into any particular category; rather, they seem to reflect a more or less random subset of genes.
DISCUSSION
The general utility of using microsatellites for detecting selective sweeps has previously been demonstrated (Harr et al. 2002; Ihle et al. 2006; Kane and Rieseberg 2007). Here we show that our two-step procedure with prescreens of pooled samples, followed by individual typing of candidate loci, simplifies the procedure considerably, opening up the possibility to use them for large genome scans between closely related populations. Moreover, the combination of statistical procedures and visual inspection of allele spectra can provide additional confidence. Hence, we consider the loci identified here as true candidates for selective sweeps. This allows us to make several general statements about the frequency and types of sweeps that can be found in natural populations of the house mouse.
Population characteristics:
We find a similar number of significant sweep regions for both population comparisons (five vs. four), but in the case of the two M. m. musculus populations, all significant regions occur in the Czech population, while the ratio is 2:3 in the German–French comparison. The relative (albeit not significant) lack of significant sweep regions in the Kazakh population may be due to the fact that this may be an ancestral population, which may not have been subject to many recent adaptations. The other populations are postglacial invaders that are relatively new in their respective environments. The German–French population split may have occurred only 3000 years ago, after the invasion of M. m. domesticus of western Europe (Cucchi et al. 2005). There are some indications that the German population may be a composite of two populations that followed different invasion routes (Rajabi-Maham et al. 2008). However, this would also have occurred a few thousand years ago; i.e., the current population can be considered to be close to equilibrium. The German and French populations are living under comparable ecological conditions. Although the French one is farther to the south, it is also at a higher altitude, which compensates for latitude. Hence, we do not expect very different local adaptations between these populations.
Sweep window sizes:
Sweep window sizes could potentially be large for recent strong selection events, but we find no evidence for this. This suggests that we deal generally with small selection coefficients. Assuming an average recombination rate of ∼0.9 cM/Mb (estimate based on the maps provided in Shifman et al. 2006), one would end up with an average selection coefficient of s ∼ 0.008 for the average window size of 126 kb (see methods). Although this result is likely to be an underestimate of the true selection coefficient, it is in line with the assumption that very strong selection events should be rare in natural populations (Johnson and Barton 2005).
Age of the sweeps:
One of the nine significant sweep regions appears to have a particularly recent origin, namely region 15E3 in the French population (Figure 1). The affected microsatellite loci show intermediate-length alleles close to fixation, with only a few additional alleles flanking them, i.e., possible new mutations generated in a stepwise mutation process. The locus has a repeat length of ∼20 bp, which suggests a mutation rate of ∼0.5 × 10⁻⁴ per generation (Webster et al. 2002). One can use this for some rough calculations on the age of this sweep. Under a deterministic codominant model, one can estimate the time it takes from the origin of the allele [frequency ɛ = 1/(2N); N = population size] until near fixation (frequency 1 − ɛ) with a given selection coefficient (s) as t = 2/s ln(1/ɛ). Assuming s = 0.01 (for the sweep window of 160 kb) and Ne = 10,000, one can calculate a fixation time of ∼2000 generations. However, the deterministic model is rather conservative for this situation and using an approximation for ɛ as ɛ* = 1/(4Ns) (Kim and Nielsen 2004) would suggest that it takes only ∼1200 generations. The affected microsatellite allele would have acquired mutations during this time at a level of ∼5% (using the above mutation rate), which is indeed the level that we find. Hence, not much time could have passed since the fixation of the sweep allele; i.e., the onset of this particular sweep should have been no more than 400–600 years ago (assuming 3 generations per year).
For all other regions, we find the sweep alleles either at the lower end of the allele spectrum or within loci with only few alleles, i.e., both indicators of low mutation rate. The loci with inferred high mutation rates that are intermingled among these show always multiple alleles. Hence, the onset of the sweep would have been longer ago in these regions and the signature is retained only in the loci or alleles with low mutation rate. Nevertheless, assuming mutation rates in the order of 10−5–10−6 per generation for such loci, we would still be looking at events that have occurred in the past tens of thousands of generations.
We note that it would be more difficult to assess whether a sweep has occurred very recently on the basis of SNP data. Although such data are in principle very useful for identifying the selected site (Beisswanger and Stephan 2008), the signatures are retained for extended times, because of the low mutation rates. LD patterns could potentially provide evidence for the age of a sweep in SNP data, but these can be confounded by several variables (McVean 2007). Hence, the analysis of microsatellite allele patterns has the potential to focus on recent sweeps and to catch adaptation in action.
Frequency of selective sweeps:
Our data allow a rough calculation of the frequency of positive selection in natural mouse populations. For this, we take the French–German population split to have occurred 3000 years ago (Cucchi et al. 2005). With an average of 3 generations per year, this would amount to 9000 generations in each lineage after the split. If we assume further that our screen would have detected 20-kb windows (the window sizes calculated above are larger, but only the centers of these would be detected in our stringent screening procedure), we can calculate that our 915-locus screen has covered ∼1.8 × 10⁷ bp, or ∼1% of the mouse genome. Given that two and three significant regions were detected in each population, we anticipate that 200–300 sweeps have occurred in 9000 generations, or one in 30–45 generations. However, we cannot exclude that the German and French populations actually separated a longer time ago, but certainly not more than 12,000 years ago (Rajabi-Maham et al. 2008). This would still result in a sweep frequency of about one in 100 generations. In fact, this is a conservative estimate, since older sweeps are detected only with loci or alleles with low mutation rates. Moreover, our screening procedure would strongly underestimate the frequency of sweeps that were caused by mutations from standing variation, i.e., where the selected allele is present in multiple copies at the onset of the sweep and can thus be linked to different microsatellite alleles.
There are comparable previous estimates on the frequency of selection in humans and Drosophila. On the basis of the correlation pattern between recombination rate and nucleotide diversity, Nachman (2001) estimated that 1 of 50 substitutions between humans and chimpanzees may have been fixed due to positive selection, which would amount to 1 in 40 generations (calculating a 15-year generation time and 9 million years divergence time in each lineage). Genome data comparison in Drosophila suggests that the rate of amino acid substitution driven by positive selection is ∼1 in 450 generations (Smith and Eyre-Walker 2002). The inclusion of conserved noncoding regions in this estimate raises this up to 10 in 100 generations (Andolfatto 2005). An analysis of codons with two substitutions in mouse vs. rat suggests also a strong contribution of positive selection, although the rates cannot be directly compared to the above rates (Bazykin et al. 2004). Thus, there is increasing evidence that positive selection contributes to genome evolution to a degree that exceeds previous inferences (Haldane 1957). It was previously proposed that a high rate of positive selection in natural populations would have consequences for the estimation of population genetical parameters under the neutral model (Gillespie 2000; Smith and Eyre-Walker 2002).
Adaptation models:
Understanding the dynamics of adaptation processes in natural populations is currently one of the major challenges in evolutionary biology (Orr 2005) and our results can contribute to this discussion. The fact that we find a high frequency of sweeps in natural populations that are not living under significantly different ecological conditions suggests a more or less continuous occurrence of adaptation cycles at many loci across the genome. There are several possible scenarios for this and we discuss only some of them.
One reason for a continuous need for adaptations might be related to the “Red Queen model,” which suggests that there is a permanent arms race between parasites and their hosts (Van Valen 1973). In this case one would expect that immunity-related genes would be the main target of selection. While we found some evidence for sweeps in such genes in our previous study (Ihle et al. 2006), none of the genes identified in this study appears to be specifically related to immunity. Sexual selection might be another driver of continuous adaptations, in particular for testis expressed genes (Kleene 2005). But again we find no excess of such genes in our set. Only the gene in region 5E5 (Brdt—marginally nonsignificant in the linked locus test) is known to have a specific function in male germ cell differentiation (Shang et al. 2007). A more general model along these lines would be intraspecific competition, assumed to be triggered by the density of a phenotype's competitors (e.g., Rosenzweig 1978; Christiansen 1988; Sinervo and Svensson 2002). These models imply that populations never reach an adaptive peak and, hence, continuous adaptations are required, which could affect any type of gene. This mechanism would act more efficiently in populations that have colonized new areas that offer new ecological niches. Thus, this model would explain why we find more significant sweeps in the European populations than in the Kazakh population.
A completely different model would assume that populations that colonize new areas go first through a series of major new adaptations with associated pleiotropic effects (Johnson and Barton 2005; Orr 2005). Subsequent to the colonization, further adaptation cycles of minor effects might then be required to compensate for adverse side effects. Again, this would not make a particular prediction toward the types of genes that could be involved, but would imply that signatures of major adaptations would be traceable in comparison to the founder population.
For the time being none of these models can be ruled out completely. However, the fact that the gene classes that we identify are broadly scattered suggests that the more general models are more likely to apply. Further insights will be gained by broadening the microsatellite screens across the genome, ideally targeting all loci in many population samples.
Acknowledgments
We thank Sonja Ihle and Susanne Krächter for the mouse samples, Birgit Schmitz for help with typing, and Bettina Harr and Michael Nachman for comments. This work was supported by grants from the Volkswagen Foundation to D.T. and from the German Science Foundation (DFG-SFB 680) to D.T. and T.W.
References
- Andolfatto, P., 2005. Adaptive evolution of non-coding DNA in Drosophila. Nature 437 1149–1152. [DOI] [PubMed] [Google Scholar]
- Baines, J. F., and B. Harr, 2007. Reduced X-linked diversity in derived populations of house mice. Genetics 175 1911–1921. [DOI] [PMC free article] [PubMed] [Google Scholar]
- Bazykin, G. A., F. A. Kondrashov, A. Y. Ogurtsov, S. Sunyaev and A. S. Kondrashov, 2004. Positive selection at sites of multiple amino acid replacements since rat-mouse divergence. Nature 429 558–562. [DOI] [PubMed] [Google Scholar]
- Beisswanger, S., and W. Stephan, 2008. Evidence that strong positive selection drives neofunctionalization in the tandemly duplicated polyhomeotic genes in Drosophila. Proc. Natl. Acad. Sci. USA 105 5447–5452. [DOI] [PMC free article] [PubMed] [Google Scholar]
- Benson, G., 1999. Tandem repeats finder: a program to analyze DNA sequences. Nucleic Acids Res. 27 573–580. [DOI] [PMC free article] [PubMed] [Google Scholar]
- Biswas, S., and J. M. Akey, 2006. Genomic insights into positive selection. Trends Genet. 22 437–446. [DOI] [PubMed] [Google Scholar]
- Boursot, P., J. C. Auffray, J. Britton-Davidian and F. Bonhomme, 1993. The evolution of house mice. Annu. Rev. Ecol. Sys. 24 119–152. [Google Scholar]
- Brandstrom, M., and H. Ellegren, 2008. Genome-wide analysis of microsatellite polymorphism circumventing the ascertainment bias. Genome Res. 18 881–887. [DOI] [PMC free article] [PubMed] [Google Scholar]
- Christiansen, F. B., 1988. Frequency dependence and competition. Philos. Trans. R. Soc. Lond. B Biol. Sci. 319 587–600. [DOI] [PubMed] [Google Scholar]
- Cucchi, T., J.-D. Vigne and J.-C. Auffray, 2005. First occurrence of the house mouse (Mus musculus domesticus Schwarz & Schwarz, 1943) in the Western Mediterranean: a zooarchaeological revision of subfossil occurrences. Biol. J. Linn. Soc. 84 429–446. [Google Scholar]
- Dieringer, D., and C. Schlötterer, 2003. Microsatellite analyser (MSA): a platform independent analysis tool for large microsatellite data sets. Mol. Ecol. Notes 3 167–169. [Google Scholar]
- Gillespie, J. H., 2000. Genetic drift in an infinite population. The pseudohitchhiking model. Genetics 155 909–919. [DOI] [PMC free article] [PubMed] [Google Scholar]
- Guénet, J. L., and F. Bonhomme, 2003. Wild mice: an ever-increasing contribution to a popular mammalian model. Trends Genet. 19 24–31. [DOI] [PubMed] [Google Scholar]
- Haddrill, P. R., K. R. Thornton, B. Charlesworth and P. Andolfatto, 2005. Multilocus patterns of nucleotide variability and the demographic and selection history of Drosophila melanogaster populations. Genome Res. 15 790–799. [DOI] [PMC free article] [PubMed] [Google Scholar]
- Haldane, J. B. S., 1957. The cost of natural selection. J. Genet. 55 511–524. [Google Scholar]
- Harr, B., M. Kauer and C. Schlötterer, 2002. Hitchhiking mapping—a population based fine scale mapping strategy for adaptive mutations in Drosophila melanogaster. Proc. Natl. Acad. Sci. USA 99 12949–12954. [DOI] [PMC free article] [PubMed] [Google Scholar]
- Ihle, S., I. Ravaoarimanana, M. Thomas and D. Tautz, 2006. Tracing signatures of selective sweeps in natural populations of the house mouse. Mol. Biol. Evol. 23 790–797. [DOI] [PubMed] [Google Scholar]
- Johnson, T., and N. Barton, 2005. Theoretical models of selection and mutation on quantitative traits. Philos. Trans. R. Soc. Lond. B Biol. Sci. 360 1411–1425. [DOI] [PMC free article] [PubMed] [Google Scholar]
- Kane, N. C., and L. H. Rieseberg, 2007. Selective sweeps reveal candidate genes for adaptation to drought and salt tolerance in common sunflower, Helianthus annuus. Genetics 175 1823–1834. [DOI] [PMC free article] [PubMed] [Google Scholar]
- Kauer, M. O., D. Dieringer and C. Schlötterer, 2003. A multilocus variability screen for positive selection associated with the “out of Africa” habitat expansion of Drosophila melanogaster. Genetics 165 1137–1148. [DOI] [PMC free article] [PubMed] [Google Scholar]
- Kayser, M., S. Bauer and M. Stoneking, 2003. A genome scan to detect candidate regions influenced by local natural selection in human populations. Mol. Biol. Evol. 20 893–900. [DOI] [PubMed] [Google Scholar]
- Kim, Y., and R. Nielsen, 2004. Linkage disequilibrium as a signature of selective sweeps. Genetics 167 1513–1524. [DOI] [PMC free article] [PubMed] [Google Scholar]
- Kleene, K. C., 2005. Sexual selection, genetic conflict, selfish genes, and the atypical patterns of gene expression in spermatogenic cells. Dev. Biol. 277 16–26. [DOI] [PubMed] [Google Scholar]
- McVean, G., 2007. The structure of linkage disequilibrium around a selective sweep. Genetics 175 1395–1406. [DOI] [PMC free article] [PubMed] [Google Scholar]
- Nachman, M. W., 2001. Single nucleotide polymorphisms and recombination rate in humans. Trends Genet. 17 481–485. [DOI] [PubMed] [Google Scholar]
- Orr, H. A., 2005. The genetic theory of adaptation: a brief history. Nat. Rev. Genet. 6 119–127. [DOI] [PubMed] [Google Scholar]
- Payseur, B. A., A. D. Cutter and M. W. Nachman, 2002. Seaching for evidence of positive selection in the human genome using patterns of microsatellite variability. Mol. Ecol. Evol. 19 1143–1153. [DOI] [PubMed] [Google Scholar]
- Rajabi-Maham, H., A. Orth and F. Bonhomme, 2008. Phylogeography and postglacial expansion of Mus musculus domesticus inferred from mitochondrial DNA coalescent, from Iran to Europe. Mol. Ecol. 17 627–641. [DOI] [PubMed] [Google Scholar]
- Rosenzweig, M. L., 1978. Competitive speciation. Biol. J. Linn. Soc. 10(3): 275–289. [Google Scholar]
- Schlötterer, C., 2002. A microsatellite-based multilocus screen for the identification of local selective sweeps. Genetics 160 753–763. [DOI] [PMC free article] [PubMed] [Google Scholar]
- Schlötterer, C., C. Vogl and D. Tautz, 1997. Polymorphism and locus-specific effects on polymorphism at microsatellite loci in natural Drosophila melanogaster populations. Genetics 146 309–320. [DOI] [PMC free article] [PubMed] [Google Scholar]
- Shang, E., H. D. Nickerson, D. Wen, X. Wang and D. J. Wolgemuth, 2007. The first bromodomain of Brdt, a testis-specific member of the BET sub-family of double-bromodomain-containing proteins, is essential for male germ cell differentiation. Development 134 3507–3515. [DOI] [PubMed] [Google Scholar]
- Shifman, S., J. Tzenova Bell, R. R. Copley, M. S. Taylor, R. W. Williams et al., 2006. A high-resolution single nucleotide polymorphism genetic map of the house mouse. PLoS Biol. 4 e395. [DOI] [PMC free article] [PubMed] [Google Scholar]
- Sinervo, B., and E. Svensson, 2002. Correlational selection and the evolution of genomic architecture. Heredity 89 329–338. [DOI] [PubMed] [Google Scholar]
- Smith, N. G., and A. Eyre-Walker, 2002. Adaptive protein evolution in Drosophila. Nature 415 1022–1024. [DOI] [PubMed] [Google Scholar]
- Stephan, W., T. H. E. Wiehe and M. Lenz, 1992. The effect of strongly selected substitutions on neutral polymorphism: analytical results based on diffusion theory. Theor. Popul. Biol. Sci. 41 237–254. [Google Scholar]
- Teshima, K. M., G. Coop and M. Przeworski, 2006. How reliable are empirical genomic scans for selective sweeps? Genome Res. 16 702–712. [DOI] [PMC free article] [PubMed] [Google Scholar]
- Thomas, M., S. Ihle, I. Ravaoarimanana, S. Kraechter, T. Wiehe et al., 2005. Microsatellite variability in wild populations of the house mouse is not influenced by differences in chromosomal recombination rates. Biol. J. Linn. Soc. 84 629–635. [Google Scholar]
- Thomas, M., F. Möller, T. Wiehe and D. Tautz, 2007. A pooling approach to detect signatures of selective sweeps in genome scans using microsatellites. Mol. Ecol. Notes 7 400–403. [Google Scholar]
- Thornton, K. R., J. D. Jensen, C. Becquet and P. Andolfatto, 2007. Progress and prospects in mapping recent selection in the genome. Heredity 98 340–348. [DOI] [PubMed] [Google Scholar]
- Van Valen, L., 1973. A new evolutionary law. Evol. Theory 1 1–30. [Google Scholar]
- Webster, M. T., N. G. Smith and H. Ellegren, 2002. Microsatellite evolution inferred from human-chimpanzee genomic sequence alignments. Proc. Natl. Acad. Sci. USA 99 8748–8753. [DOI] [PMC free article] [PubMed] [Google Scholar]
- Wiehe, T., V. Nolte, D. Zivkovic and C. Schlötterer, 2007. Identification of selective sweeps using a dynamically adjusted number of linked microsatellites. Genetics 175 207–218. [DOI] [PMC free article] [PubMed] [Google Scholar]
- Zivkovic, D., and T. Wiehe, 2008. Second order moments of segregating sites under variable population size. Genetics 180 341–357. [DOI] [PMC free article] [PubMed] [Google Scholar]