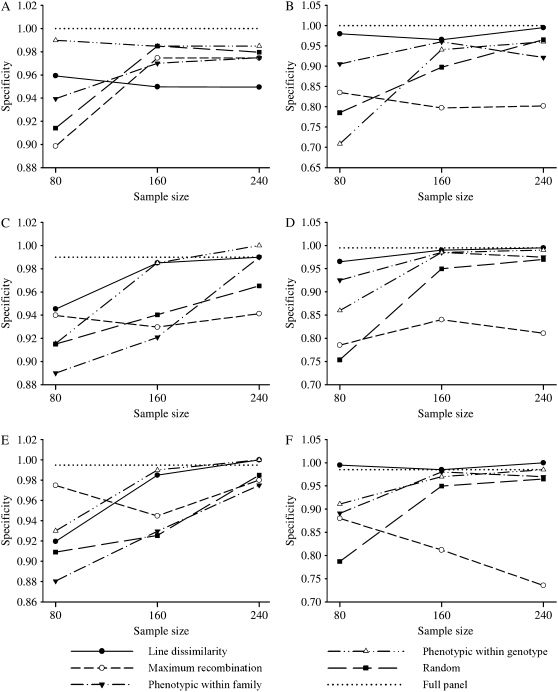
Figure 6.—
Specificity of quantitative trait locus detection averaged over the replicates for the different selective phenotyping strategies and sample sizes, from bivariate (A, C, and E) and univariate analysis methods (B, D, and F), for the high- (A and B), low- (C and D), and medium- (E and F) correlation scenarios. The specificity for the full panel (sample size 510) is plotted as a dotted line for reference.

